Chapter 10 Index evaluation
10.1 Index trend (2 years)10
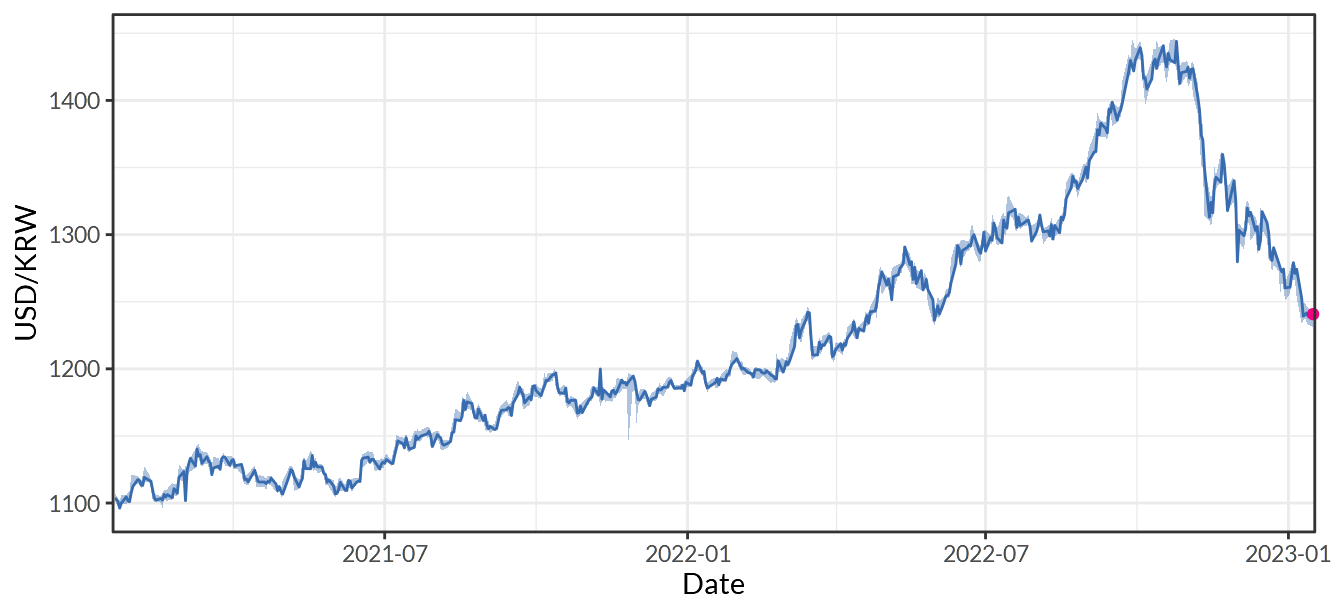
Figure 10.1: South Korea/U.S. Foreign Exchange Rate
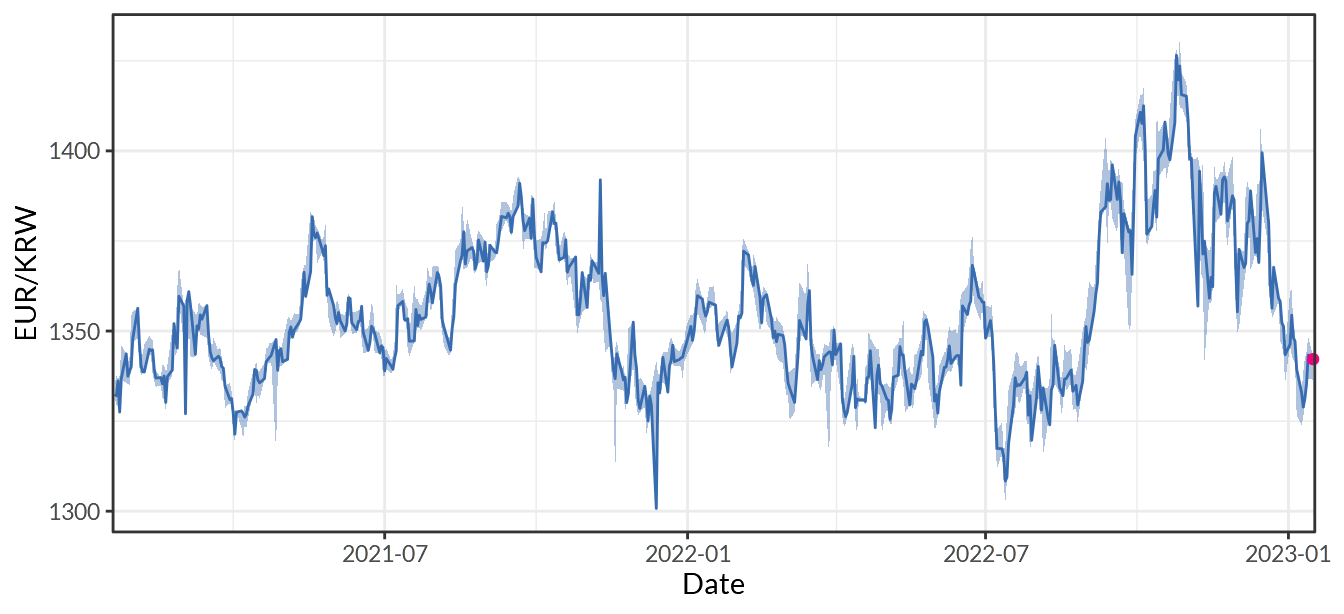
Figure 10.2: South Korea/Europe Foreign Exchange Rate
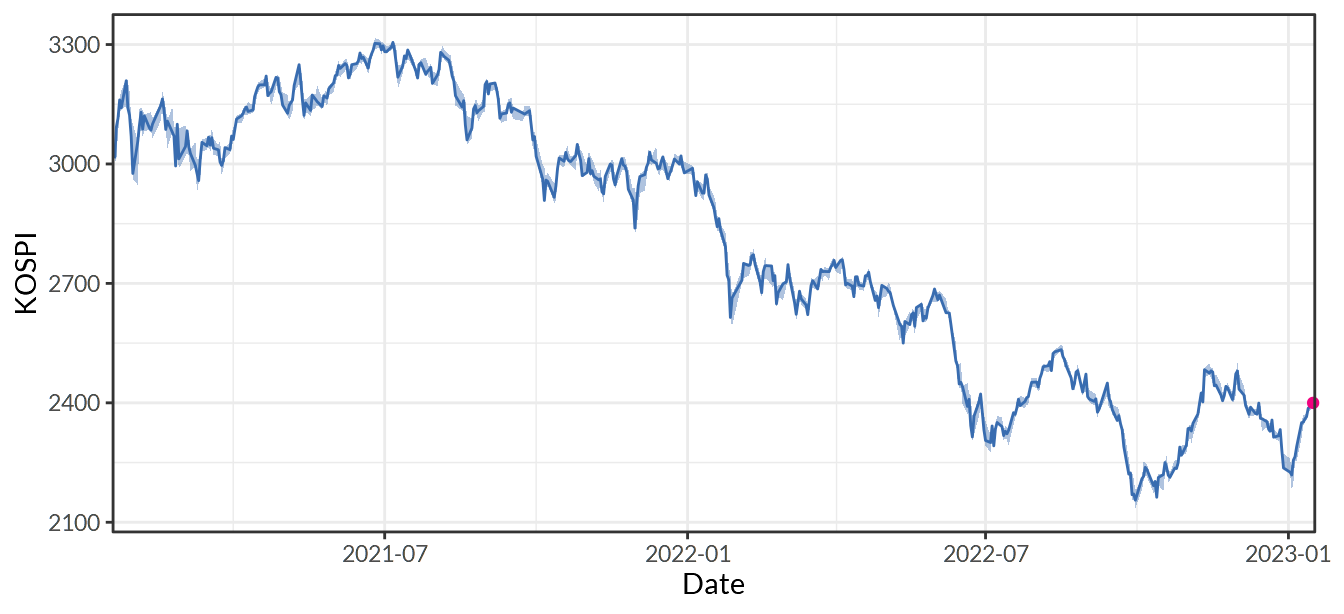
Figure 10.3: KOSPI Index
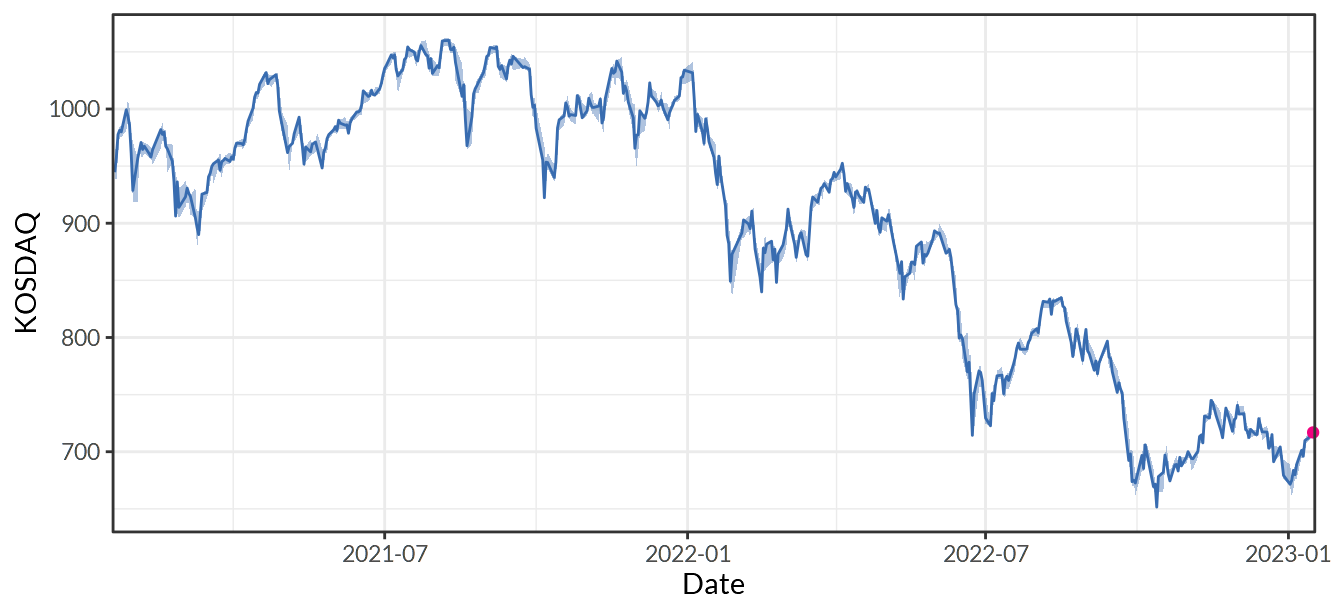
Figure 10.4: KOSDAQ Index
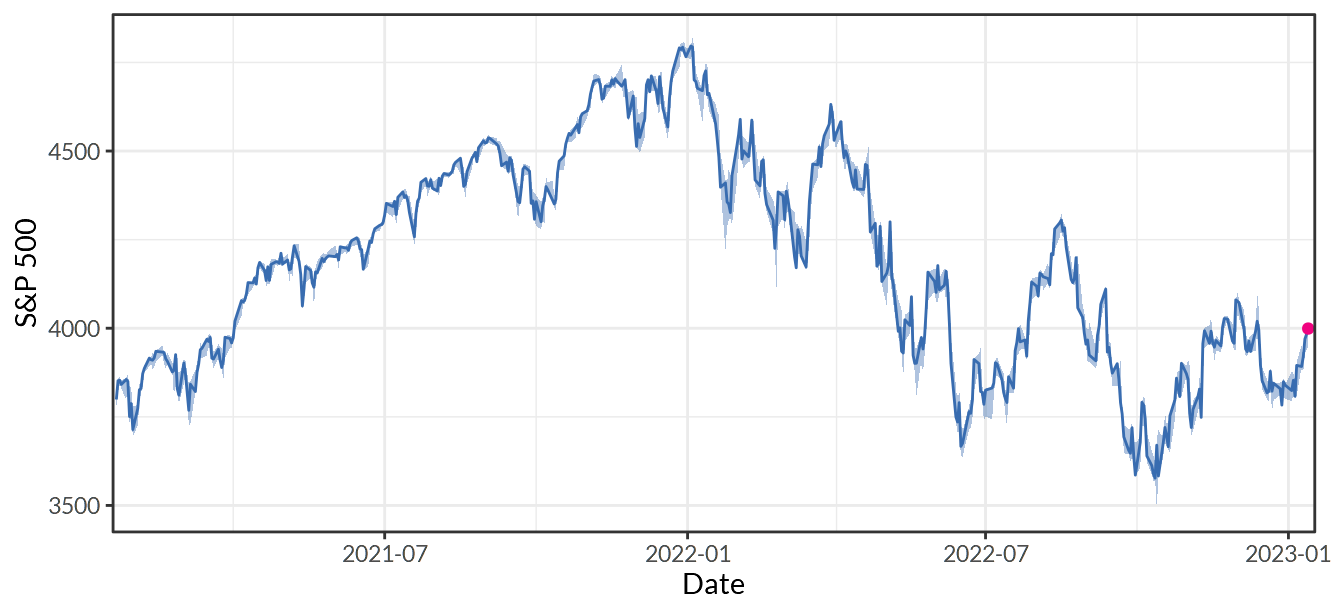
Figure 10.5: S&P 500 Index
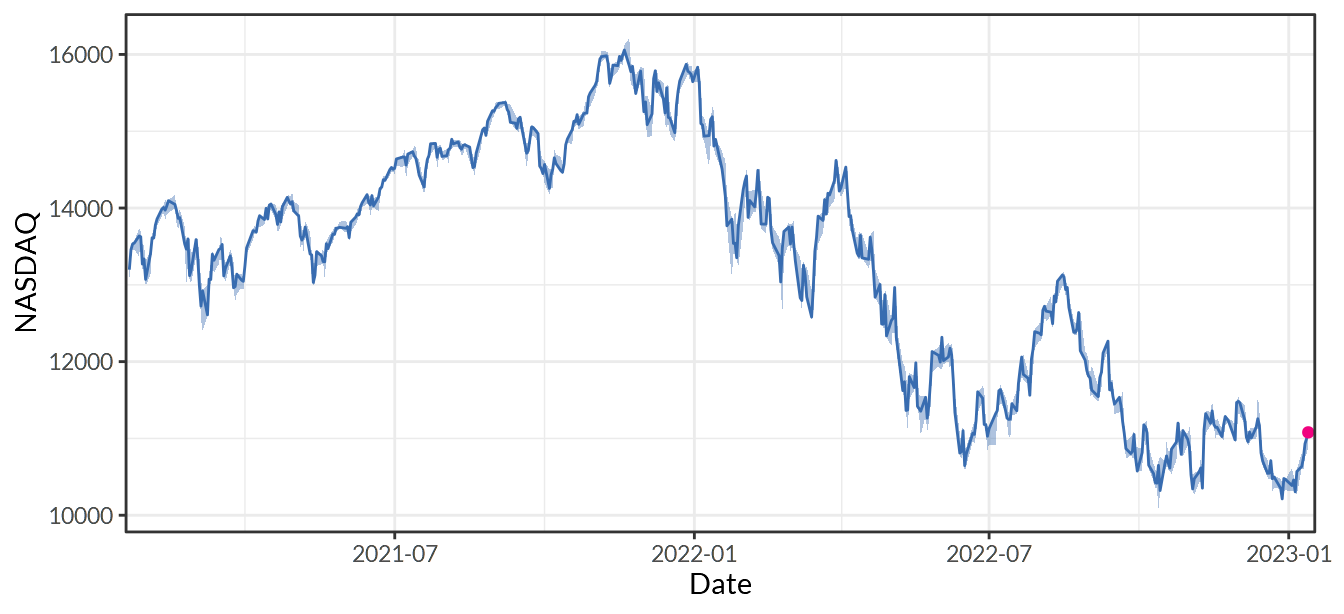
Figure 10.6: NASDAQ Composite Index
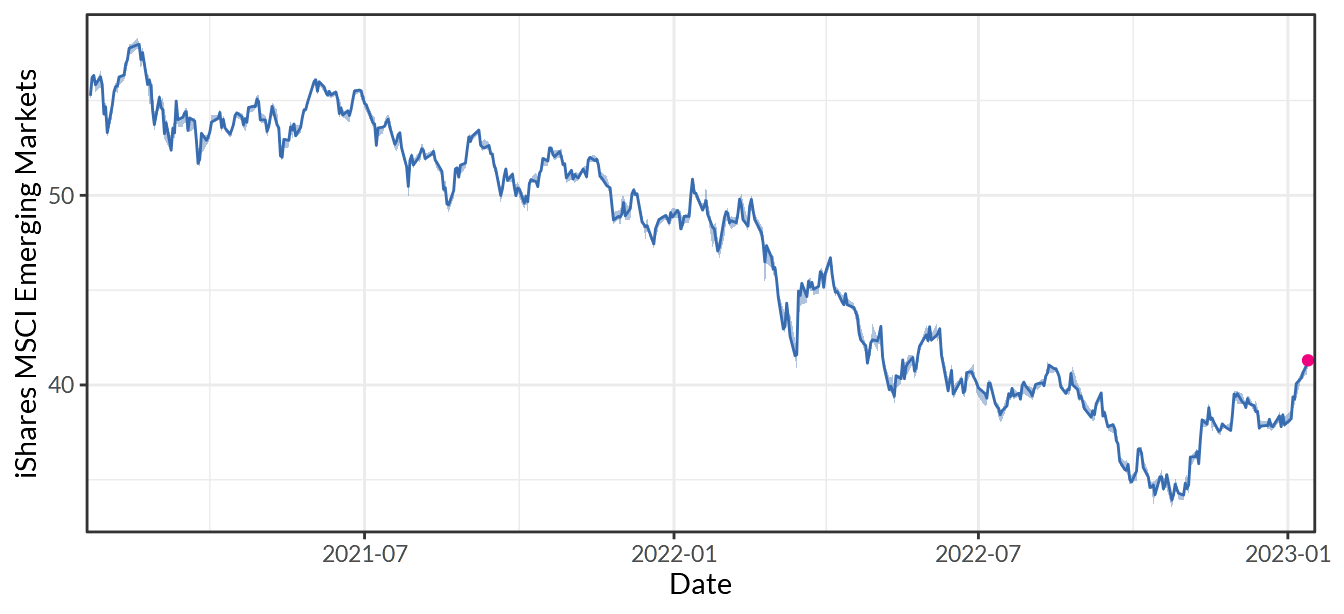
Figure 10.7: iShares MSCI Emerging Markets ETF
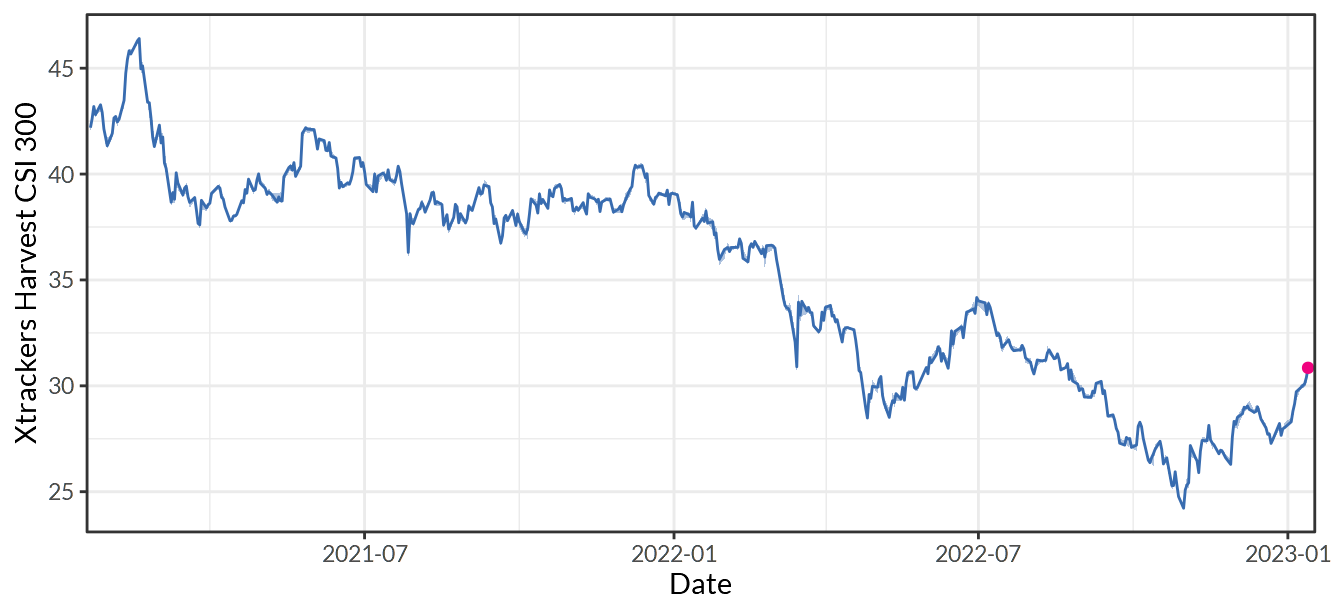
Figure 10.8: Xtrackers Harvest CSI 300 China A-Shares ETF
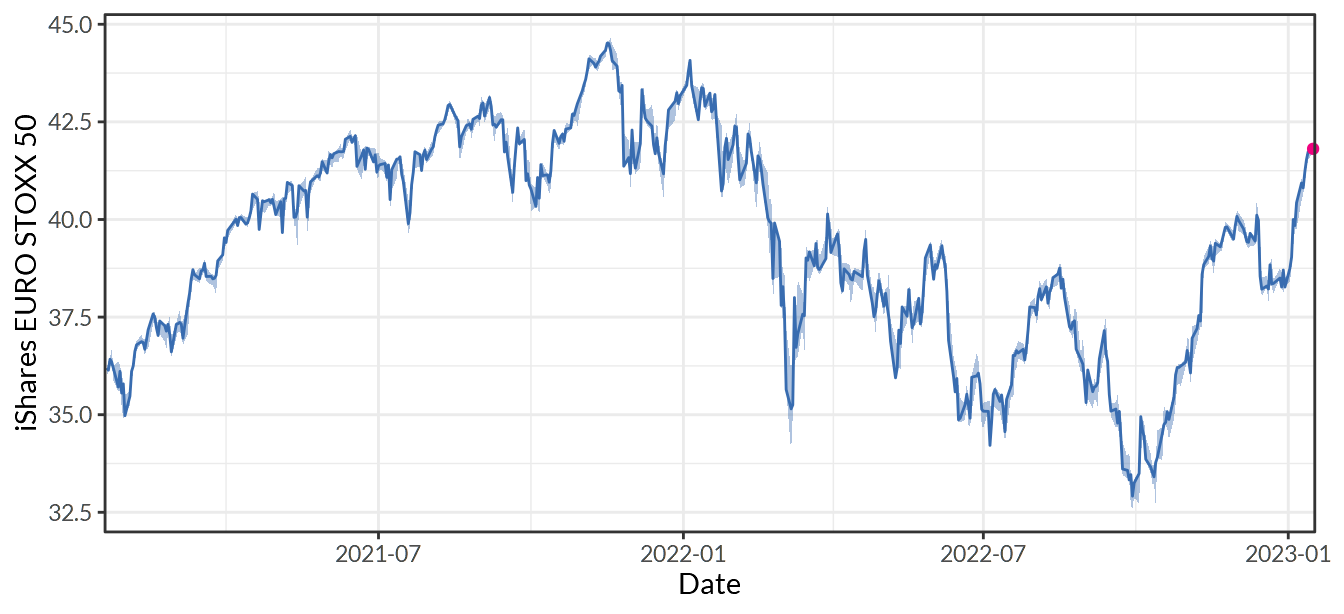
Figure 10.9: iShares EURO STOXX 50 UCITS ETF (DE)
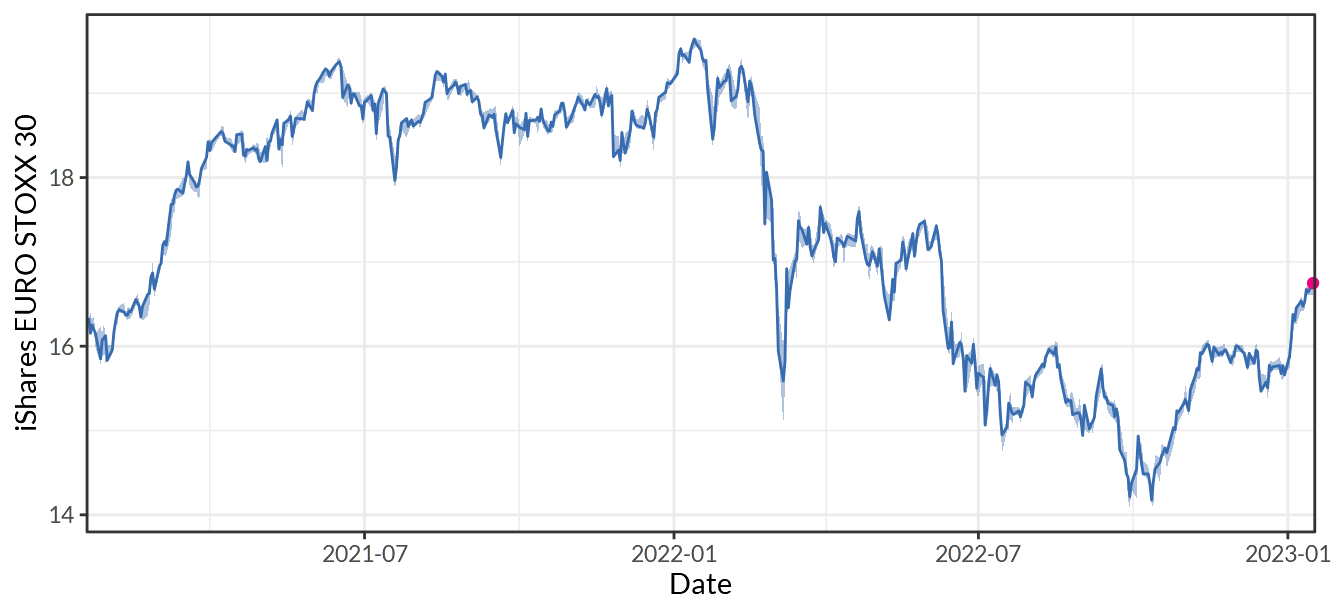
Figure 10.10: iShares EURO STOXX Select Dividend 30 UCITS ETF (DE)
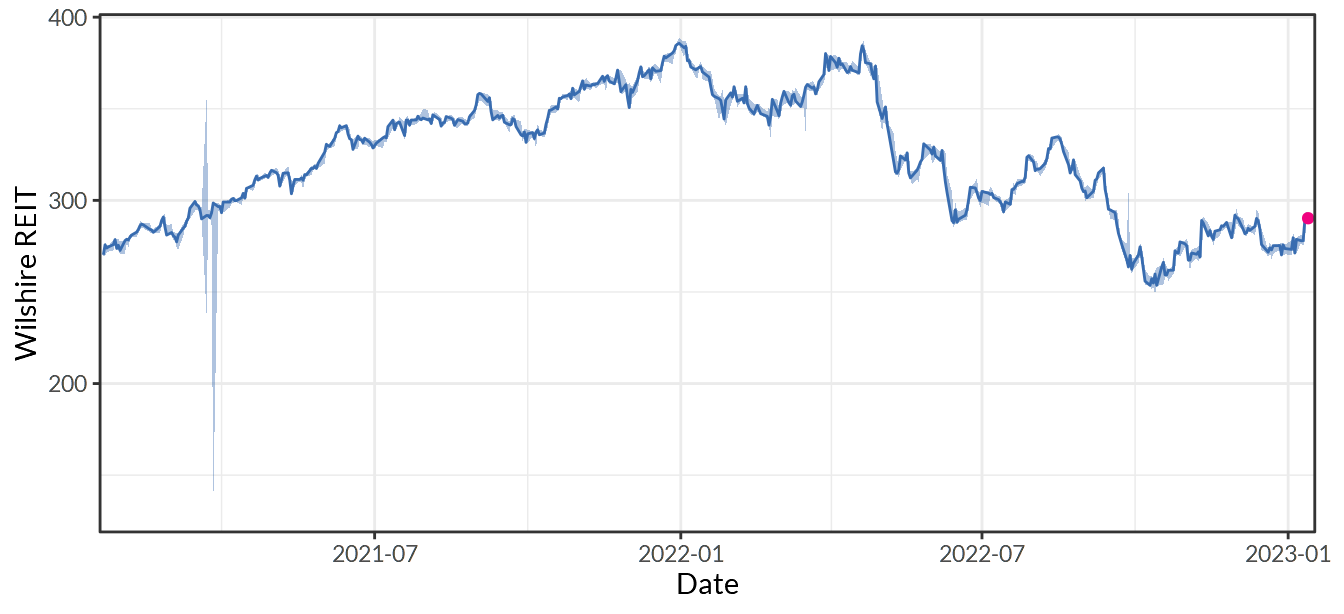
Figure 10.11: Wilshire US REIT Index
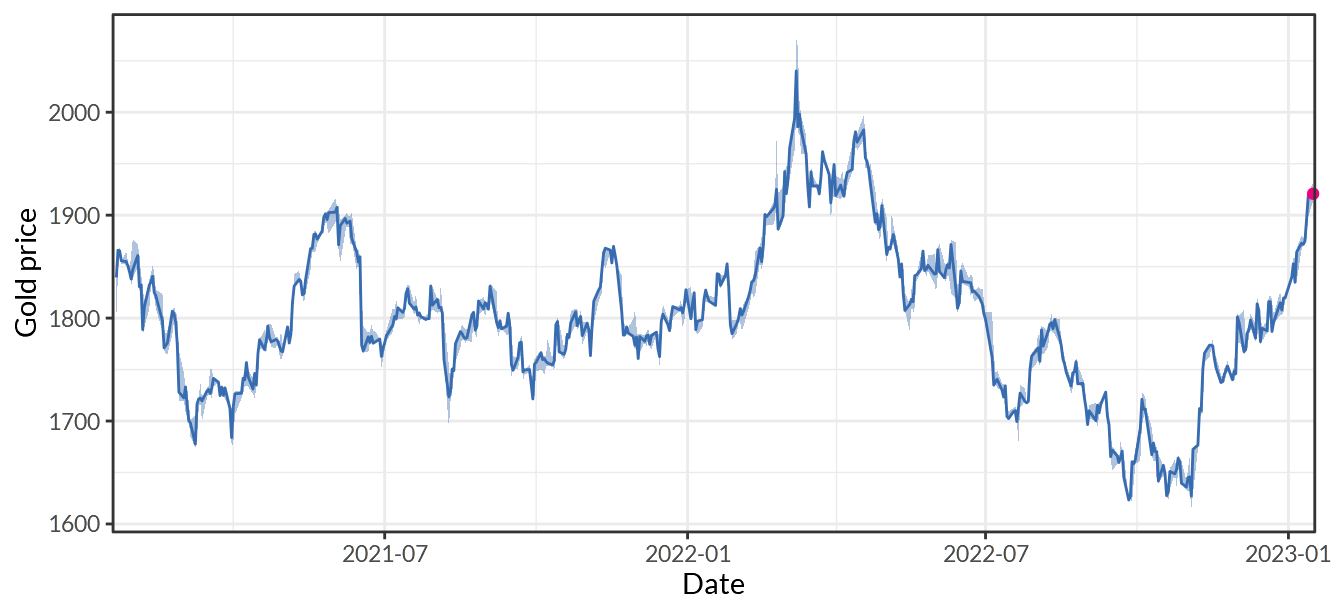
Figure 10.12: Gold
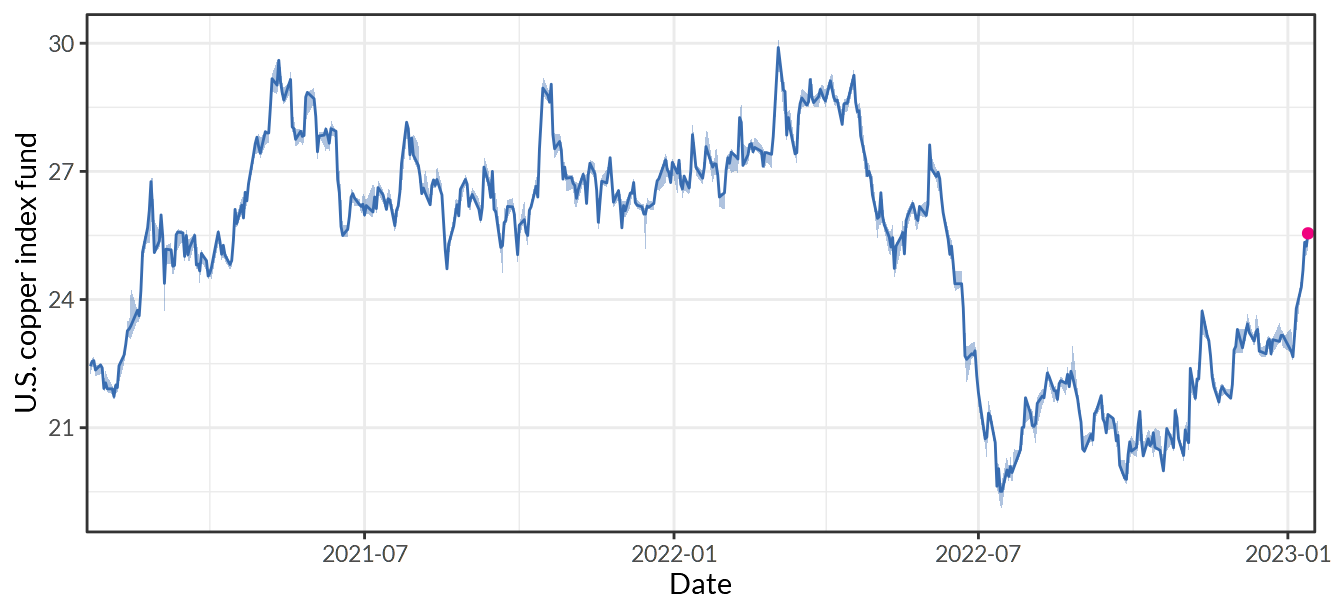
Figure 10.13: U.S Copper Index Fund, LP
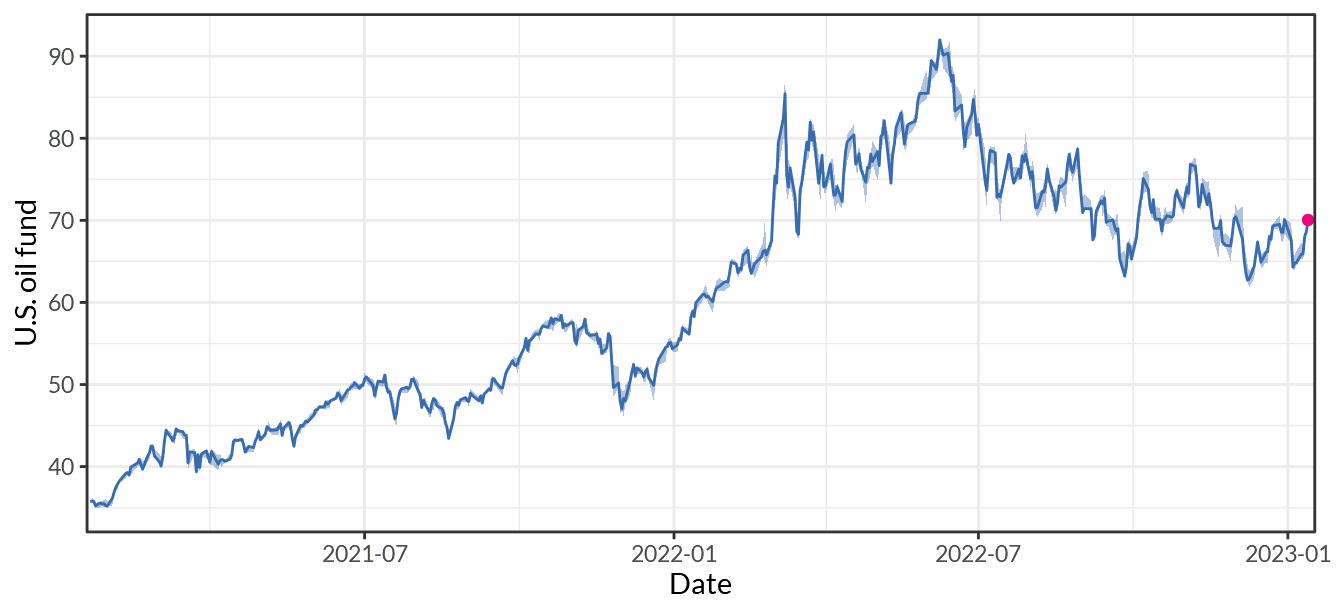
Figure 10.14: U.S. Oil Fund, LP
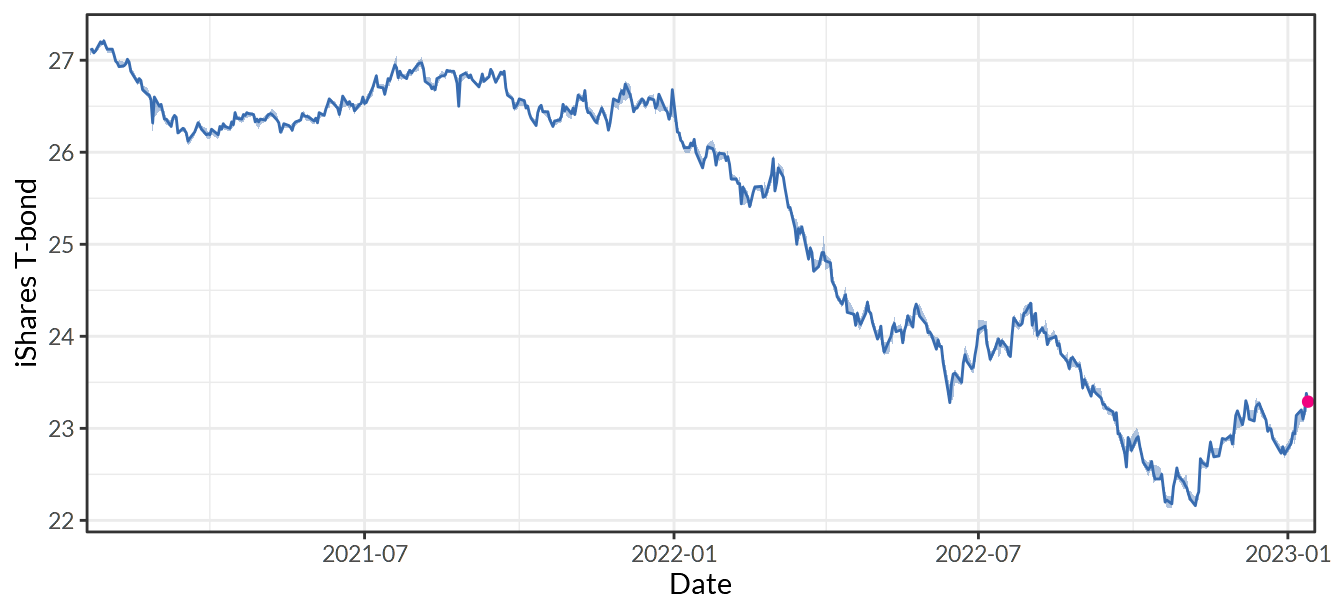
Figure 10.15: iShares U.S. Treasury Bond ETF
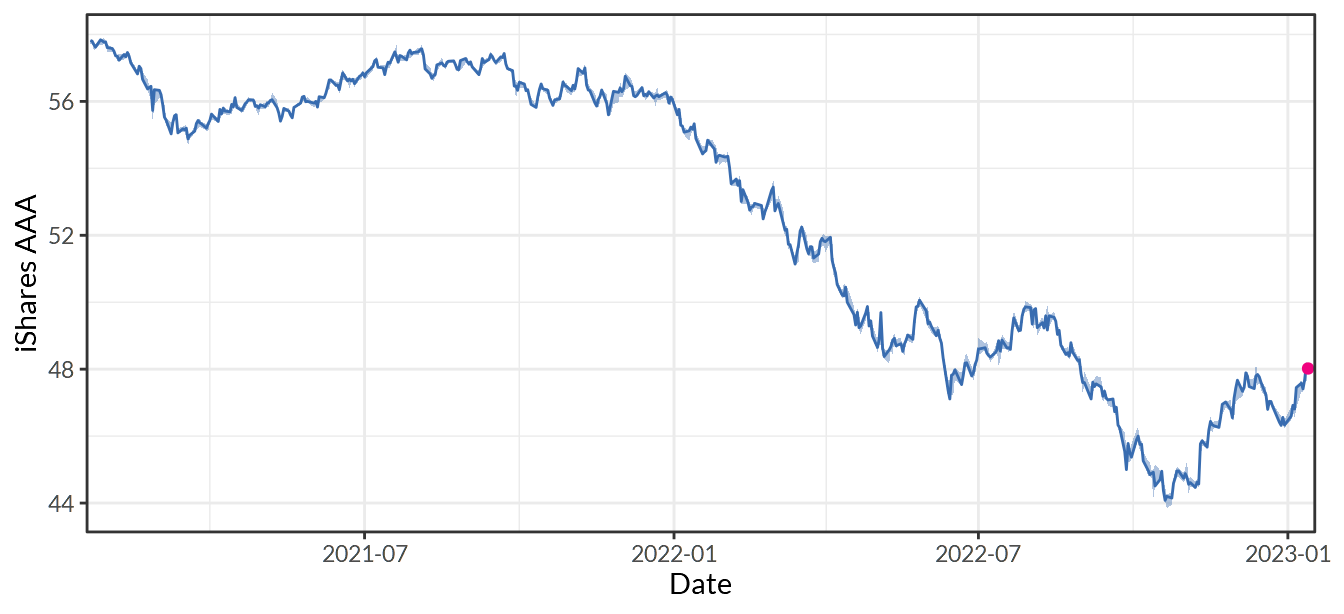
Figure 10.16: iShares Aaa - A Rated Corporate Bond ETF
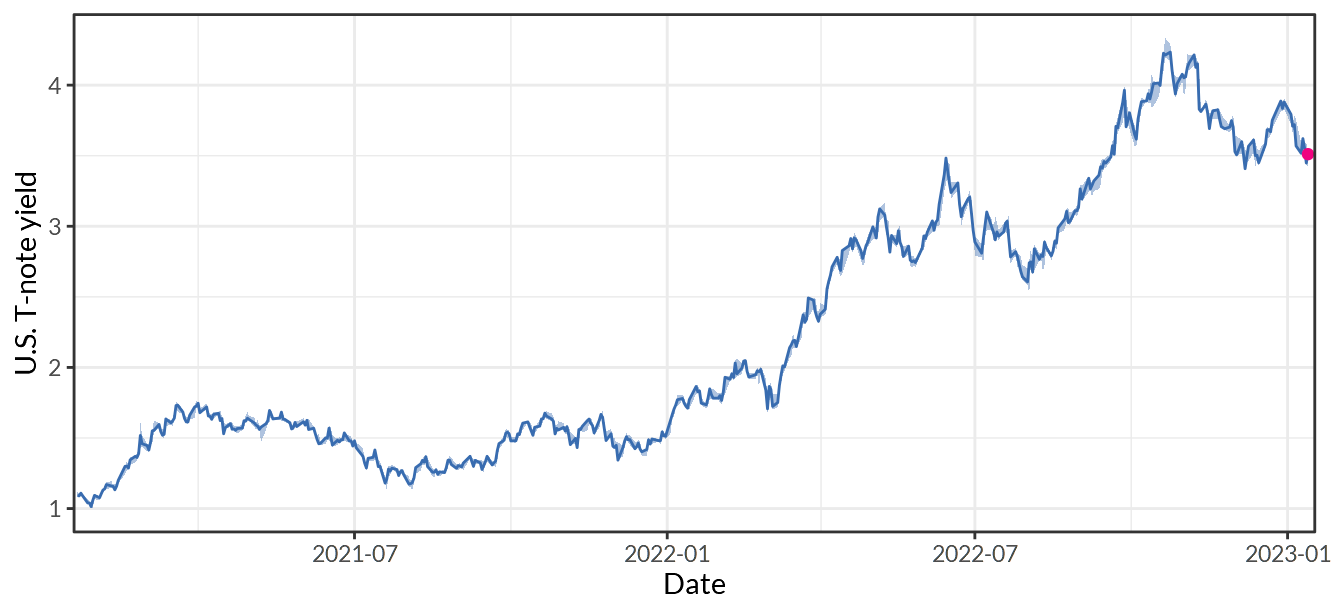
Figure 10.17: Treasury Yield 10 Years
10.2 Index trend (30 years)11
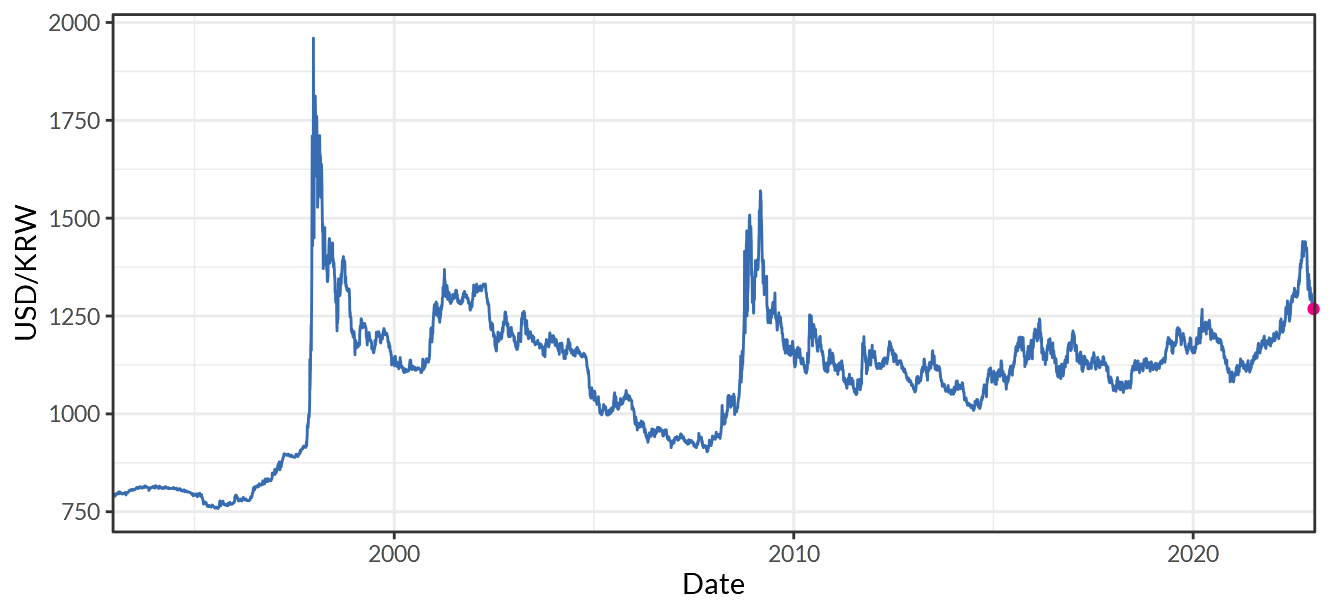
Figure 10.18: South Korea/U.S. Foreign Exchange Rate
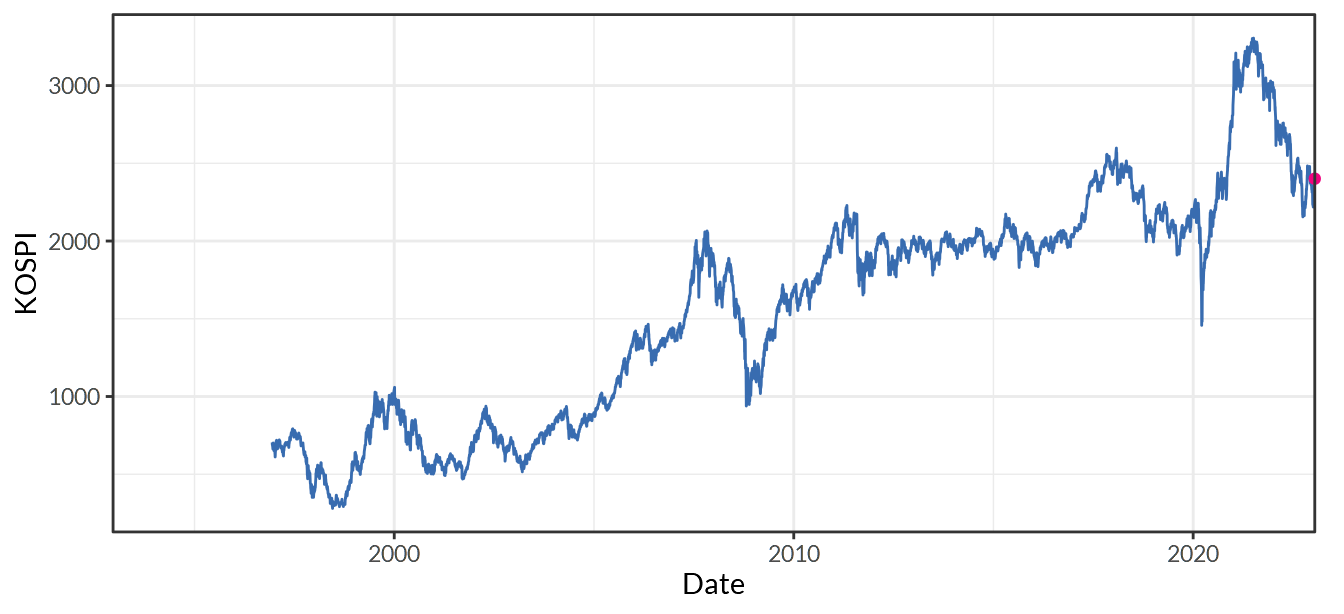
Figure 10.19: KOSPI Index
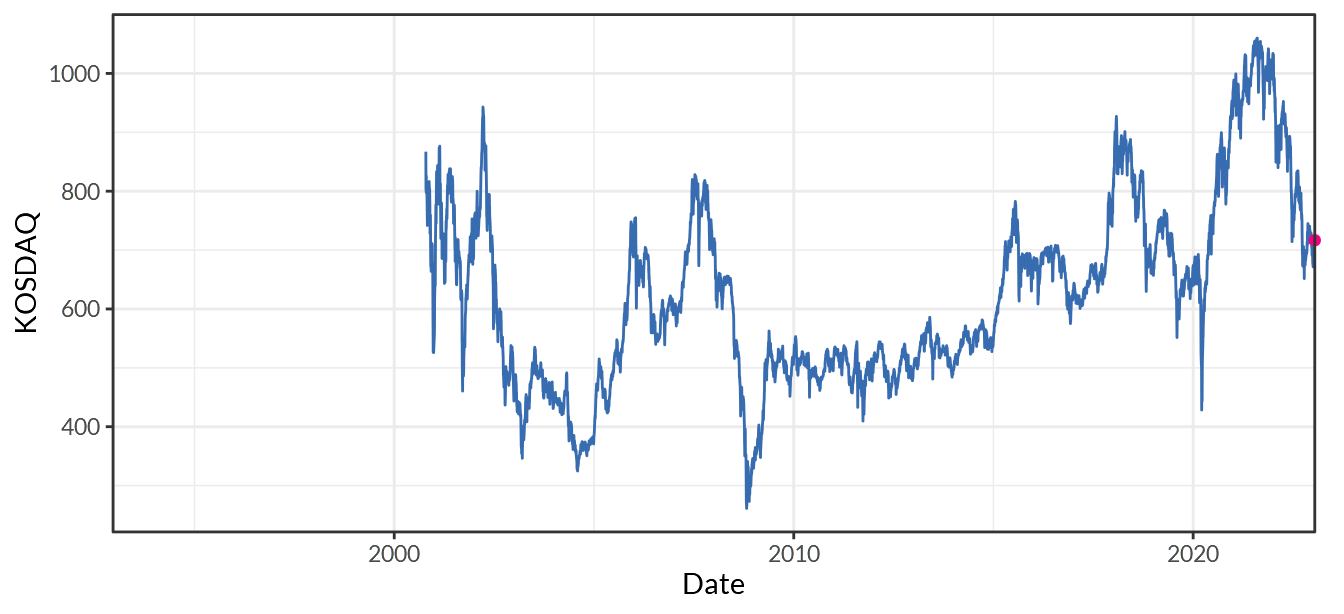
Figure 10.20: KOSDAQ Index
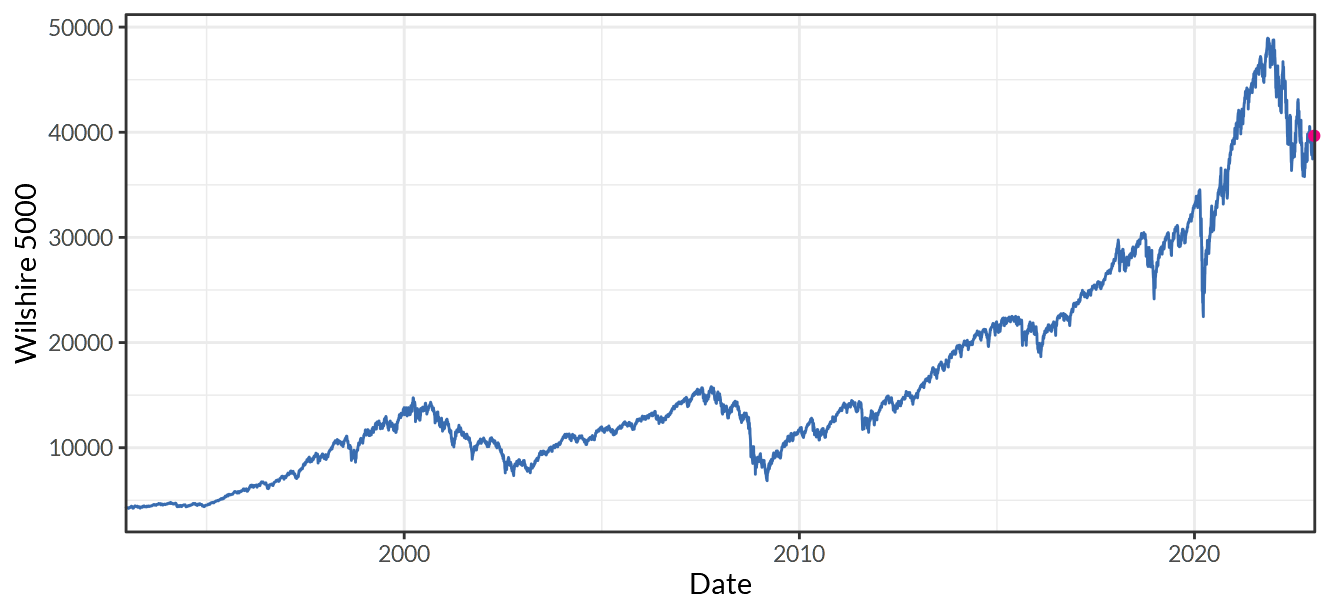
Figure 10.21: Wilshire 5000 Full Cap Price Index
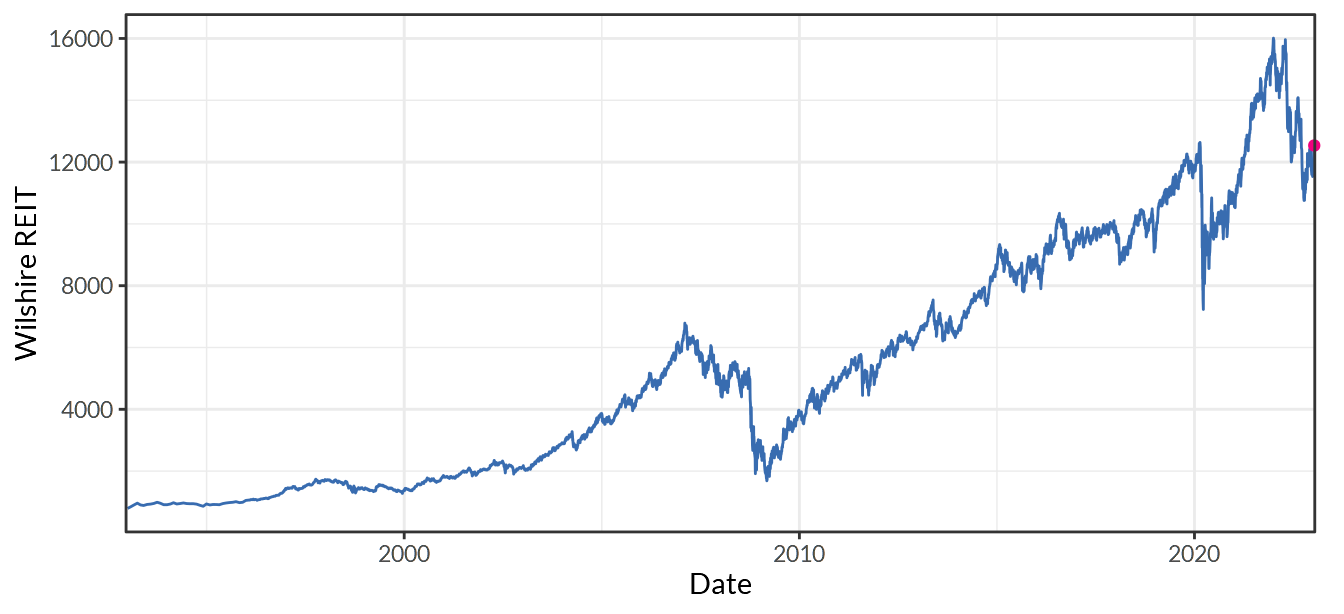
Figure 10.22: Wilshire US REIT Total Market Index
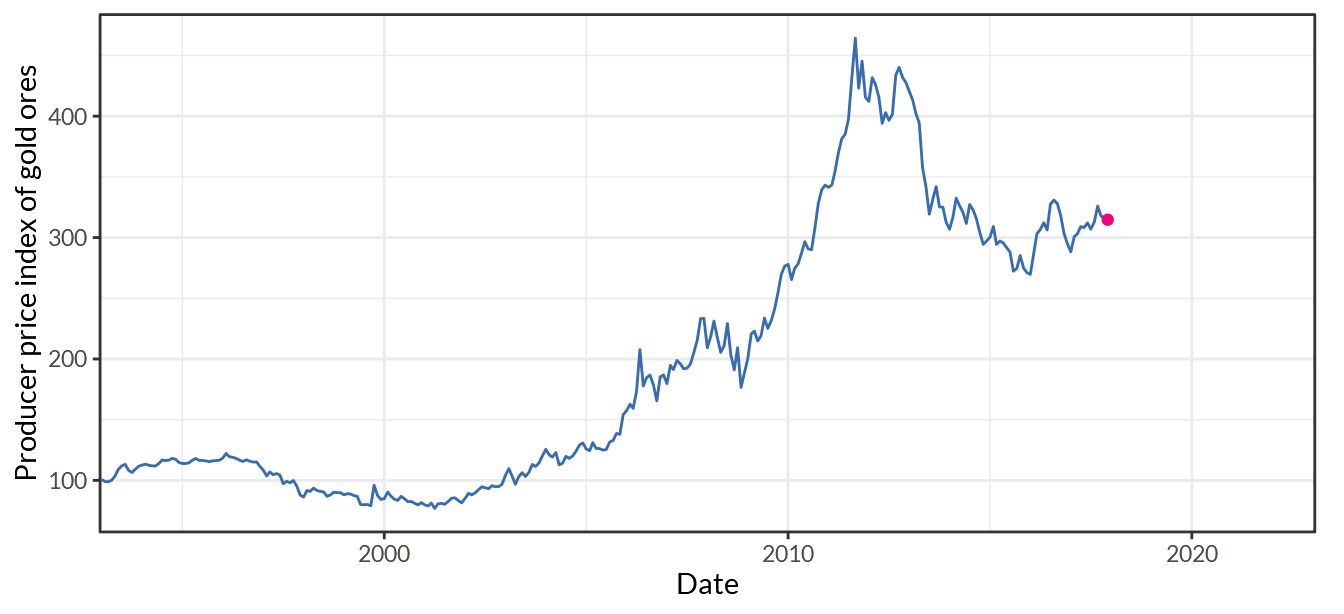
Figure 10.23: Gold Fixing Price 10:30 A.M. (London time) in London Bullion Market, based in U.S. Dollars
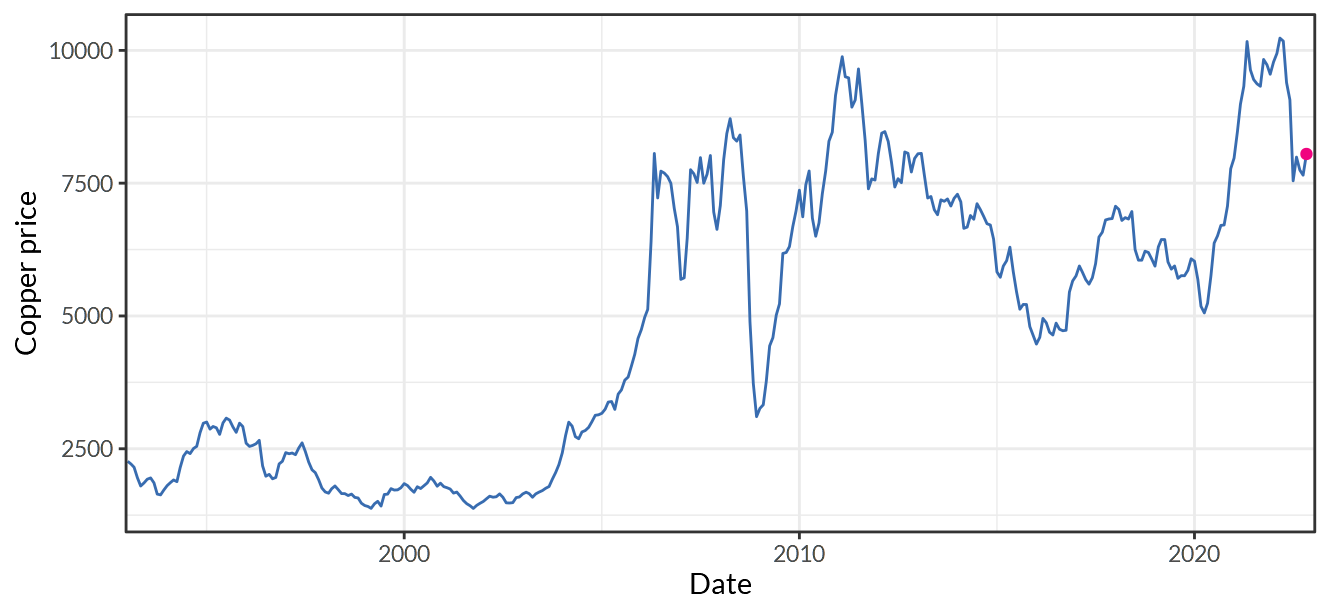
Figure 10.24: Global Price of Copper (U.S. Dollars per Metric Ton)
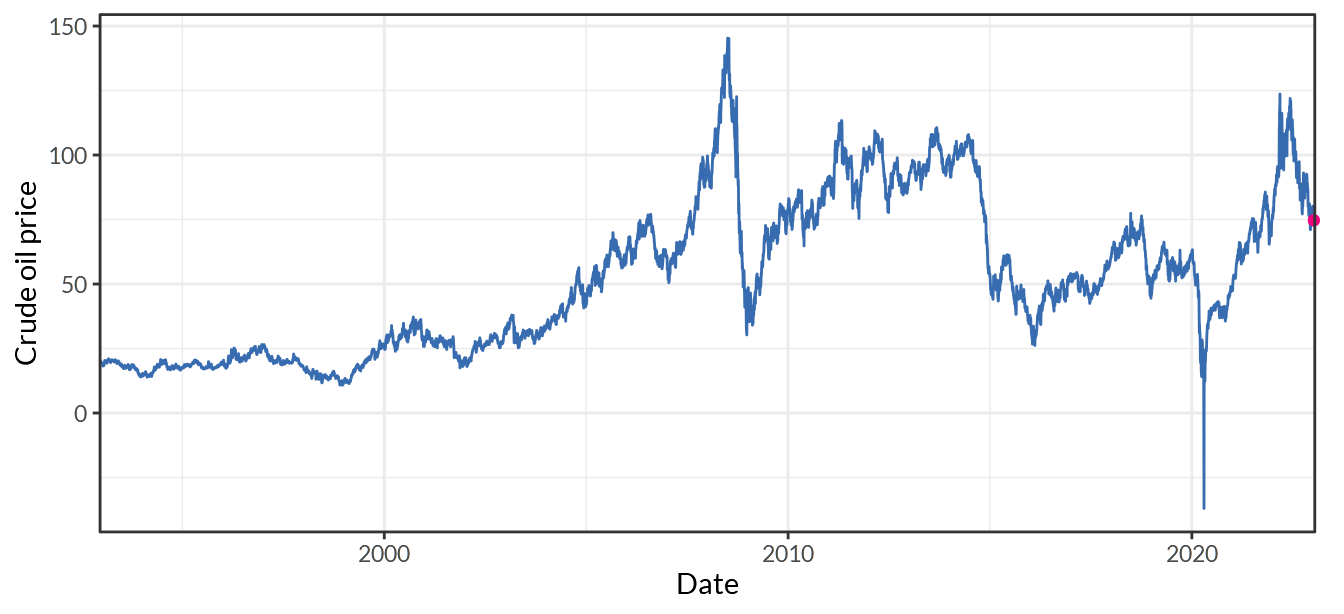
Figure 10.25: Crude Oil Prices: West Texas Intermediate (WTI) - Cushing, Oklahoma
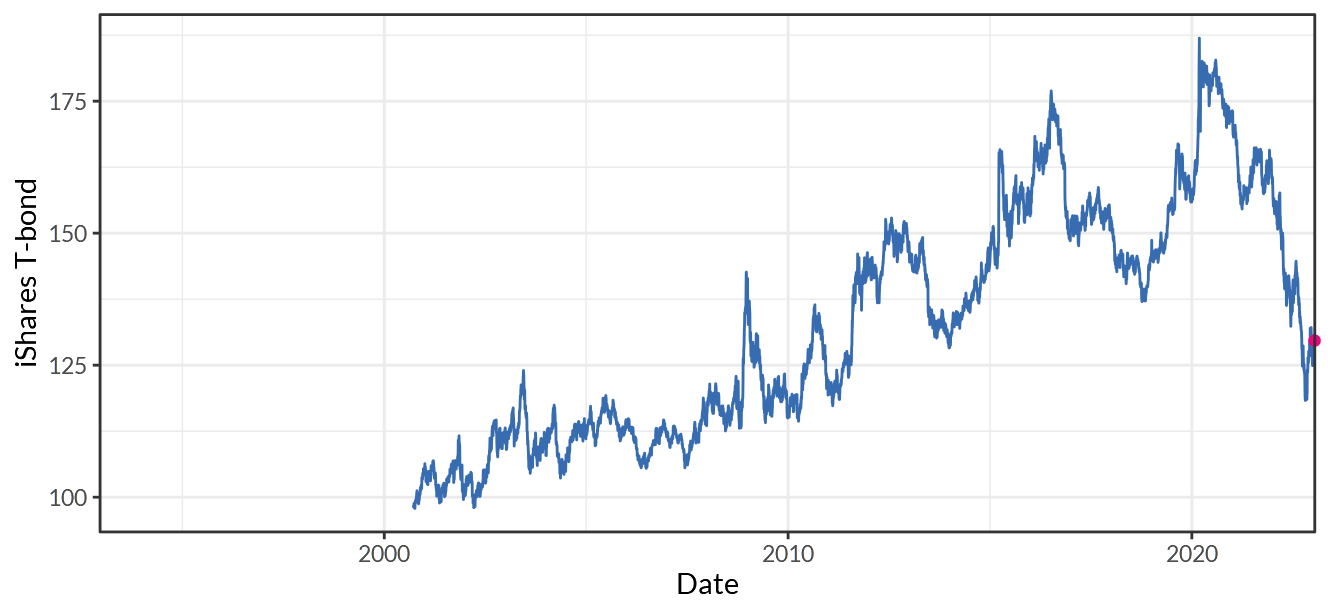
Figure 10.26: iShares U.S. Treasury Bond ETF
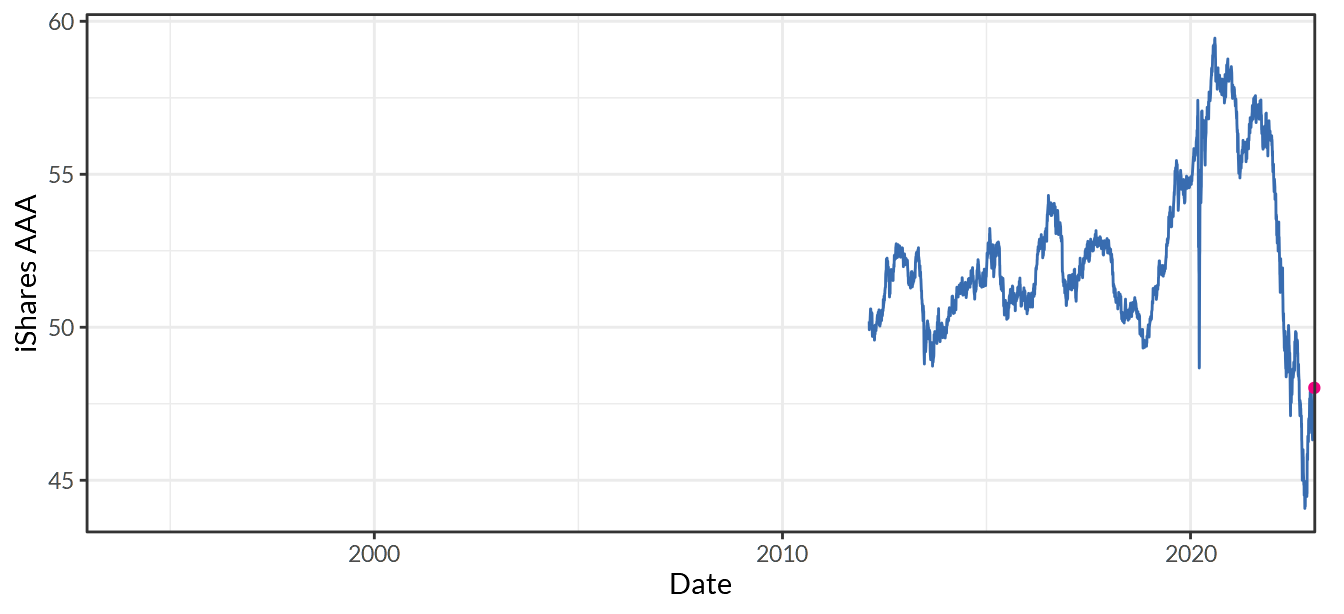
Figure 10.27: iShares Aaa - A Rated Corporate Bond ETF
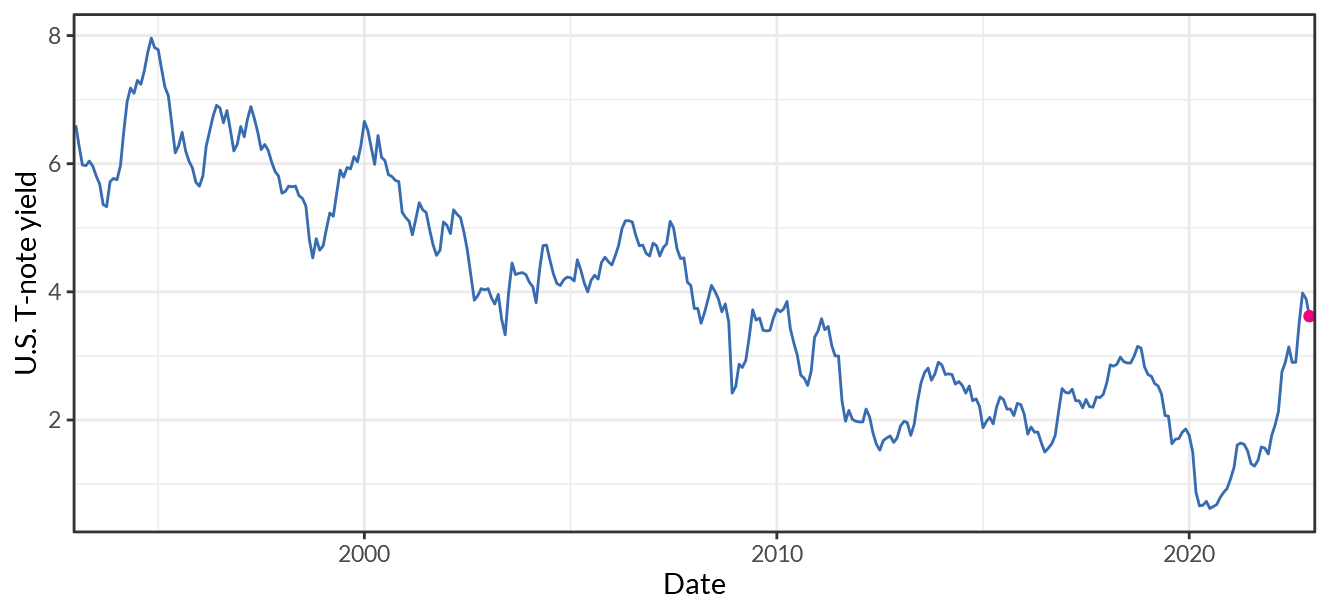
Figure 10.28: Long-Term Government Bond Yields: 10-year: Main (Including Benchmark) for the United States
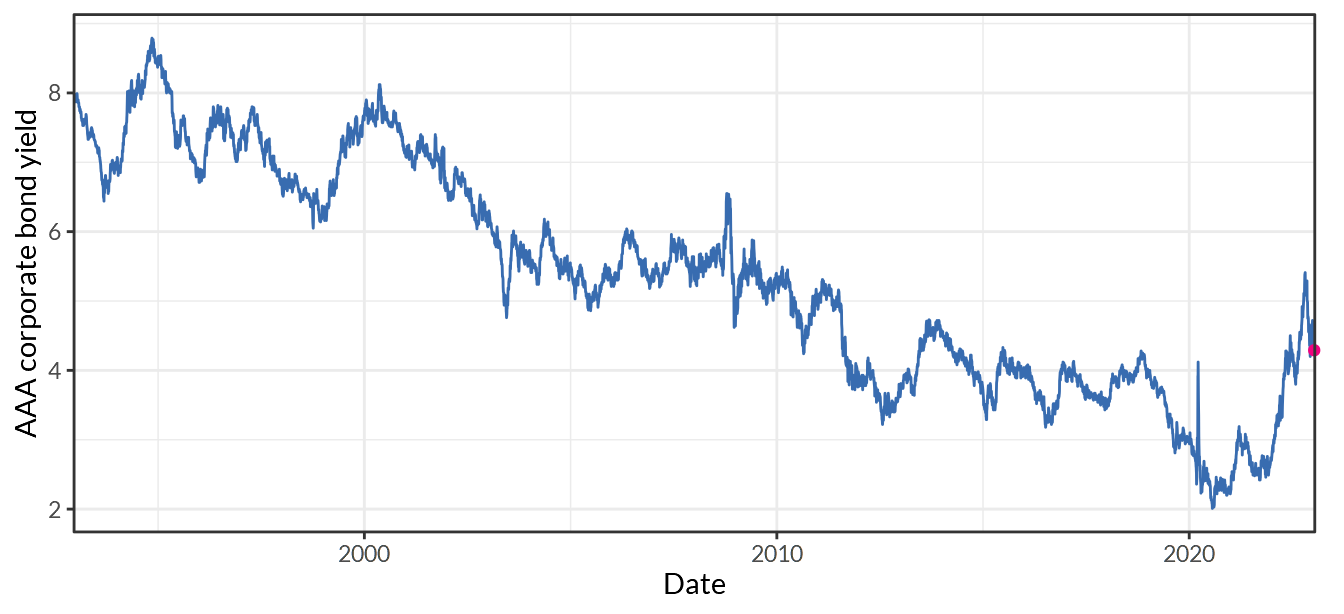
Figure 10.29: Moody’s Seasoned AAA Corporate Bond Yield
Data are from Yahoo Finance.↩︎
Data are from Federal Reserve Bank of St. Louis.↩︎