Chapter 12 Global economy17
12.4 OECD Composite Leading Indicators
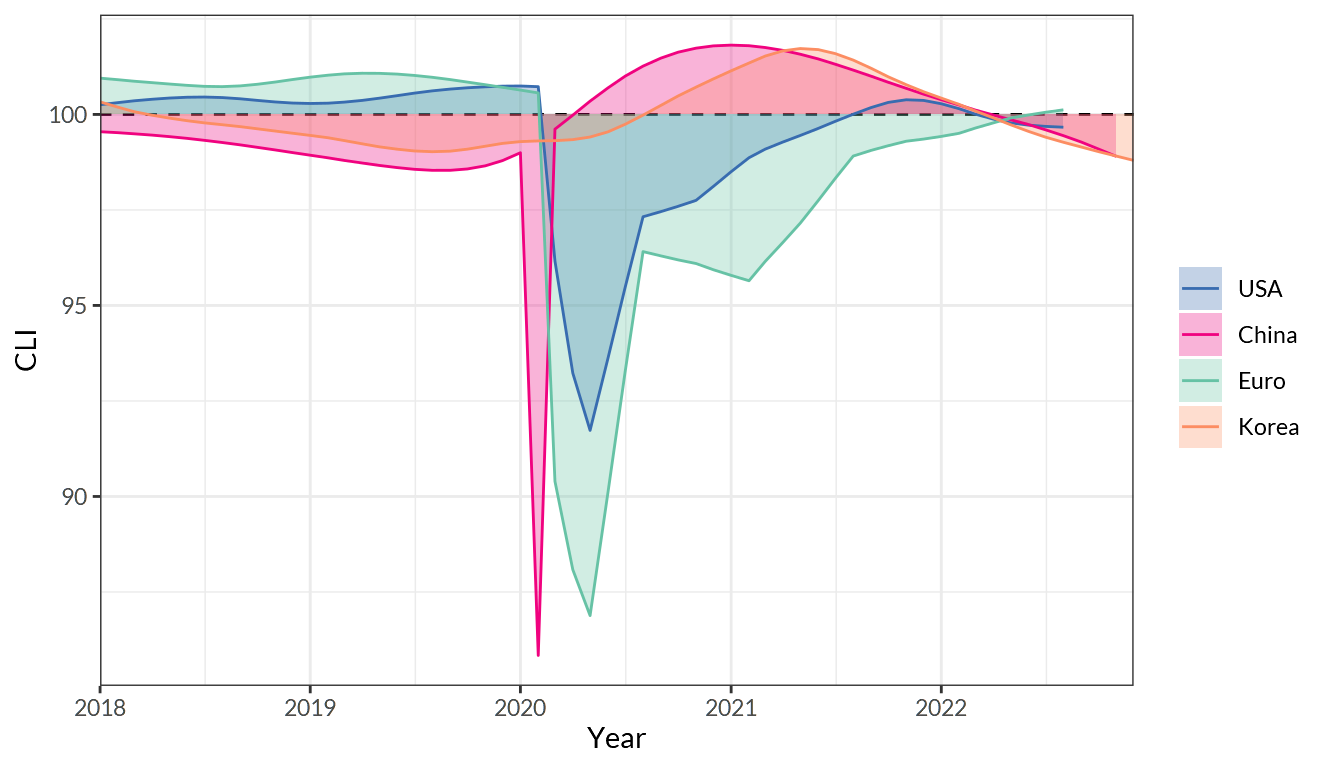
Figure 12.4: OECD Composite Leading Indicators (CLIs) normalized for USA, China, Euro, and South Korea over the last 5 years
The OECD system of Composite Leading Indicators (CLIs) is designed to provide early signals of turning points in business cycles - fluctuation in the output gap, i.e. fluctuation of the economic activity around its long term potential level. This approach, focusing on turning points (peaks and troughs), results in CLIs that provide qualitative rather than quantitative information on short-term economic movements.
The phases and patterns in CLIs are likely to be followed by the business cycle. The chart below presents the CLI and the estimated business cycle for the OECD area. The two series show strong co-movements, with the turning points of the CLI consistently preceding those of the business cycle; lead time varies, but 6 - 9 months is at what the OECD aims.
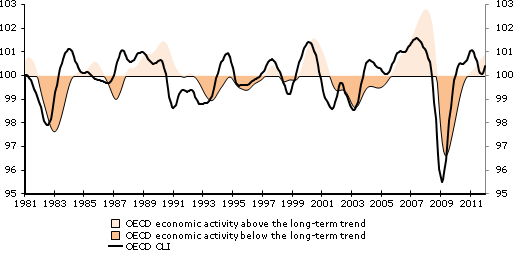
Figure 12.5: OECD area Composite Leading Indicator (CLI) and economic activity (long-term trend = 100)
- OECD
Do OECD CLIs predict the future movement of stock markets?
The stock market is what’s known as a leading economic indicator. A leading economic indicator is a measure of economic recovery that shows improvement before the actual economy does.
Stock prices are forward-looking in the sense that investors buy and sell stocks not based on what happened yesterday or what is happening today, but rather based on their expectations for the future. For example, a company may report impressive EPS and revenue numbers in a given quarter. But if they also cut revenue and EPS growth projections for the next several quarters at the same time, the stock will most certainly sell off.
An individual stock is priced in large part based on investors’ expectations of what is coming in the next several months and quarters. Collectively, the S&P 500 is priced in a similar fashion.
- Wayne Duggan @ Benzinga.com
Data are from World Bank and OECD.↩︎