8.4 Example: Image Analysis of Nulcei Using Hoechst33342
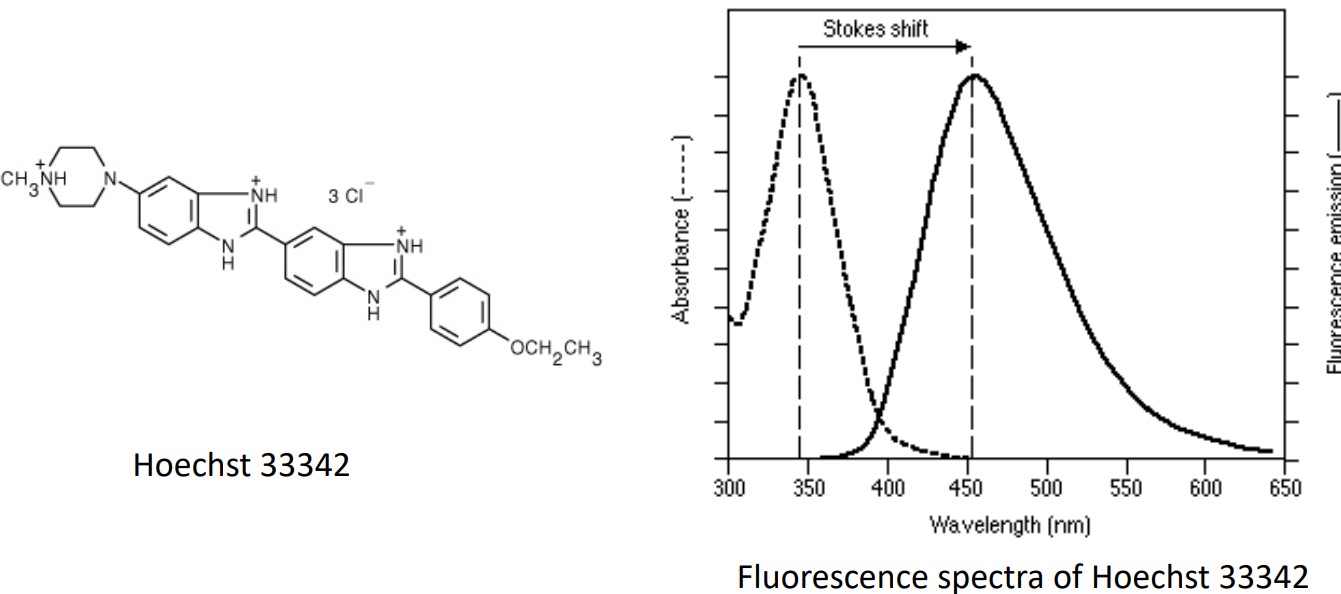
Figure 8.8: Stuctural Formual and Emission and Absorption Spectrum for Hoechst33342
The above graphic shows the structural formula and the emission and absorption spectrum for Hoechst33342.
8.4.1 Analyzing Nuclei
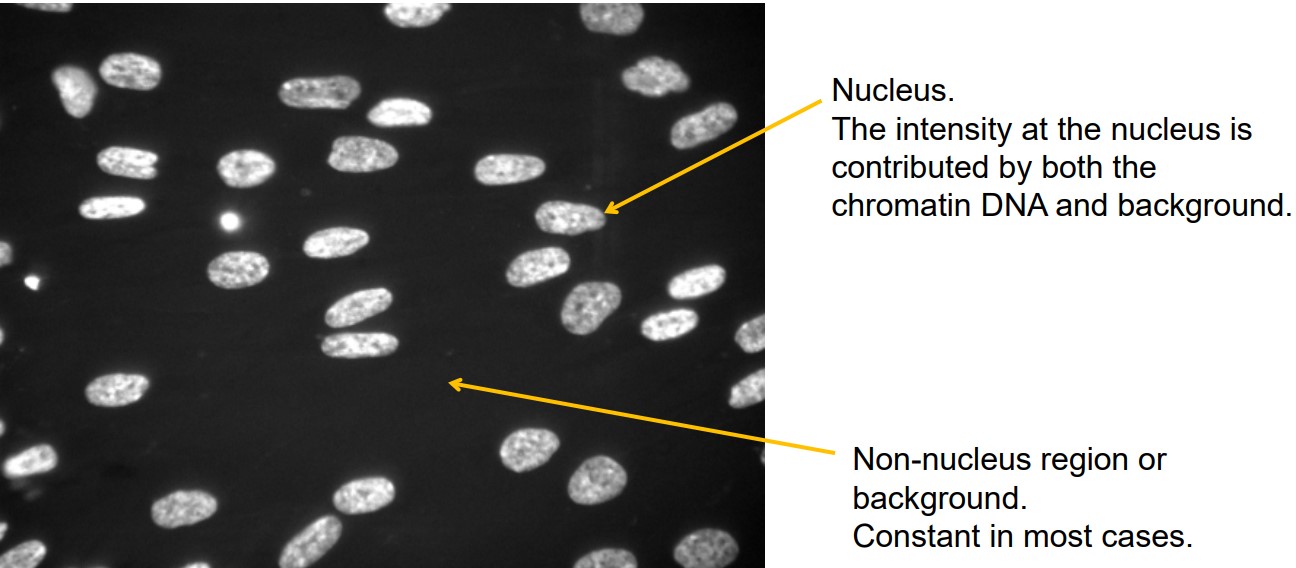
Figure 8.9: Nuclei of Cells in Medium Stained with Hoechst33342
The nuclei’s intensity is a result of the chromatin DNA’s and the background’s intensity.
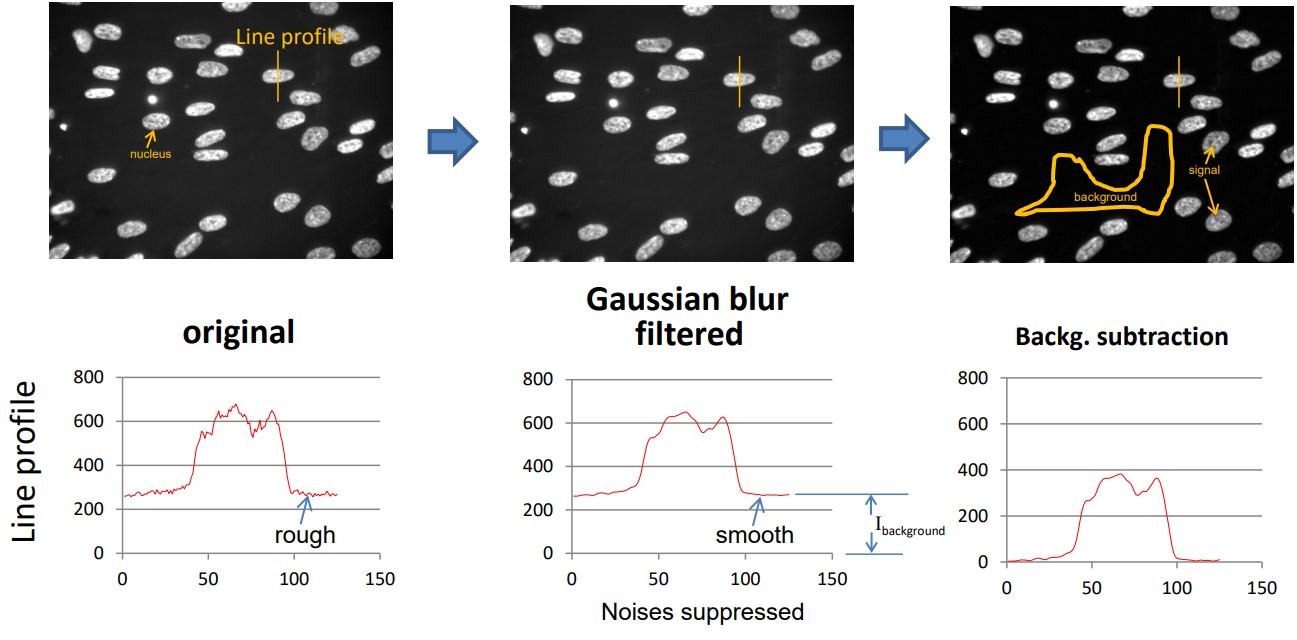
Figure 8.10: Blur Filtration
Note that Ibackground represents the mean background intensity. If the background is constant (i.e., which is the case), Ibackground could be subtracted from the filtered image.
8.4.2 Segmentation and Generating ROIs
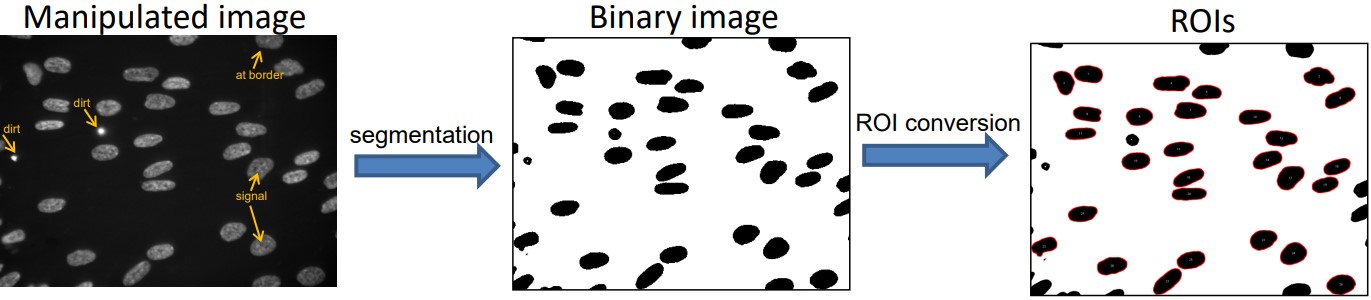
Figure 8.11: Segmentating and Generating ROIs for Hoechst33342-Stained Cells
Segmentation was done via trial and error.
While the ROIs could be determined automatically, they can be further visually inspected to remove bad ROIs - for instance, dirt particles or cells at the border of the image.
8.4.3 Analyzing Nuclei Number, Size, and DNA Content
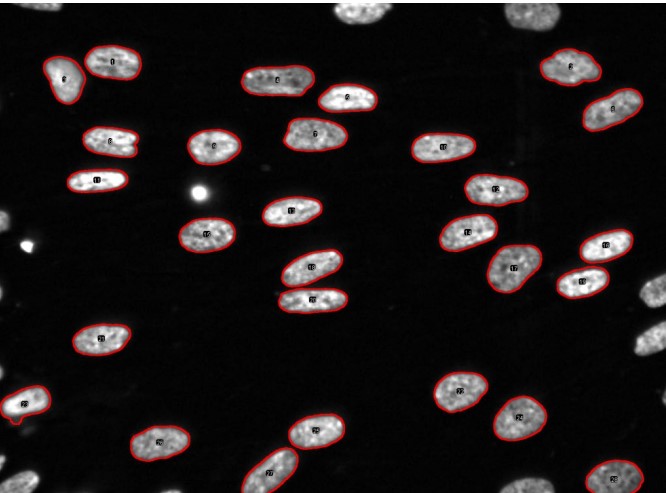
Figure 8.12: Image Overlaid with ROIs
The following could be quantified from the above image:
Number of Nuclei
This is the number of cells.
Area of Nuclei
This indicates the size of the nucleus. It is denoted as: \(\displaystyle \text{number of pixels} \times \text{area of pixel in $\mu$m$^2$}\).
Mean Intensity per Nucleus (i.e., Inucleus)
This indicates chromatin density.
Total Intensity of Each Nucleus
This is given by \(I_{nucleus} \times \text{number of pixels}\) and denotes the amount of chromatin.