12 Seminar Eleven

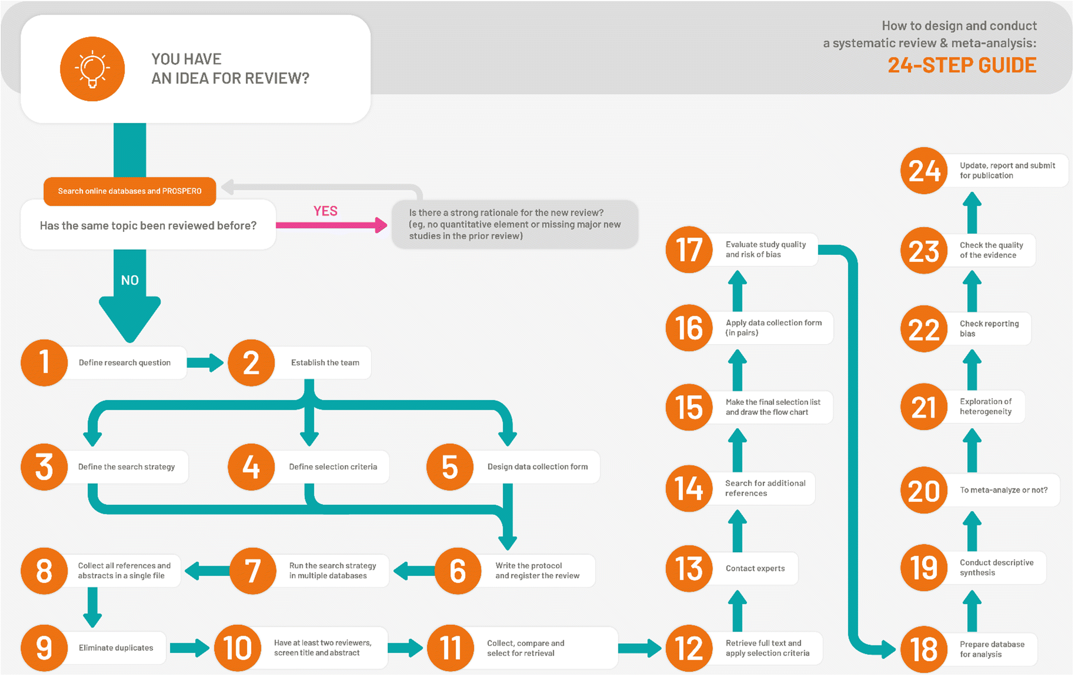
How to design and conduct a systematic review - 24 step process
In the lecture this week you will have learnt about the reporting guidelines of the results section of your manuscript (assessment). In today’s session you should continue to conduct your systematic review and should use these guidelines to write up your results section.
12.1 Task 1
Write up the results of your study selection:
Create a PRISMA flow diagram to visually represent the study selection process:
Example: https://estech.shinyapps.io/prisma_flowdiagram/
Example: ‘Search results are presented in Figure 1. Of the 1,535 records identified via database search, 1,352 titles and abstracts were screened, and 174 full texts were assessed for eligibility, with 60 full texts meeting all criteria for inclusion. Of these, there were 29 interventions in animals and 18 interventions conducted in humans.’
12.2 Task 2
Using your data extraction table create a Table 1. Characteristics of included studies table
12.3 Task 3
Write up your individual study results:
Example: ’Study characteristics of human studies are presented in Table 1.A total of 1,976 participants with a median (IQR) sample of 47 (27–135). There was a slightly higher proportion of male compared to female participants across studies (median % = 52% vs. 48%); two studies included only female participants (22,23). The median (IQR) average age was 53 (49–55) years and median (IQR) average BMI was 32 (30–33) kg/m2.
Human studies had one (N = 13), two (N = 4), or three (N = 1) intervention arms that were relevant to this review. The interventions included only moderate-intensity continuous training (N = 8), resistance training (N = 4), high-intensity interval training (N = 2), moderate-intensity continuous training combined with resistance training (N = 4), vigorous-intensity training (N = 1), or physical activity guidelines and counselling support (N = 1). The comparison conditions included a no intervention control (N = 7), standard care (N = 3), general diet and/or physical activity advice (N = 3), a wait-list control (N = 1), placebo supplement (N = 1), control diet (N = 1), or stretching (N = 1).
Only one study (human = 1) directly reported the number of NAFLD participants who experienced disease regression, reduction, or progression. In most studies, liver function and/or damage were used as surrogate markers for remission and progression.’
12.4 Task 4
Using the risk of bias results create a Figure X. Risk of bias summary:
Example: https://www.riskofbias.info/welcome/robvis-visualization-tool
Example: ‘Out of the thirteen studies examining grade 3-4 adverse events, twelve (92%) were determined to carry a very high risk of bias due to potential confounding factors (figure 1). Emori 2022 was the only study of grade 3-4 adverse events not judged to be of very high risk of bias, however, we identified some concerns due to missing data and the selection of reported outcomes. Regarding the eleven studies that provided data on treatment discontinuation, eight (73%) were identified as having a very high risk of bias due to potential confounding (figure 2). In the case of Tsukagoshi 2021, a high risk of bias was awarded due to missing data, whereas the risk of bias assessment of Palmela 2017 raised some concerns both in terms of confounding and the selection of reported outcomes.’
12.5 Task 5
Write up the results of your data synthesis:
Qualitative Example: ’Rapid Weight Loss: Three studies reported the magnitude of RWL (table 3). Matthews & Nicholas (2017) objectively quantified RWL in MMA. Whereas, Coswig et al. (2015) and Irfan (2015) relied on self-report RWL data from athletes. Both MMA samples showed similar relative (10% vs. 8%, mean difference 2% body mass) and absolute (7.4kg vs. 5.6kg, mean difference 1.8kg) RWL. However, RWL was lower in wrestlers (3.8 ± 1.9kg) with the shortest measurement period. Only one study quantified the subsequent RWG after the official weigh-in (Matthews & Nicholas, 2017). As such, it was not possible to examine the direct relationship between the magnitude of RWL and RWG.
Rapid Weight Gain: Fourteen studies recorded the magnitude of RWG (table 3). Thirteen objectively measured body mass, whereas Daniele et al. (2016) sourced historical records from IBF-sanctioned bouts to perform a retrospective analysis. Relative RWG across studies (figure 2) was largest in a single-event MMA competition (11.7 ± 4.7%) (Matthews & Nicholas, 2017). This was somewhat an outlier as the second-largest relative RWG was found in teenage female wrestlers (mean difference between studies 5.4%) (Viveiros et al., 2015). US-based samples in wrestling and MMA displayed homogenous RWG (mean difference 0.3kg) (Alderman et al., 2004; Jetton et al., 2013; Scott et al., 1994; Utter & Kang, 1998). However, US high-school wrestlers had markedly smaller RWG of 1.2 ± 1.1kg (Wroble & Moxley, 1998).’
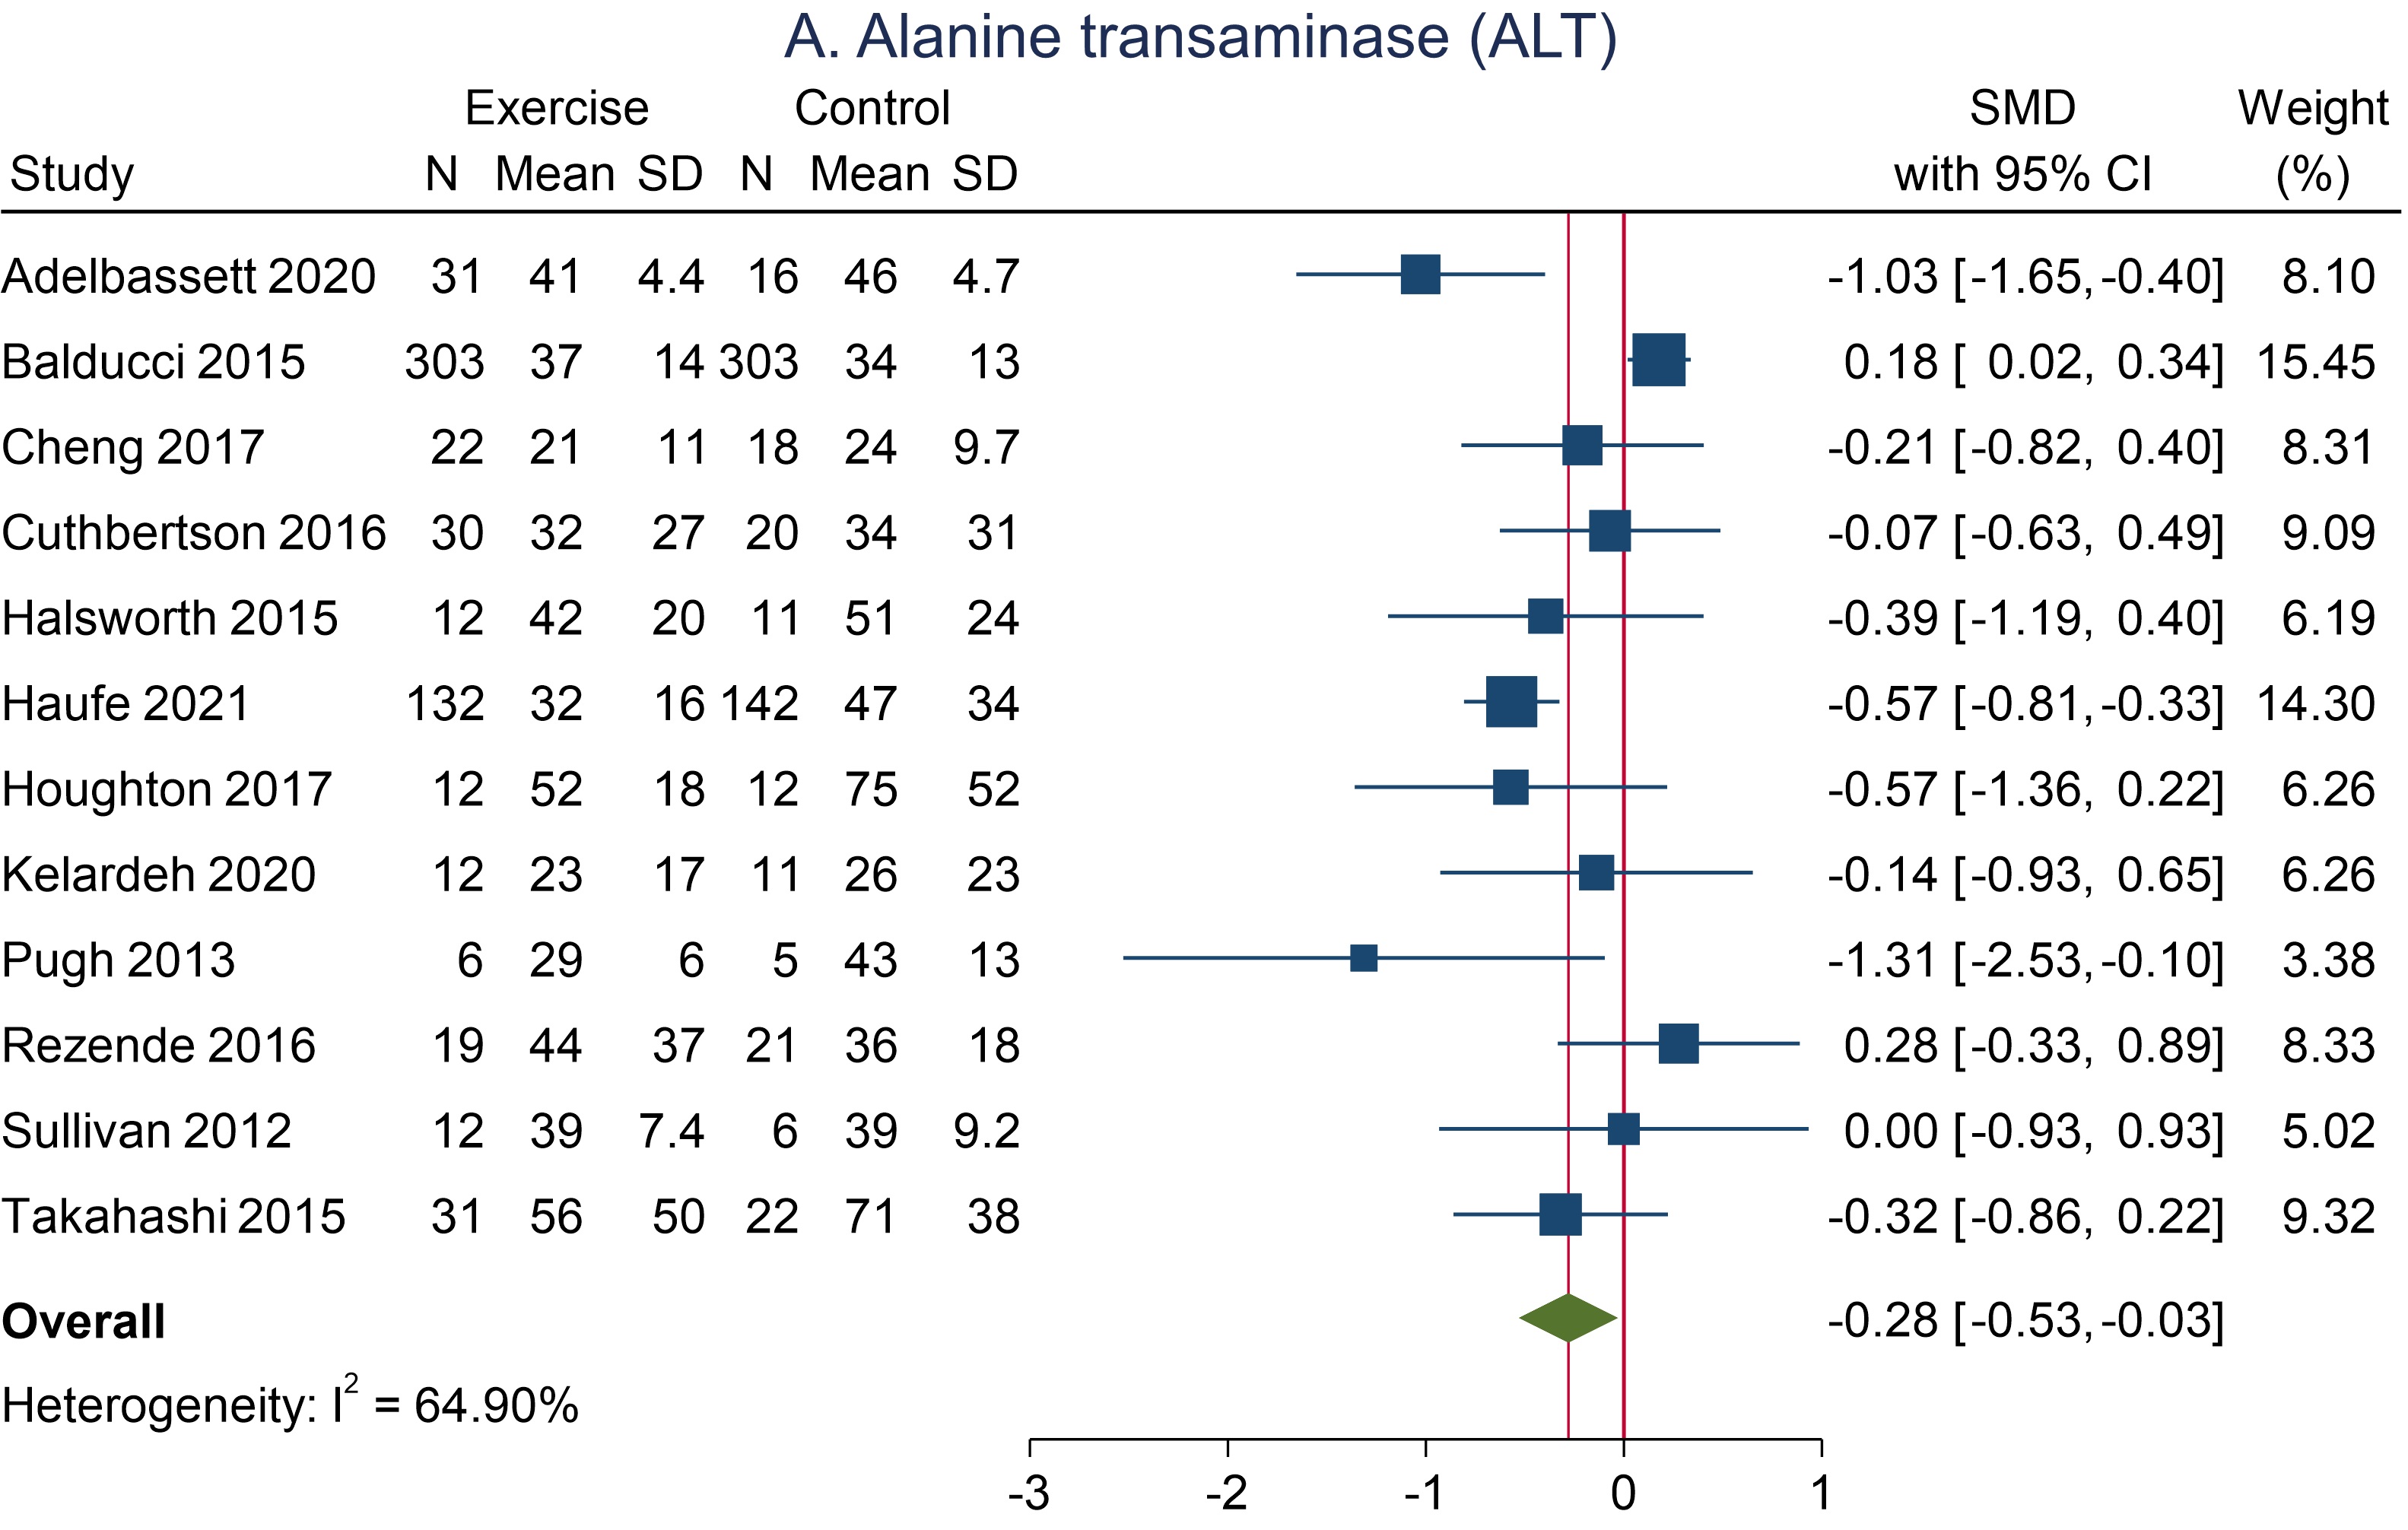
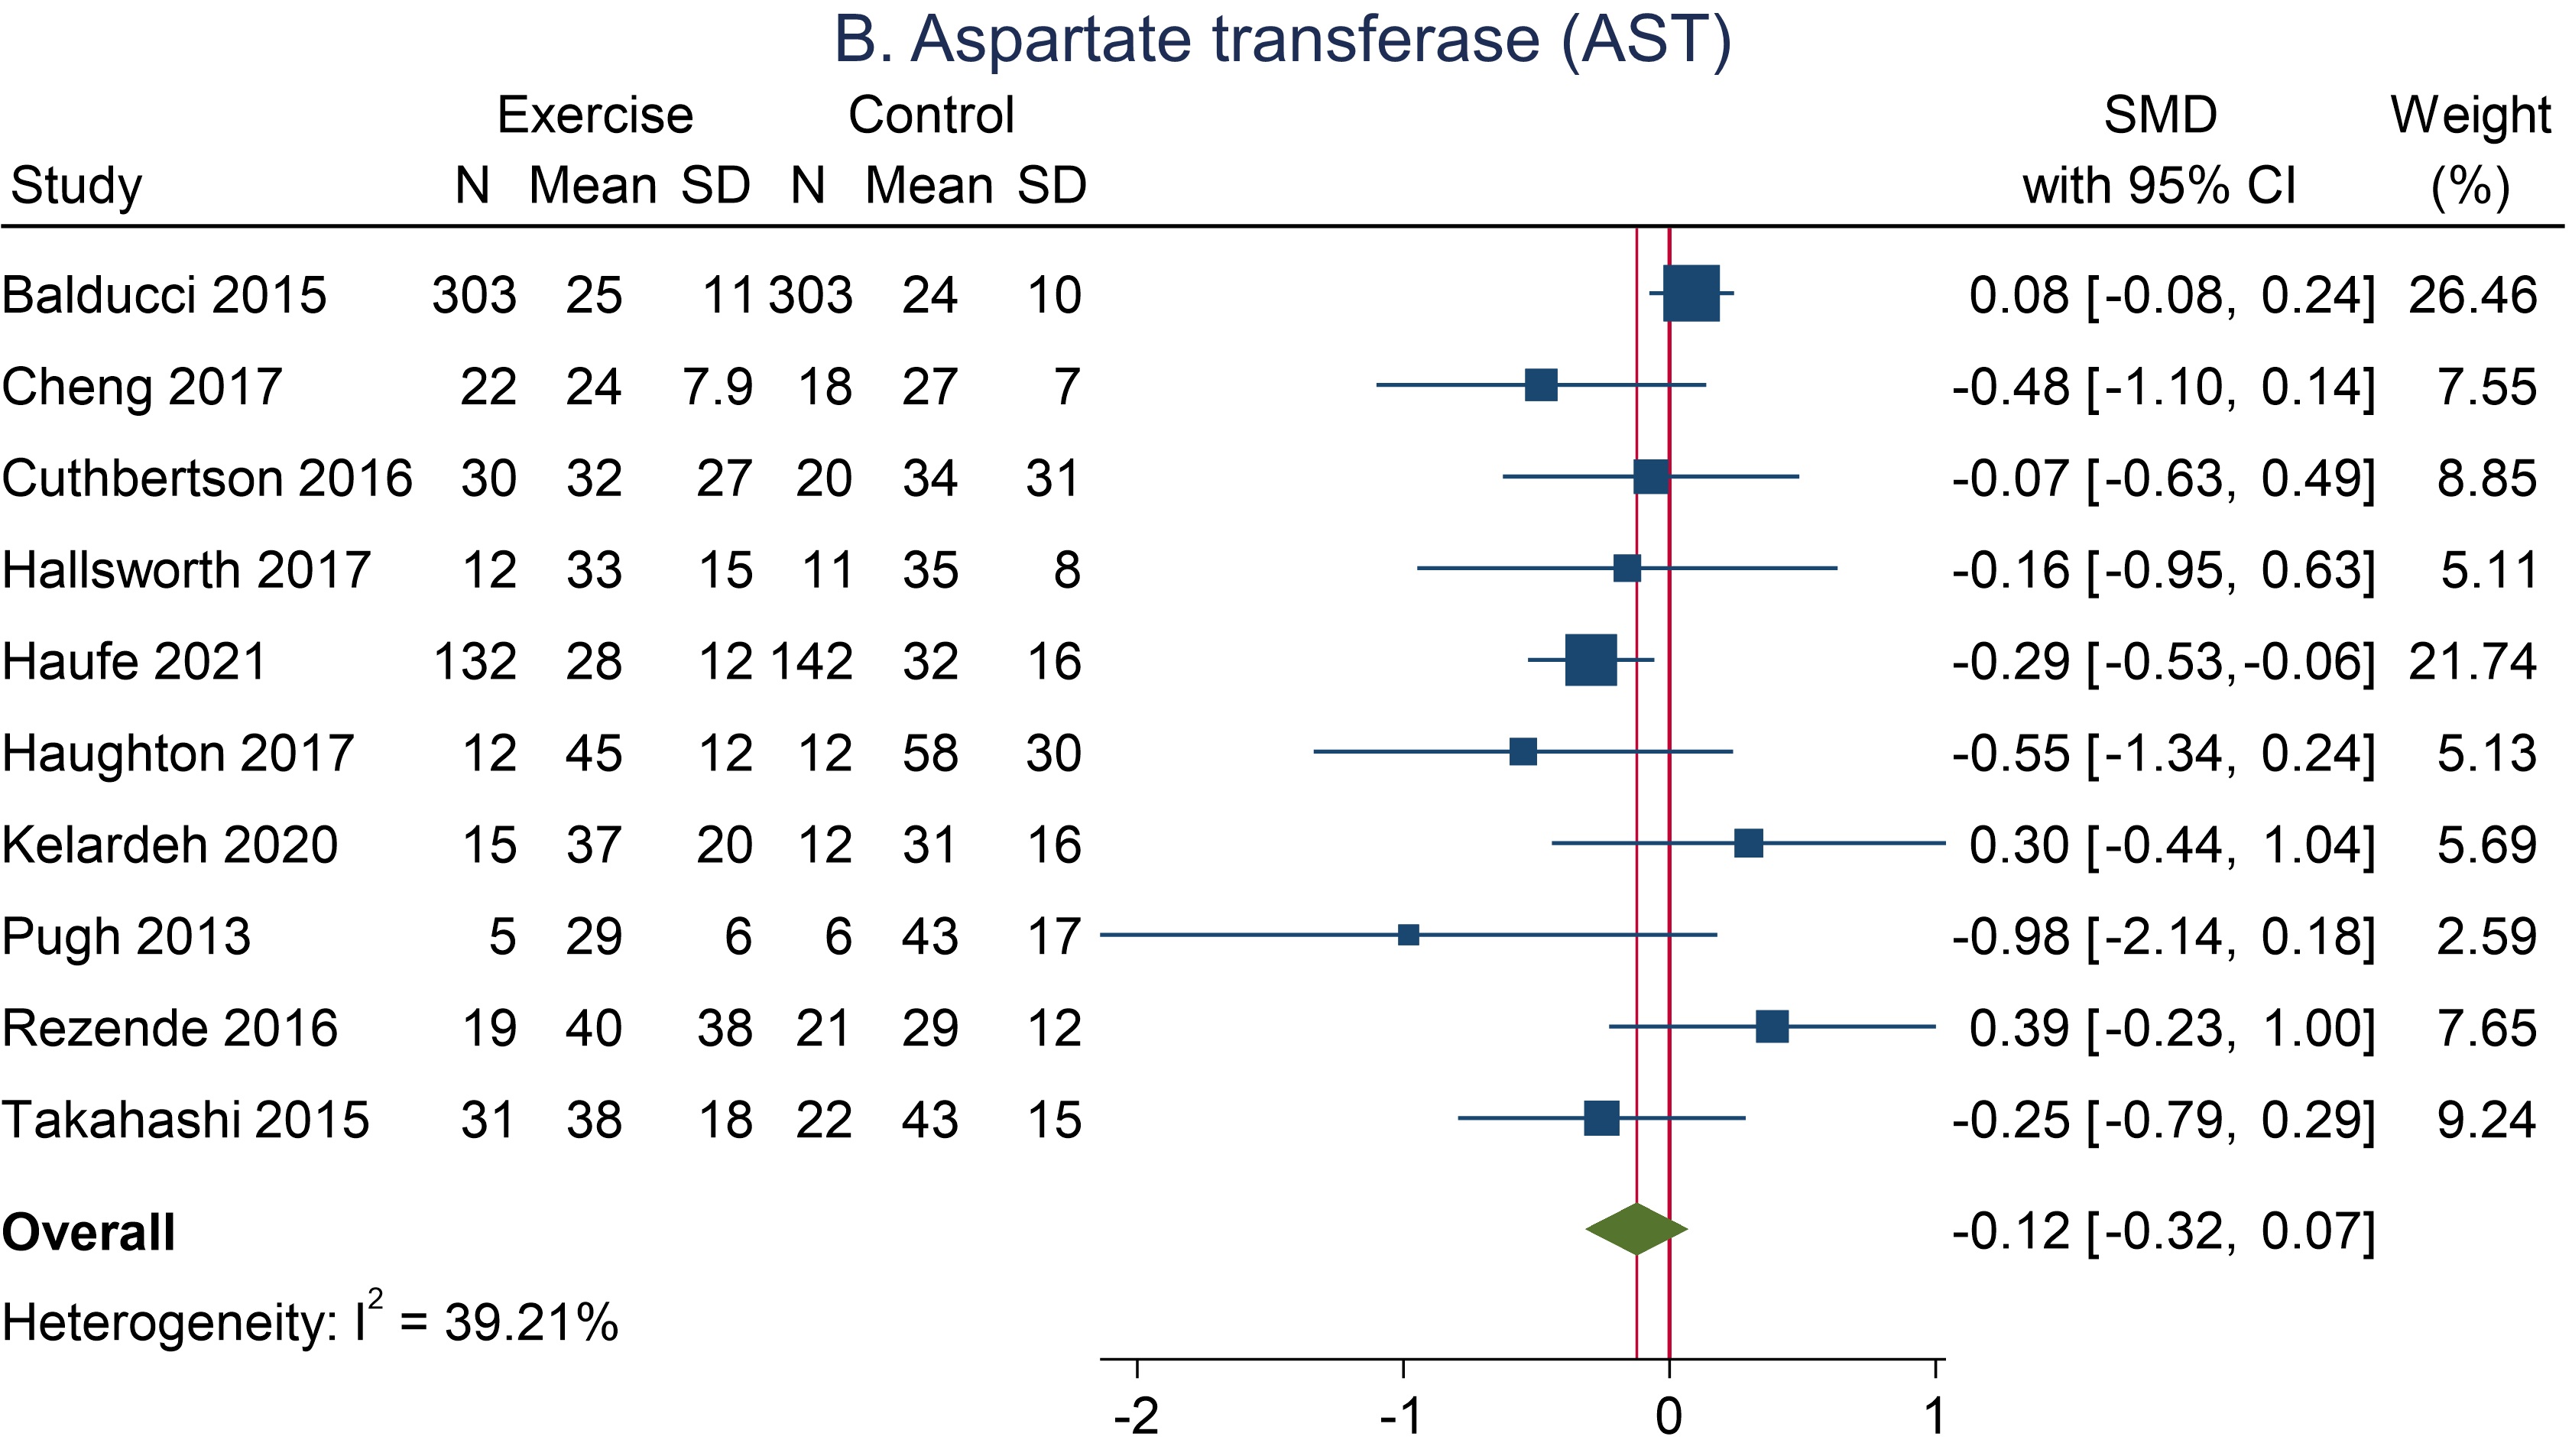
Quantitative Example: ‘Liver Enzymes: Meta-analysis of studies that assessed the effects of exercise on ALT are presented in Figure 2A (human studies). In the human studies, participants who were assigned to the exercise group exhibited a modest reduction in ALT levels compared to those in the control group (Studies = 12, N = 1,209, SMD = -0.28, 95%CI = -0.53, -0.03). Meta-analysis of studies that assessed the effects of exercise on AST are presented in Figure 2B (human studies). Participants assigned to the intervention showed a slight difference in AST compared to the control group, favouring the intervention (Studies = 10, N = 1,148, SMD = -0.12, 95%CI = -0.32 to 0.07).’

