Chapter 1 Introduction
![]()
1.1 Learning objectives
By the end of this chapter, you will be able to:
Understand and explain the importance of evaluating interventions
Recognise and distinguish between examples of random error and systematic bias
1.2 How can we know if we’ve made a difference?
Vignette 1A: Anthony was a 60-year-old builder who suffered a stroke that left him paralysed on his right side and globally aphasic, with difficulties producing and understanding language. He was discharged home after three weeks in hospital, by which time he recovered the ability to walk and talk, but still had severe word-finding problems. He received weekly sessions with a speech and language therapist for 6 weeks, after which his word-finding difficulties had reduced markedly. He is full of praise for the therapist and says she made a huge difference.
Vignette 1B: At two years of age, Tina’s speech was markedly delayed. She had an expressive vocabulary of just ten words (mummy, daddy, doggie, water, more, want, juice, milk, bread and bear), and her repertoire of speech sounds was limited, so what she said was often not intelligible to strangers. She was socially engaged and an assessment showed that she had age-appropriate understanding of what others said to her. The therapist worked with Tina’s mother to encourage her to talk about the toys Tina was playing with and to repeat and expand on her utterances. The mother said this transformed her interactions with her daughter. Six months later, Tina’s speech was much clearer and she was talking in 2-3 word utterances.
Vignette 1C: Martha is a teaching assistant based in a primary school in an area of high social deprivation. She has worked with the school’s speech and language therapist to develop a language intervention programme with a class of 5-year-olds that involves regular group sessions of story-book reading with an emphasis on developing the children’s vocabulary. A vocabulary test that was given at the start of the school term and again 3 months later shows that on average children know ten more of the vocabulary items after the intervention than they did at the outset. The class teacher was enthusiastic about the intervention and wants to roll it out to more classes.
These three vignettes illustrate the kinds of everyday problem confronting speech and language therapists going about their daily work: language problems are identified, interventions implemented, and, in many cases, improvements are observed. But the thoughtful therapist will have a niggling doubt: yes, in each case we see an improvement in language skills, but would this have occurred anyway? People with aphasia often recover over time, late-talkers turn out to be “late-bloomers” and children’s vocabulary grows as they get older.
Readers might wonder whether we should worry. Therapists often have to work in situations of uncertainty - the clients are there and can’t wait for the profession to do trials before we adopt an intervention. And in each of these cases, the speech and language therapist used their professional judgment to intervene and an improvement in language was seen. So does it matter whether that improvement would have occurred anyway?
In our view it matters enormously, for four reasons.
- First, we owe it to those who receive our interventions to apply due diligence to ensure that, as far as is possible, what we are doing is evidence-based and unlikely to do harm – which in the best case may involve wasting people’s time or money, and in the worst case could cause emotional damage. The purity of the motives of a practitioner is not sufficient to ensure this – they have to have the skills and willingness to consider the evidence dispassionately.
- For any caring profession to be taken seriously, they need to show that they evaluate the interventions they use: otherwise they may be seen as no better than purveyors of popular alternative health cures, such as aromatherapy or iridology.
- Third, someone – either the client or the taxpayer – is paying for the therapist’s time. If some interventions are ineffective, then the money could be better spent elsewhere.
- Fourth, if a profession relies purely on traditional practice to determine which interventions to use, then there is no pressure to develop new interventions that may be more effective.
Showing that an intervention works in an individual case is very hard – especially when dealing with a condition that fluctuates or is self-limiting. In later chapters we shall consider how we can make use of group studies to evaluate interventions, and how single case designs can sometimes give greater confidence that a real effect has been achieved. But first, it is important to recognize the range of factors that conspire to make it difficult to answer the question “Did I make a difference?” To do this, we need to understand about two factors that can mask or mimic real intervention effects: random error and systematic bias. Random error is used to describe influences that do not alter the average outcome, but which just make it liable to vary capriciously from one occasion to the next. Systematic bias refers to influences that lead outcomes to move in one direction, which may mimic an intervention effect.
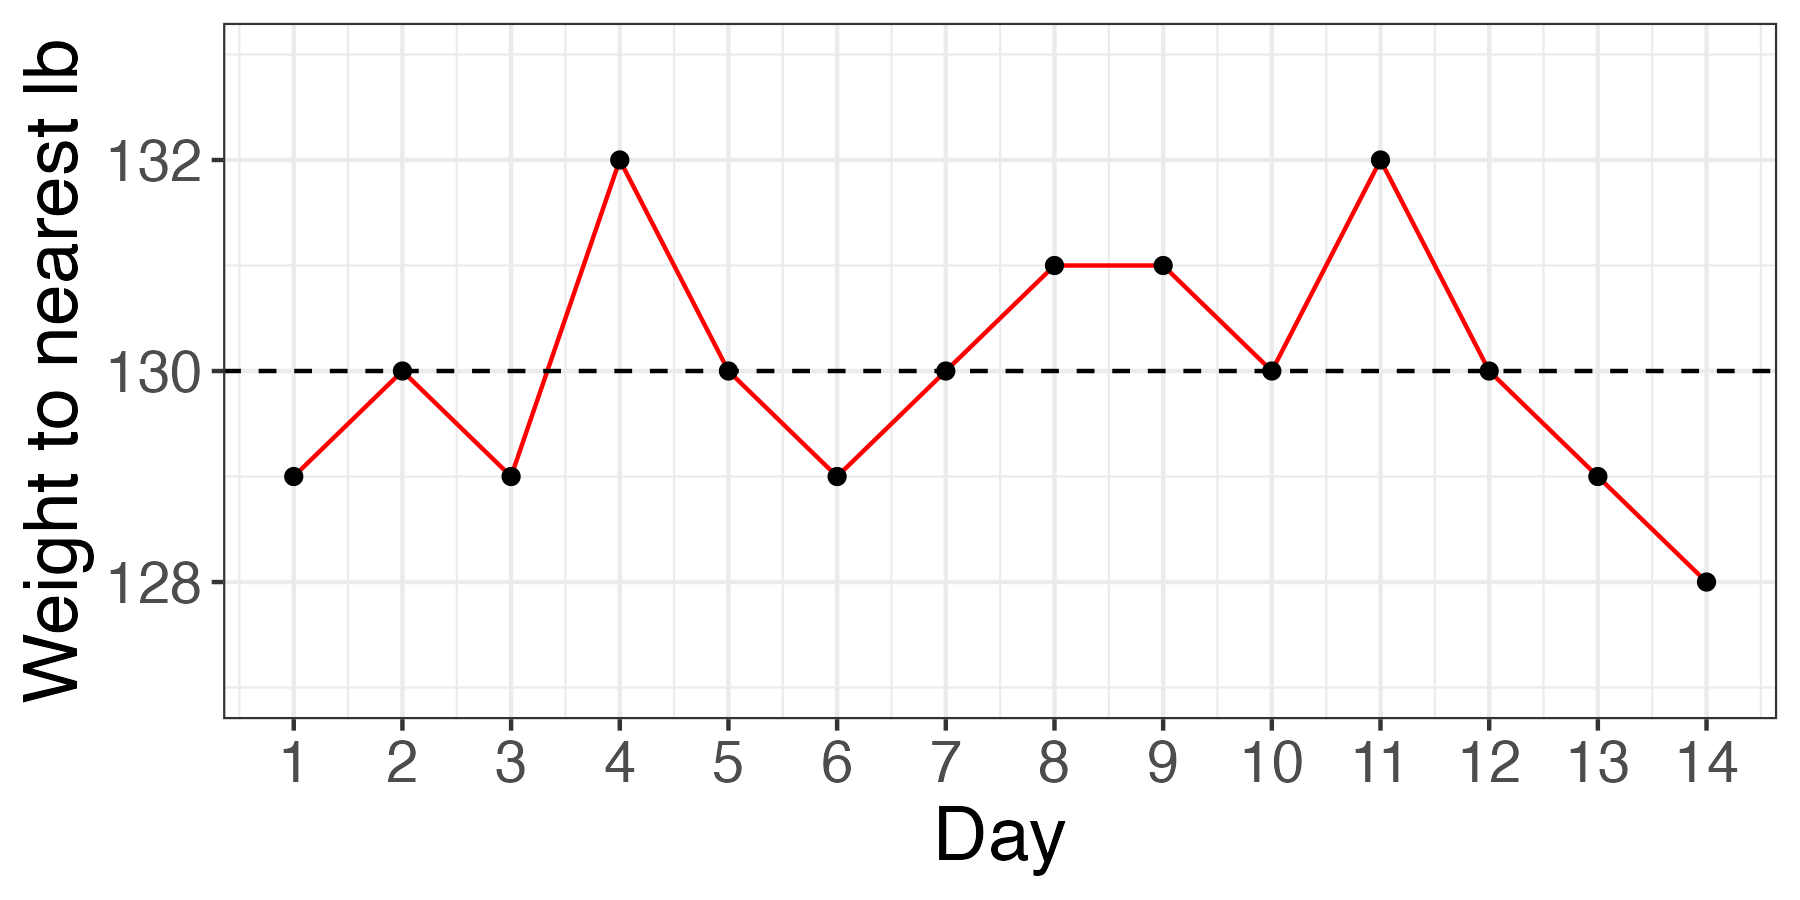
Figure 1.1: Random fluctuations in Bridget Jones’ weight, measured to the nearest pound
1.3 The randomness of everything
Anyone who has tried to diet will be aware of how weight can fluctuate: a fact used to comic effect in the novel Bridget Jones’s diary (Fielding, 1996), where the protagonist’s mood soared and plummeted depending on whether she was a pound heavier or lighter than the previous day. Some of the factors affecting what the scales say may be systematic and depend on calories ingested and worked off, but some will be fairly random: how you stand on the scales, whether you had a cup of tea prior to weighing, and whether the floor is level may affect the reading. And a different set of scales might give a different result. Figure 1.1 shows a notional weight chart for Bridget, who is obsessively measuring herself daily on a set of scales that weighs to the nearest pound. This plot was generated by simulating numbers with random variation, to reflect the day to day fluctuations that characterize such measurements. This is variously referred to as noise or random error in the intervention literature. Bridget may be euphoric by Day 14, as she sees a decline in her weight, but this trend is meaningless, and entirely down to the play of chance.
In effect, when we assess an intervention we aim to sift out any systematic effect of treatment from the background noise. This will be much harder if we have a measure that hops around a lot from one measurement occasion to the next regardless of our intervention – a “noisy” measure. So when we evaluate an intervention, we need to identify measures that are well-suited to assess the outcome, i.e., within minimal unwanted variation. We will discuss this further in Chapter 3.
More on random error
Note that for the purposes of an intervention study, we treat as “noise” or “random error” anything that creates variability in our measurements that is not part of the treatment effect. Strictly speaking, we can distinguish “measurement error”, which relates to noise in the measurement system we are using (e.g. the scales) and other sources of noise, such as genuine fluctuations in weight from day to day that do not trend up or down over time. If Bridget hopped off and on the scales repeatedly in a 5 minute interval, there would be some fluctuations in her weight due to the scales (measurement error), especially if very precise measurement was used. But we could be confident her weight had not genuinely altered within that time period. Such variation is likely to be smaller than the variation observed day by day, which includes genuine variation around Bridget’s average weight, reflecting physiological factors and gut contents. It is usually hard to isolate the causes of noisy measures: for our purposes, when we refer to noisy measures, the focus is just on how much a score varies in a random way - i.e. not consistently up or down.
One consequence of noisy measures is that they can show big changes from one occasion to another which, in individuals, might give a misleading impression of genuine treatment effects.
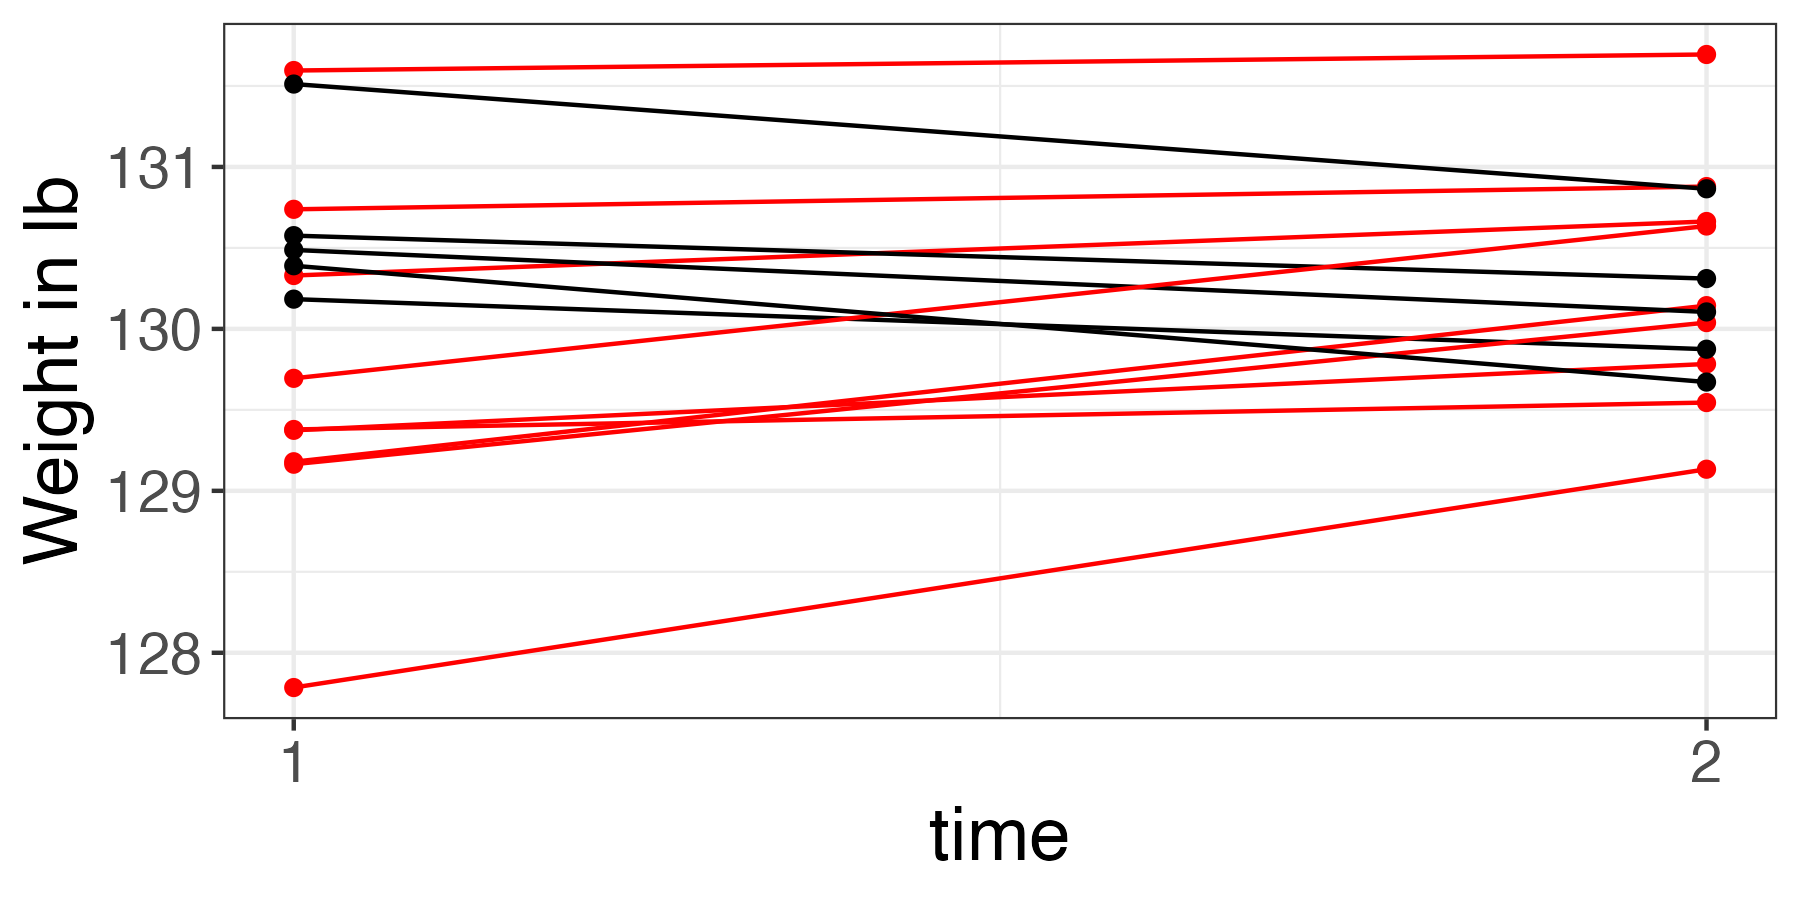
Figure 1.2: Baseline and outcome measures for an ineffective diet
Figure 1.2 shows data from 14 people given a dietary intervention which does not have any beneficial effect. The data were simulated using a random number generator that just allocated each person a starting weight at random (time 1), and then created an outcome weight by adding a random number to half the starting weight (time 2). In the plot, time 1 is the ‘baseline’ measure, prior to the diet starting, and time 2 is the ‘outcome’ measure, after a period of dieting. We might be tempted to conclude that there is a subset of people who respond to the treatment – those shown in black in the figure. And indeed, those who have lost weight may be inclined to tell their friends about the marvelously effective diet, whereas those who did not remain silent. If we were to just ignore the remainder of the group, we could give a quite false impression of effectiveness of intervention. Unfortunately, this sometimes happens, when people fail to recognize that some gains in a measure could just be due to chance, and conclude instead that there is a subset of “responders” and another subset of “nonresponders” - sometimes called “treatment resisters”. In fact, there will always be some variation in outcomes, and not all change is meaningful. It is possible to design a study to avoid making this basic error, but you need to be aware of it to defend against it.
1.4 Systematic bias
An even greater danger for the unwary researcher is a failure to take into account systematic bias. Systematic bias can take many forms, but of particular concern is the case where there are changes that would occur regardless of any intervention. The three examples that we gave at the outset are all cases where spontaneous change is likely even without intervention: with many kinds of brain injury, including stroke, there is very rapid recovery immediately after the injury – thought to be related to basic physiological changes such as reduction of swelling – followed by a longer period, that can persist for months or years, during which recovery continues, albeit at a slower pace. The amount and duration of such recovery can vary markedly depending on factors such as the age of the person and the nature, location and extent of the injury.
The second example, of Tina, illustrates another case – late talkers – where substantial spontaneous improvement can occur. Despite a growing number of prospective studies of late talkers, we are still rather bad at predicting which children will be “late bloomers”, who turn out fine without any special help, and which children will go on to have more persistent, long-term problems.
Finally, in the third example, we would expect children to gain new vocabulary as they get older: the difficulty is knowing just how much change it is reasonable to expect over a 3-month period as a consequence of growing older.
In all three cases, therefore, we are not only trying to detect a signal from among noise – i.e. an effect of intervention using measures that inevitably contain random error: we also want to know whether any signal we see is due to the intervention that was provided, or whether it is just part of natural change. We need to control for any form of systematic bias that could lead baseline and outcome scores to differ, regardless of the intervention. In subsequent chapters we will describe methods that have been developed that provide a rational approach to addressing this question.
It isn’t always as difficult as in our three examples. Some conditions are more stable and pose less of an interpretive problem as natural recovery is unlikely. But, in our experience, research on intervention often fails to take into account systematic bias resulting from spontaneous improvement, and so we will be focusing mostly on that. And methods that are designed to deal with this kind of systematic bias can also be applied to more stable situations.
1.5 Check your understanding
In the following examples, is there random error, systematic bias, or both? (For comments on these exercises see Chapter 25).
- We are measuring people’s weight, but the scales are incorrectly calibrated, so the true measurement is always underestimated (systematic | random)
- To get an index of social responsiveness, children’s interactions with others are measured in the classroom. The researcher makes one observation per child, with different children assessed at different times of day during different activities (systematic | random)
- In an online experiment where we measure children’s keypress responses on a comprehension test, the internet connection is poor and so drops out intermittently (systematic | random)
- In an intervention study with aphasic individuals, prior to treatment, vocabulary is measured on a naming test by a therapist in the clinic, and at follow-up it is measured at home by a carer who gives clues to the correct answer. (systematic | random)