Chapter 2 R
9월 3일 목요일, 202AIE17 송채은
2.1 Do It(1-1)
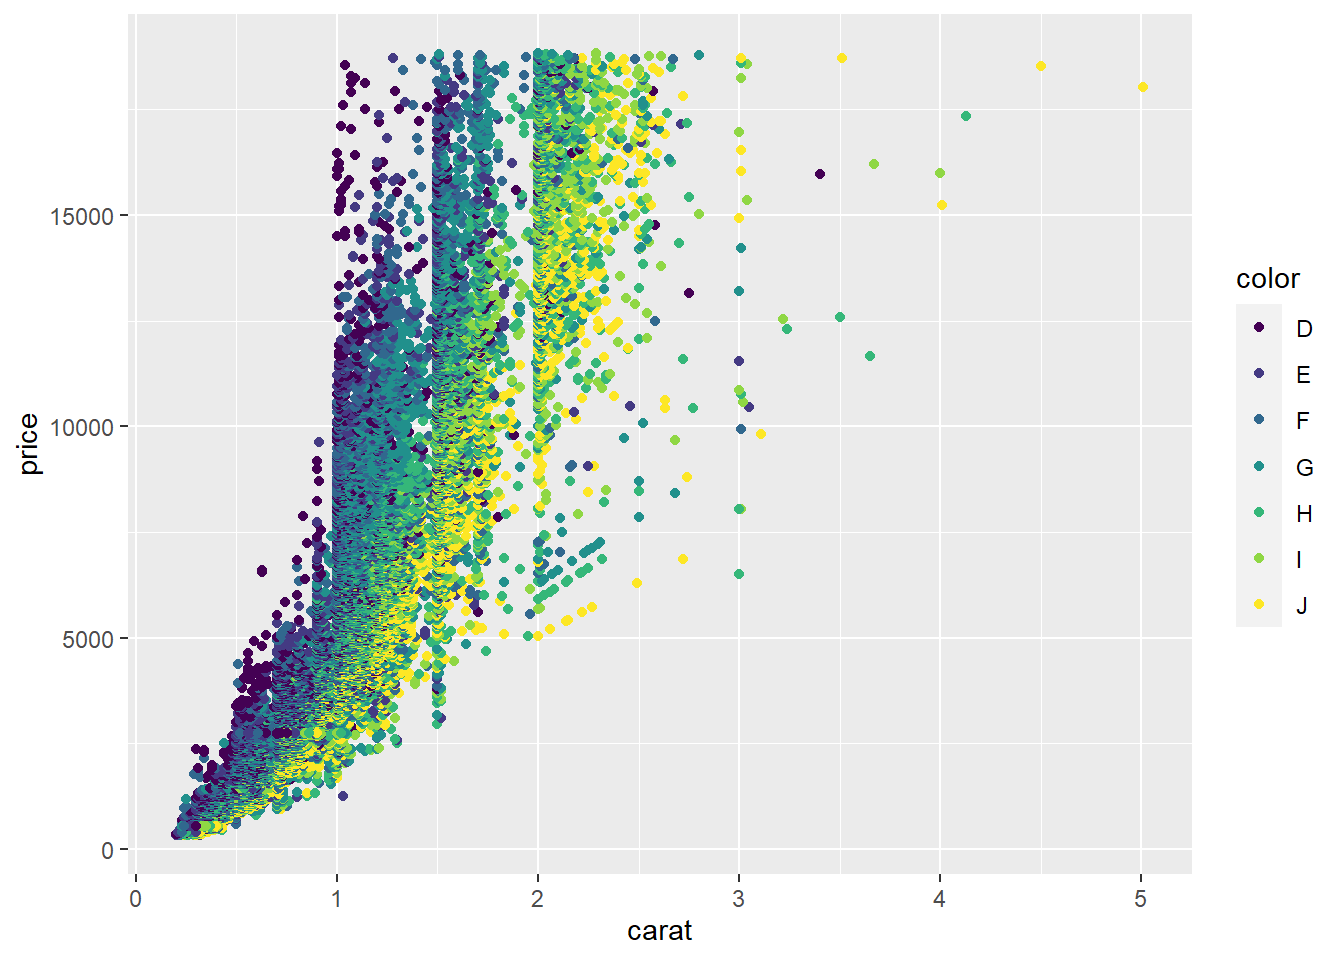
diamonds is a datasets from the ‘ggplot2’
2.2 Do It(1-2)
##                      mpg cyl  disp  hp drat    wt  qsec vs am gear carb
## Mazda RX4           21.0   6 160.0 110 3.90 2.620 16.46  0  1    4    4
## Mazda RX4 Wag       21.0   6 160.0 110 3.90 2.875 17.02  0  1    4    4
## Datsun 710          22.8   4 108.0  93 3.85 2.320 18.61  1  1    4    1
## Hornet 4 Drive      21.4   6 258.0 110 3.08 3.215 19.44  1  0    3    1
## Hornet Sportabout   18.7   8 360.0 175 3.15 3.440 17.02  0  0    3    2
## Valiant             18.1   6 225.0 105 2.76 3.460 20.22  1  0    3    1
## Duster 360          14.3   8 360.0 245 3.21 3.570 15.84  0  0    3    4
## Merc 240D           24.4   4 146.7  62 3.69 3.190 20.00  1  0    4    2
## Merc 230            22.8   4 140.8  95 3.92 3.150 22.90  1  0    4    2
## Merc 280            19.2   6 167.6 123 3.92 3.440 18.30  1  0    4    4
## Merc 280C           17.8   6 167.6 123 3.92 3.440 18.90  1  0    4    4
## Merc 450SE          16.4   8 275.8 180 3.07 4.070 17.40  0  0    3    3
## Merc 450SL          17.3   8 275.8 180 3.07 3.730 17.60  0  0    3    3
## Merc 450SLC         15.2   8 275.8 180 3.07 3.780 18.00  0  0    3    3
## Cadillac Fleetwood  10.4   8 472.0 205 2.93 5.250 17.98  0  0    3    4
## Lincoln Continental 10.4   8 460.0 215 3.00 5.424 17.82  0  0    3    4
## Chrysler Imperial   14.7   8 440.0 230 3.23 5.345 17.42  0  0    3    4
## Fiat 128            32.4   4  78.7  66 4.08 2.200 19.47  1  1    4    1
## Honda Civic         30.4   4  75.7  52 4.93 1.615 18.52  1  1    4    2
## Toyota Corolla      33.9   4  71.1  65 4.22 1.835 19.90  1  1    4    1
## Toyota Corona       21.5   4 120.1  97 3.70 2.465 20.01  1  0    3    1
## Dodge Challenger    15.5   8 318.0 150 2.76 3.520 16.87  0  0    3    2
## AMC Javelin         15.2   8 304.0 150 3.15 3.435 17.30  0  0    3    2
## Camaro Z28          13.3   8 350.0 245 3.73 3.840 15.41  0  0    3    4
## Pontiac Firebird    19.2   8 400.0 175 3.08 3.845 17.05  0  0    3    2
## Fiat X1-9           27.3   4  79.0  66 4.08 1.935 18.90  1  1    4    1
## Porsche 914-2       26.0   4 120.3  91 4.43 2.140 16.70  0  1    5    2
## Lotus Europa        30.4   4  95.1 113 3.77 1.513 16.90  1  1    5    2
## Ford Pantera L      15.8   8 351.0 264 4.22 3.170 14.50  0  1    5    4
## Ferrari Dino        19.7   6 145.0 175 3.62 2.770 15.50  0  1    5    6
## Maserati Bora       15.0   8 301.0 335 3.54 3.570 14.60  0  1    5    8
## Volvo 142E 21.4 4 121.0 109 4.11 2.780 18.60 1 1 4 22.3 Do It(1-3)
count() is a function in ‘dplyr’ package
##   cyl  n
## 1   4 11
## 2   6  7
## 3   8 14
2.4 Do It(1-4)
filter() is also a function in ‘dplyr’ package %>% is called a ‘pipe’ function A %>% function B = %>% delivers the outcome of a function A as an input of function B %in% c=combine ex) c(4,6)= 4 and 6
##   cyl  n
## 1   4 11
## 2   6  7
disp = engine size mpg = miles per gallon
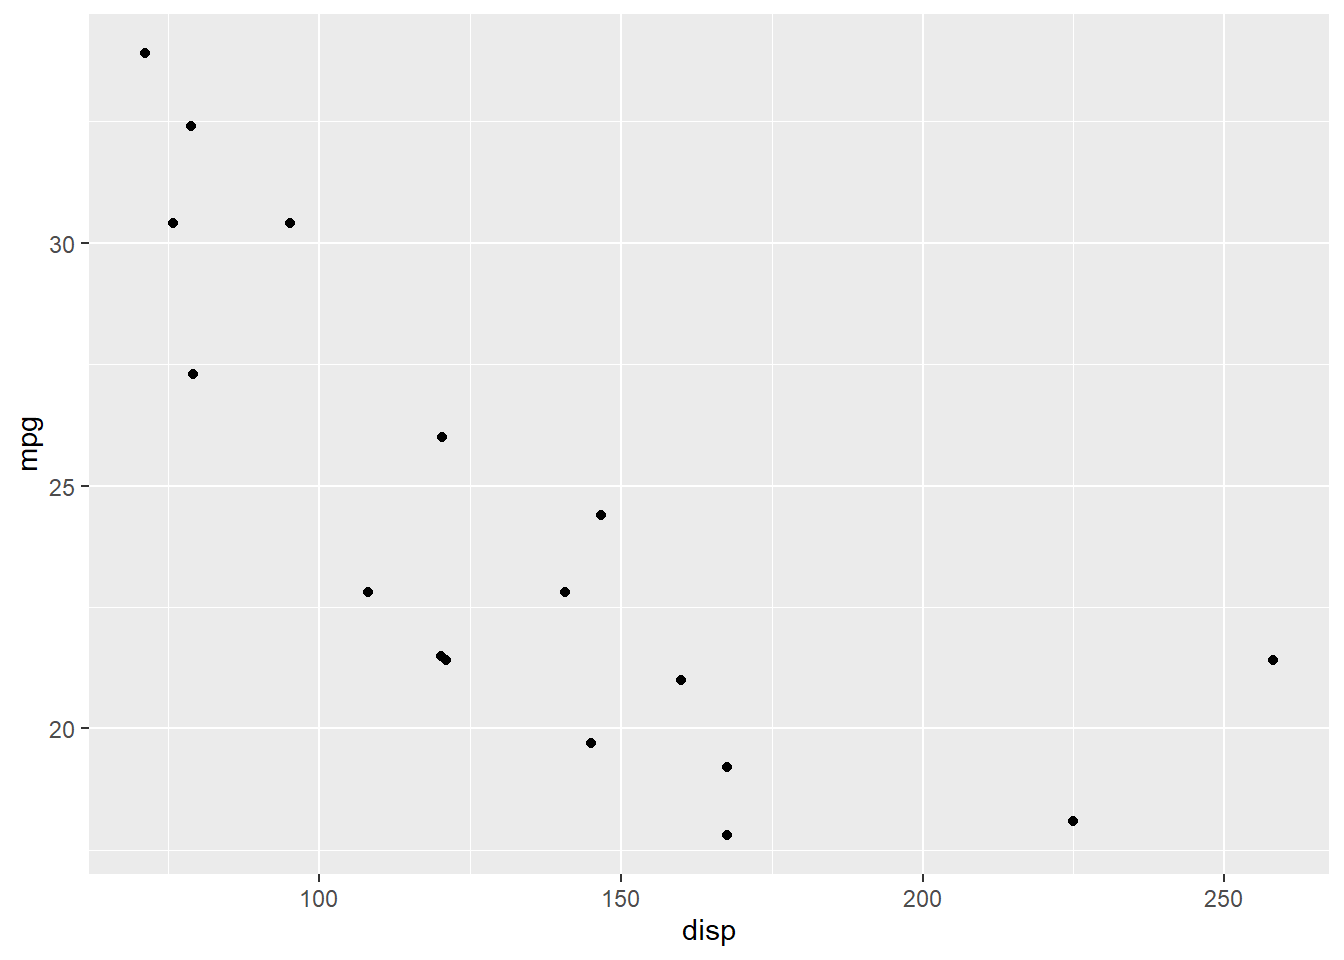
2.5 Do It(1-5)
lm() is a function in Base R to fit linear models (or simply regression)
mtcars %>%
  filter(cyl %in% c(4,6)) %>%
  ggplot(aes(x = disp, y = mpg)) +
geom_point() + geom_smooth(method = "lm")## `geom_smooth()` using formula 'y ~ x'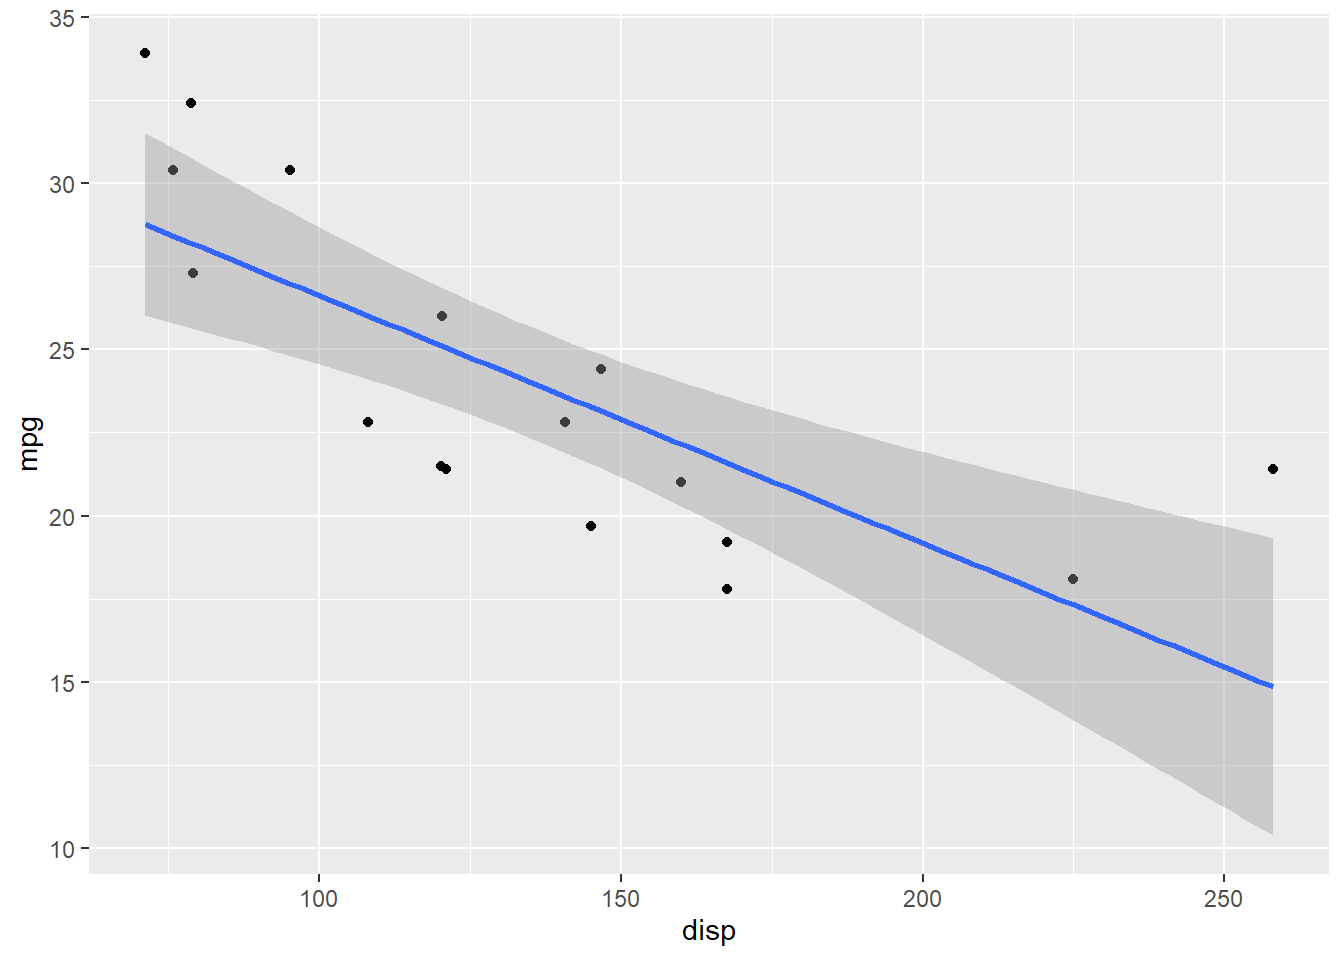
##
## Call:
## lm(formula = mpg ~ disp, data = mtcars2)
##
## Residuals:
##     Min      1Q  Median      3Q     Max
## -3.7873 -3.0124 -0.8294  1.7969  6.5373
##
## Coefficients:
##             Estimate Std. Error t value Pr(>|t|)
## (Intercept) 34.05456    2.30665  14.764 9.69e-11 ***
## disp        -0.07439    0.01599  -4.651 0.000266 ***
## ---
## Signif. codes:  0 '***' 0.001 '**' 0.01 '*' 0.05 '.' 0.1 ' ' 1
##
## Residual standard error: 3.345 on 16 degrees of freedom
## Multiple R-squared:  0.5748,	Adjusted R-squared:  0.5483
## F-statistic: 21.63 on 1 and 16 DF,  p-value: 0.0002663