1 Introduction

S cience is generally assumed to be a cumulative process. In their scientific endeavors, researchers build on the evidence compiled by generations of scientists who came before them. A famous quote by Isaac Newton stresses that if we want to see further, we can do so by standing on the “shoulders of giants”. Many of us are fascinated by science because it is progressive, furthering our understanding of the world, and helping us to make better decisions.
At least by the numbers alone, this sentiment may be justified. Never in history did we have access to more evidence in the form of published research articles than we do today. Petabytes of research findings are produced every day all around the world. In biomedicine alone, more than one million peer-reviewed articles are published each year (Björk, Roos, and Lauri 2008).
The amount of published research findings is also increasing almost exponentially. The number of articles indexed for each year in one of the largest bibliographical databases, PubMed, symbolizes this in an exemplary fashion. Until the middle of the 20th century, only a few hundred research articles are listed for each year. These numbers rise substantially for the following decades, and since the beginning of the 21st century, they skyrocket (see Figure 1.1).
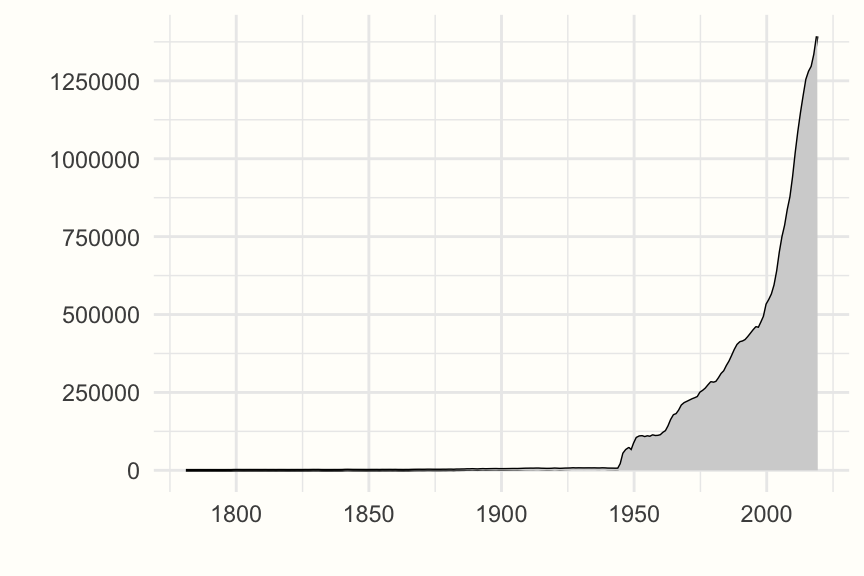
Figure 1.1: Articles indexed in PubMed by year, 1781-2019
In principle, this development should make us enthusiastic about the prospects of science. If science is cumulative, more published research equals more evidence. This should allow us to build more powerful theories, and to dismantle fallacies of the past.
Yet, of course, it is not that easy. In a highly influential paper, John Ioannidis of Stanford criticized the notion that science is automatically cumulative and constantly improving. His article has the fitting title “Why Science Is Not Necessarily Self-Correcting” (Ioannidis 2012). He argues that research fields can often exist in a state where an immense research output is produced on a particular topic or theory, but where fundamental fallacies remain unchallenged and are only perpetuated.
Back in the 1970s, the brilliant psychologist Paul Meehl already observed that in some research disciplines, there is a close resemblance between theories and fashion trends. Many theories, Meehl argued, are not continuously improved or refuted, they simply “fade away” when people start to lose interest in them (Meehl 1978).
It is an inconvenient truth that the scientific process, when left to its own devices, will not automatically move us to the best of all possible worlds. With unprecedented amounts of research findings produced each day, it is even more important to view and critically appraise bodies of evidence in their entirety. Meta-analysis can be enormously helpful in achieving this, as long as we acknowledge its own limitations and biases.
1.1 What Are Meta-Analyses?
One of its founding fathers, Gene V. Glass, described meta-analysis as an “analysis of analyses” (Glass 1976). This simple definition already tells us a lot. In conventional studies, the units of analysis are a number of people, specimens, countries, or objects. In meta-analysis, primary studies themselves become the elements of our analysis.
The aim of meta-analysis is to combine, summarize and interpret all available evidence pertaining to a clearly defined research field or research question (Lipsey and Wilson 2001, chap. 1). However, it is only one method to do this. There are at least three distinct ways through which evidence from multiple studies can be synthesized (Pim Cuijpers 2016).
Traditional/Narrative Reviews. Until way into the 1980s, narrative reviews were the most common way to summarize a research field. Narrative reviews are often written by experts and authorities of a research field. There are no strict rules on how studies in a narrative review have to be selected, and how to define the scope of the review. There are also no fixed rules on how to draw conclusions from the reviewed evidence. Overall, this can lead to biases favoring the opinion of the author. Nevertheless, narrative reviews, when written in a balanced way, can be a helpful way for readers to get an overall impression of the relevant research questions and evidence base of a field.
Systematic Reviews. Systematic reviews try to summarize evidence using clearly defined and transparent rules. In systematic reviews, research questions are determined beforehand, and there is an explicit, reproducible methodology through which studies are selected and reviewed. Systematic reviews aim to cover all available evidence. They also assess the validity of evidence using predefined standards and present a synthesis of outcomes in a systematic way.
Meta-Analyses. Most meta-analyses can be seen as an advanced type of a systematic review. The scope of meta-analyses is clearly defined beforehand, primary studies are also selected in a systematic and reproducible way, and there are also clear standards through which the validity of the evidence is assessed. This is why it is common to find studies being named a “systematic review and meta-analysis”. However, there is one aspect which makes meta-analyses special. Meta-analyses aim to combine results from previous studies in a quantitative way. The goal of meta-analyses is to integrate quantitative outcomes reported in the selected studies into one numerical estimate. This estimate then summarizes all the individual results. Meta-analyses quantify, for example, the effect of a medication, the prevalence of a disease, or the correlation between two properties, across all studies1. They can therefore only be applied to studies which report quantitative results. Compared to systematic reviews, meta-analyses often have to be more exclusive concerning the kind of evidence that is summarized. To perform a meta-analysis, it is usually necessary that studies used the same design and type of measurement, and/or delivered the same intervention (see Chapter 1.3).
Individual Participant Data Meta-Analysis
Depending on the definition, there is also a fourth type of evidence synthesis method, so called Individual Participant Data (IPD) Meta-Analysis (Richard D. Riley, Lambert, and Abo-Zaid 2010; Richard D. Riley, Tierney, and Stewart 2021). Traditionally, meta-analyses are based on aggregated results of studies that are found in the published literature (e.g., means and standard deviations, or proportions). In IPD meta-analysis, the original data of all studies is collected instead and combined into one big data set.
IPD meta-analysis has several advantages. For example, it is possible to impute missing data and apply statistical methods in exactly the same way across all studies. Furthermore, they can make it easier to explore variables which influence the outcome of interest. In traditional meta-analyses, only so-called study-level variables (e.g., the year of publication, or the population used in the study) can by used to do this. However, it is often participant-level information (e.g. an individual person’s age or gender) which may play a role as an important moderators of the results. Such variables can only be explored using IPD meta-analysis.
IPD meta-analysis is a relatively new method, and the overwhelming majority of meta-analyses conducted today remain “traditional” meta-analyses. This is also one reason why we will not cover IPD meta-analysis methods in this guide.
This has nothing to do with traditional meta-analysis being superior–the opposite is correct. It is simply due to the fact that making all research data openly available has unfortunately been very uncommon in most disciplines until recently. While it is relatively easy to extract summarized results from published research reports, obtaining original data from all relevant studies is much more challenging. In biomedical research, for example, it has been found that studies which considered both individual participant and aggregate data could only obtain IPD from approximately 64% of the eligible studies (Richard D. Riley, Simmonds, and Look 2007). A more recent review found that, while the median number of studies included in IPD meta-analyses was eleven, individual participant data could only be obtained from a median of seven studies (Wang et al. 2021).
1.2 “Exercises in Mega-Silliness”: A Historical Anecdote
Meta-analysis was not invented by one person alone, but by many founding mothers and fathers (O’Rourke 2007). The first attempts to statistically summarize the effects of separate, but similar studies date back around 100 years, and can be linked to two of the most important statisticians of all time, Karl Pearson and Ronald A. Fisher.
Pearson, in the beginning of the 20th century, combined findings on the effects of typhoid inoculation across the British Empire to calculate a pooled estimate (Shannon 2016). Fisher, in his seminal 1935 book on the design of experiments, covered approaches to analyze data from multiple studies in agricultural research, and already acknowledged the problem that study results may vary due to location and time (R. A. Fisher 1935; O’Rourke 2007).
The name “meta-analysis” and the beginning of its rise to prominence, however, can be traced back to a scholarly dispute raging in the mid-20th century. In 1952, the famous British psychologist Hans Jürgen Eysenck (Figure 1.2) published an article in which he claimed that psychotherapy (in that time, this largely meant Freudian psychoanalysis) was ineffective. If patients get better during therapy, it is because their situation would have improved anyway due to factors that have nothing to do with the therapy. Even worse, Eysenck claimed, psychotherapy would often hinder patients from getting better.
The reputation of psychotherapy took a big hit, and it did not recover until the late 1970s. During that time, Gene V. Glass developed a technique he termed “meta-analysis”, which allowed to pool Standardized Mean Differences2 across studies. The first extensive application of his technique was in an article published in the American Psychologist, written by Mary L. Smith and Glass himself (Smith and Glass 1977). In this large study, results from 375 studies with more than 4000 participants were combined in a meta-analysis.
The study found that psychotherapies had a pooled effect of 0.68, which can be considered quite large. Glass’ work had an immense impact because it provided quantitative evidence that Eysenck’s verdict was wrong. Eysenck himself, however, was not convinced, calling the meta-analysis “an abandonment of scholarship” and “an exercise in mega-silliness” (Eysenck 1978).

Figure 1.2: Hans Jürgen Eysenck (Sirswindon/CC BY-SA 3.0).
Today we know that Smith and Glass’ study may have overestimated the effects of psychotherapy because it did not control for biases in the included studies (P. Cuijpers, Karyotaki, et al. 2019). However, the primary finding that some psychotherapies are effective has been corroborated by countless other meta-analyses in the following decades. Eysenck’s grim response could not change that meta-analysis soon became a commonly used method in various fields of study. This time has been very aptly described as the “meta-analytic Big Bang” (Shadish and Lecy 2015).
About the same time Glass developed his meta-analysis method, Hunter and Schmidt started crafting their own type of meta-analysis techniques putting emphasis on the correction of measurement artifacts (Schmidt and Hunter 1977; Hunter and Schmidt 2004). Meta-analysis also found its way into medicine through the groundbreaking work of Peter Elwood and Archie Cochrane, among others, who used meta-analysis to show that aspirin has a small, but statistically and clinically relevant preventive effect on the recurrence of heart attacks (Peto and Parish 1980; Elwood 2006; O’Rourke 2007).
In the mid-80s, Rebecca DerSimonian and Nan Laird introduced an approach to calculate random-effects meta-analyses (see Chapter 4.1.2) that has been in use to this day (DerSimonian and Laird 1986). Countless other innovations have helped to increase the applicability, robustness and versatility of meta-analytic methods in the last four decades.
The Cochrane and Campbell Collaboration
The Cochrane Collaboration (or simply Cochrane), founded in 1993 and named after Archie Cochrane, has played a crucial role in the development of applied meta-analysis. Cochrane is an international network of researchers, professionals, patients and other relevant stakeholders who “work together to produce credible, accessible health information that is free from commercial sponsorship and other conflicts of interest”.
Cochrane uses rigorous standards to synthesize evidence in the biomedical field. The institution has its headquarters in London, but also has local branches in several countries around the world.
The Cochrane Collaboration issues the regularly updated Handbook for Systematic Reviews of Interventions (Julian Higgins et al. 2019) and the Cochrane Risk of Bias Tool (Sterne et al. 2019). Both are widely considered to be standard reference works for all technical details on systematic reviews and meta-analyses (see Chapter 1.4).
An organization similar to Cochrane is the Oslo-based Campbell Collaboration, which primarily focuses on research in the social sciences.
1.3 Apples and Oranges: A Quick Tour of Meta-Analysis Pitfalls
In the last decades, meta-analysis has become a universally accepted research tool. This does not come without its own costs. Conducting a high-quality primary study is often very costly, and it can take many years until the results can finally be analyzed. In comparison, meta-analyses can be produced without too many resources, and within a relatively small time. Nevertheless, meta-analyses often have a high impact and they are frequently cited (Patsopoulos, Analatos, and Ioannidis 2005).
This means that scientific journals are often very inclined to publish meta-analyses, maybe even if their quality or scientific merit is limited. Unfortunately, this creates a natural incentive for researchers to produce many meta-analyses, and scientific considerations sometimes become secondary.
Ioannidis (2016) criticized that an immense amount of redundant and misleading meta-analyses is produced each year. On some “hot” topics, there are more than 20 recent meta-analyses. Some meta-analyses may also be heavily biased by corporate interests, for example in pharmacotherapy research (Ebrahim et al. 2016; Kirsch et al. 2002). As we have mentioned before, reproducibility is a hallmark of good science. In reality, however, the reproducibility of many meta-analyses is all too often limited because important information is not reported (Lakens et al. 2017).
A common problem is also that different meta-analyses on the same or overlapping topics come to different conclusions. In psychotherapy research, for example, there has been an ongoing debate pertaining to the question if all types of psychotherapy produce equivalent outcomes. Countless reviews have been published supporting either one conclusion or the other (Wampold 2013; Pim Cuijpers, Reijnders, and Huibers 2019).
While some of these issues may be associated with systemic problems of the scientific process, others can be traced back to flaws of meta-analyses themselves. Therefore, we want to lead you through a quick tour of common meta-analysis pitfalls (Borenstein et al. 2011, chap. 40; Greco et al. 2013; Sharpe 1997).
1.3.1 The “Apples and Oranges” Problem
One may argue that meta-analysis means combining apples with oranges. Even with the strictest inclusion criteria, studies in a meta-analysis will never be absolutely identical. There will always be smaller or larger differences between the included sample, the way an intervention was delivered, the study design, or the type of measurement used in the studies.
This can be problematic. Meta-analysis means to calculate a numerical estimate which represents the results of all studies. Such an estimate can always be calculated from a statistical point of view, but it becomes meaningless when studies do not share the properties that matter to answer a specific research question.
Imagine the, admittedly absurd, scenario where a meta-analyst decides to pool both studies on the effect of job satisfaction on job performance, as well as all available evidence on the effect of medication on the HbA1c value of diabetic patients in one meta-analysis. The results would be pointless to organizational psychologists and diabetologists alike.
Now, imagine that the same poor meta-analyst, trying to learn from previous mistakes, overcompensates and conducts a meta-analysis containing only studies published between 1990 and 1999 in which Canadian males in their sixties with moderate depressive symptoms were treated using 40mg of Fluoxetine per day, for exactly six weeks. The meta-analyst may proudly report the positive results of the study to a psychiatrist. However, the psychiatrist may only ask: “and what do I do if my patient is 45 years old and French”?
This brings us to an important point. The goal of meta-analyses is not to heedlessly throw everything together that can be combined. Meta-analysis can be used to answer relevant research questions that go beyond the particularities of individual studies (Borenstein et al. 2011, chap. 40). The scope and specificity of a meta-analysis should therefore be based on the research question it wants to answer, and this question should be of practical relevance (see Chapter 1.4).
If we are interested, for example, if a type of training program is effective across various age groups, cultural regions and settings, it makes perfect sense to put no restriction on the population and country of origin of a study. However, it may then be advisable to be more restrictive with respect to the training program evaluated in the studies, and only include the ones in which the training had a certain length, or covered similar topics.
Results of such a meta-analysis would allow us not only to estimate the pooled effect of the training but also allow us to quantify if and how much this effect may vary. Meta-analysis is capable to accommodate and make sense out of such forms of heterogeneity. In Chapter 5, we will have a closer look at this important concept.
To sum up, whether the “Apples and Oranges” problem is in fact an issue highly depends on the question a meta-analysis wants to answer. Variation between studies can often be unproblematic, and even insightful if it is correctly incorporated into the aims and problem specification of a meta-analysis.
1.3.2 The “Garbage In, Garbage Out” Problem
The quality of evidence produced by a meta-analysis heavily depends on the quality of the studies it summarizes. If the results reported in our included findings are biased, or downright incorrect, the results of the meta-analysis will be equally flawed. This is what the “Garbage In, Garbage Out” problem refers to. It can be mitigated to some extent by assessing the quality or risk of bias (see Chapter 1.4 and 15) of the included studies.
However, if many or most of the results are of suboptimal quality and likely biased, even the most rigorous meta-analysis will not be able to balance this out. The only conclusion that can usually be drawn in such cases is that no trustworthy evidence exists for the reviewed topic, and that more high-quality studies have to be conducted in the future. However, even such a rather disappointing outcome can be informative, and help guide future research.
1.3.3 The “File Drawer” Problem
The file drawer problem refers to the issue that not all relevant research findings are published, and are therefore missing in our meta-analysis. Not being able to integrate all evidence in a meta-analysis would be undesirable, but at least tolerable if we could safely assume that research findings are missing at random in the published literature.
Unfortunately, they are not. Positive, “innovative” findings often generate more buzz than failed replications or studies with negative and inconclusive results. In line with this, research shows that in the last decades, less and less negative findings have been published in many disciplines, particularly in social science and the biomedical field (Fanelli 2012).
There is good reason to believe that studies with negative or “disappointing” results are systematically underrepresented in the published literature and that there is a so called publication bias. The exact nature and extent of this bias can be at best a “known unknown” in meta-analyses.
However, there are certain ways through which publication bias can be minimized. One pertains to the way that studies are searched and selected (see Chapter 1.4). The other approaches are statistical methods which try to estimate if publication bias exists in a meta-analysis, and how big its impact may be. We will cover a few of these methods in Chapter 9.
1.3.4 The “Researcher Agenda” Problem
When defining the scope of a meta-analysis, searching and selecting studies, and ultimately pooling outcome measures, researchers have to make a myriad of choices. Meta-analysis comes with many “researcher degrees of freedom” (Wicherts et al. 2016), leaving much space for decisions which may sometimes be arbitrary, and sometimes the result of undisclosed personal preferences.
The freedom of meta-analysts in their modus operandi becomes particularly problematic when researchers are consciously or subconsciously driven by their own agenda. Meta-analyses are usually performed by applied researchers, and having extensive subject-specific expertise on the reviewed topic is a double-edged sword. On the one hand, it can help to derive and answer meaningful research questions in a particular field.
On the other hand, such experts are also deeply invested in the research area they are examining. This means that many meta-analysts may hold strong opinions about certain topics, and may intentionally or unintentionally influence the results in the direction that fits their beliefs.
There is evidence that, given one and the same data set, even experienced analysts with the best intentions can come to drastically varying conclusions (Silberzahn et al. 2018). The problem may be even more grave in intervention research, where some meta-analysts have a substantial researcher allegiance because they have helped to develop the type of intervention under study. Such researchers may of course be much more inclined to interpret outcomes of a meta-analysis more positively than indicated by the evidence.
One way to reduce the researcher agenda problem is pre-registration, and publishing a detailed analysis plan before beginning with the data collection for a meta-analysis (see Chapter 1.4 and 16.3.5).
1.4 Problem Specification, Study Search & Coding
In the last chapter, we took some time to discuss common problems and limitations of meta-analyses. Many of these issues, such as the “Apples and Oranges” problem, the “File Drawer” problem, or the “Researcher Agenda” problem, can and should be addressed by every meta-analyst.
This begins long before you start calculating your first results. No meta-analysis can be conducted without data, and this data has to come from somewhere. We first have to specify the research question and eligibility criteria of our planned meta-analysis, search for studies and select the relevant ones, extract the data we need for our calculations, and then code important information we want to report later on.
There are several rules, standards and recommendations we can or should follow during each of these steps; they can help us to create a high-quality meta-analysis. Such high-quality meta-analyses contain a comprehensive selection of all suitable evidence, are unbiased and impartial with respect to their subject, and they draw valid, justified, and practically relevant conclusions from their results.
However, even when “following all the rules”, it may not always be clear which specific decision is the best to achieve this in practice. It is possible that people will disagree with the way you went about some things. This is normal and usually just fine, as long as your methodological decisions are both transparent and reproducible (Pigott and Polanin 2020).
In this chapter, we will go chronologically through a few important building blocks needed before we can begin with our first calculations. The length of this chapter is not representative of the time this process of data acquisition takes in reality. From our experience, statistical analyses only make up a maximum of 15% of the time spent on a meta-analysis, much less compared to everything that comes before. But specifying the research question, systematically searching for studies and reliably coding extracted data is essential. It builds the basis of every good meta-analysis.
1.4.1 Defining the Research Question
When designing a study, the first thing we do is define the research question. Meta-analysis is no exception. To define a good research question, it helps to first see it as a form of problem specification. To be pertinent and impactful, a meta-analysis should solve a problem. To identify such problems, some subject-specific knowledge is necessary.
If you want to find a good research question for a meta-analysis, it may therefore be helpful to pick a research area in which you have some background knowledge and ask yourself a few basic questions first. What are the questions which are currently relevant in this particular field? Is there a gap in current knowledge on certain topics? Are there any open discussions that remain unsettled? It might also help to think about the intended target audience. What are problems that are relevant to other researchers? What issues might other people, for example health care professionals, state agencies, schools, or human resource departments face?
Meta-analysis depends on previous research. Once you know the general direction of your research problem, it therefore helps to have a look at the current literature. Do previous primary studies exist on this topic, and how did they address the problem? What methods and outcome measures did they use? What limitations did they mention in the background and discussion section of the article? Have previous reviews and meta-analyses addressed the topic, and what issues have they left open?
Cummings and colleagues (2013) have proposed a few criteria we can use to specify the problem to be covered by our meta-analysis, the FINER framework. It states that a research question should be Feasible, Interesting, Novel, Ethical, and Relevant.
Step by step, asking yourself these questions should make it easier to define what you want to achieve with your meta-analysis. It may also become clear that meta-analysis is not suitable for your problem. For example, there may simply be no relevant studies that have addressed the topic; or there may already be recent high-quality meta-analyses in the literature which address the issue sufficiently.
However, if you get the feeling that your problem is relevant to one or several groups of people, that previous studies have provided data pertaining to this problem, and that previous reviews and meta-analyses have not sufficiently or adequately addressed it, you can proceed to turn it into a research question.
Let us give you an example of how this can be done. There is evidence suggesting that gender biases exist in medical research (Hamberg 2008; Nielsen et al. 2017). Especially in earlier decades, many clinical trials only or largely used male participants, and results were simply assumed to generalize to women as well. This has probably led to worse health outcomes in women for some diseases, such as heart conditions (Kim and Menon 2009; Mosca et al. 2013)3.
Let us imagine that you are a medical researcher. You have heard rumors that a commonly used drug, Chauvicepine, may have serious side effects in women that have remained largely unrecognized. You determined that this, if true, would be a highly relevant problem because it would mean that many women are prescribed with a drug that may not be safe for them.
A look into the literature reveals that most studies investigating Chauvicepine were randomized placebo-controlled trials. The first of these trials were conducted in populations which only or predominantly consisted of men. But you also found a few more recent trials in which the gender makeup was more balanced. Many of these trials even reported the number of negative side effects that occurred in the trial separately for men and women. You also find a recent commentary in a medical journal in which a doctor reports that in her clinic, many women have experienced negative side effects when being treated with the medication.
Based on this, you decide that it may be interesting to address this problem in a meta-analysis. Therefore, you translate the problem you just discovered into a research question: “does evidence from randomized placebo-controlled trials show that Chauvicepine leads to a significant increase of negative side effects in women, compared to placebo”?
Having derived a first formulation of the research question is only the first step. We now have to translate it into concrete eligibility criteria. These eligibility criteria will guide the decision which studies will and will not be included in our meta-analysis. They are therefore extremely important and should be absolutely transparent and reproducible.
A good way to start specifying the eligibility criteria is to use the PICO framework (Mattos and Ruellas 2015). This framework is primarily aimed at intervention studies, but it is also helpful for other types of research questions. The letters in PICO stand for Population, Intervention, Control group or comparison, and Outcome:
Population: What kind of people or study subjects do studies have to include to be eligible? Again, remember that it is important to address this questions as precisely as possible, and to think of the implications of each definition. If you only want to include studies in young adults, what does “young adults” mean? That only people between 18 and 30 were included? Can that even easily be determined from the published articles? Or is it just important that people were recruited from places which are usually frequented by young adults, such as universities and Cardi B concerts? If you only want to include studies on patients with a specific medical condition, how has that condition been diagnosed? By a trained health care professional, or is a self-report questionnaire sufficient? Many of these questions can be answered by resorting to the F and R parts of the FINER framework. Is it feasible to impose such a limitation on published research? And is it a relevant differentiation?
Intervention: What kind of intervention (or alternatively, exposure) do studies have to examine? If you want to study the effects of an intervention, it is important to be very clear on the type of treatment that is eligible. How long or short do interventions have to be? Who is allowed to deliver them? What contents must the intervention include? If you do not focus on interventions, how must the independent variable be operationalized? Must it be measured by a specific instrument? If you study job satisfaction, for example, how must this construct be operationalized in the studies?
Control group or comparison: To what were results of the study compared to? A control group receiving an attention placebo, or a pill placebo? Waitlists? Another treatment? Or nothing at all? It is also possible that there is no comparison or control group at all; for example if you want to study the prevalence estimates of a disease across different studies, or how many specimens of a species there are in different habitats.
Outcome. What kind of outcome or dependent variable do studies have to measure? And how must the variable be measured? Is it the mean and standard deviation of questionnaire scores? Or the number of patients who died or got sick? When must the outcome be measured? Simply after the treatment, no matter how long the treatment was? Or after one to two years?
Guidelines for Systematic Reviews and Meta-Analyses
In light of the often suboptimal quality of meta-analyses, some guidelines and standards have been established on how meta-analyses should be conducted.
If you meta-analyze evidence in biomedical research or on the effect of an intervention, we strongly advise you to follow the Preferred Reporting Items for Systematic Reviews and Meta-Analyses, or PRISMA (Moher et al. 2009). The PRISMA statement contains several recommendations on how nearly all aspects of the meta-analysis process should be reported. The statement can also be found online.4
For meta-analyses of psychological and behavior research, the American Psychological Association’s Meta-Analysis Reporting Standards (Appelbaum et al. 2018), or MARS, may be followed.
Although these standards largely comment on how meta-analyses should be reported, they also have implications on best practices when performing a meta-analysis. PRISMA and MARS share many core elements, and many things that we cover in this chapter are also mentioned in both of these guidelines.
An even more detailed resource is the Cochrane Handbook for Systematic Reviews of Interventions (see Chapter 1.2), which contains precise recommendations on virtually every aspect of systematic reviews and meta-analyses. An overview of methodological standards for meta-analyses in social science can be found in Pigott and Polanin (2020).
While the PICO framework is an excellent way to specify the eligibility criteria of a meta-analysis, it does not cover all information that may be relevant. There are a few other aspects to consider (Lipsey and Wilson 2001).
One relevant detail are the eligible research designs. In evidence-based medicine, it is common to only include evidence from randomized controlled trials (meaning studies in which participants were allocated to the treatment or control group by chance); but this is not always required (Borenstein et al. 2011, chap. 40).
It may also be helpful to specify the cultural and linguistic range of eligible studies. Most research is based on WEIRD populations, meaning western, educated, industrialized, rich, and democratic societies (Henrich, Heine, and Norenzayan 2010). Especially in the social sciences, it is very likely that certain effects or phenomena do not generalize well to countries with other societal norms. Many researchers, however, only consider publications in English for their meta-analyses, to avoid having to translate articles in other languages.
This means that some evidence from different language areas will not be taken into account. Although English is the most common language for scientific publishing in most disciplines, it should be at least made transparent in the eligibility criteria that this limitation exists. If one of the goals of a meta-analysis is to examine cross-cultural differences, however, it is generally advisable to extend the eligibility criteria to other languages, provided all the other criteria are fulfilled.
Another important aspect is the publication type that is allowed for a meta-analysis. Sometimes, meta-analysts only include research articles which were published in peer-reviewed scientific journals. The argument is that studies taken from this source fulfill higher standards since they have passed the critical eyes of experts in the field. This justification is not without flaws. In Chapter 1.3, we already covered that the “File Drawer” problem can seriously limit the validity of meta-analysis results because positive findings are more likely to get published.
A way to mitigate the risk of publication bias is therefore to also include grey literature. Grey literature can be defined as all types of research materials that have not been made available through conventional publication formats. This includes research reports, preprints, working papers, or conference contributions. Dissertations also often count as grey literature, although many of them are indexed in electronic bibliographic databases today (Schöpfel and Rasuli 2018).
It may be advisable to at least also include dissertations in a meta-analysis. Compared to other types of unpublished material, it may be rather unlikely that the information provided in dissertations is heavily biased or downright fraudulent. Furthermore, you can still define other eligibility criteria to ensure that only studies fulfilling certain methodological requirements are included, no matter if they were published in scientific journals or not.
The last step of defining your eligibility criteria is to write them down as a list of inclusion and exclusion criteria that you will apply. Here is an example from a meta-analysis of insomnia interventions in college students showing you this can be done (Saruhanjan et al. 2020):
“We included: (a) RCTs [randomized controlled trials; authors’ note] in which (b) individuals enrolled at a tertiary education facility (university, college or comparable postsecondary higher education facility) at the time of randomization, (c) received a sleep-focused psychological intervention, (d) that was compared with a passive control condition, defined as a control condition in which no active manipulation was induced as part of the study (wait-list, treatment as usual).
For the purposes of this analysis, “sleep-focused” means that (e) effects on symptoms of sleep disturbances (global measures of sleep disturbances, sleep-onset latency […], fatigue and daytime functionality, pre-sleep behaviour and experiences) were assessed as a (f) target outcome (by declaring a sleep outcome as the primary outcome or by stating the intervention was primarily aimed at this outcome) using (g) standardized symptom measures (objective sleep measures, standardized sleep or fatigue questionnaires, sleep diaries, items recording sleep quantity, quality or hygiene).
Only studies (h) published in English or German were considered for inclusion.”
1.4.2 Analysis Plan & Preregistration
After your research question and eligibility criteria are set, it is sensible to also write an analysis plan (Pigott and Polanin 2020; Tipton, Pustejovsky, and Ahmadi 2019). In statistics, there is an important distinction between a priori and post hoc analyses. A priori analyses are specified before seeing the data. Post hoc, or exploratory, analyses are conducted after seeing the data, or based on the results implicated by the data.
Results of a priori analyses can be regarded as much more valid and trustworthy than post hoc analyses. Post hoc analyses make it easier to tweak certain details about the analysis or the data itself until results support the goals of the researcher. They are therefore much more prone to the “Researcher Agenda” problem we discussed in Chapter 1.3.
In the analysis plan, we specify all important calculations we want to perform in our meta-analysis a priori. This serves two purposes. First, it allows others to verify that the analyses we made were indeed planned, and are not the mere result of us playing around with the data until something desirable came out. Second, a detailed analysis plan also makes our meta-analysis reproducible, meaning that others can understand what we did at each step of our meta-analysis, and try to replicate them.
When using R, we can take the reproducibility of our analyses to a whole other level by writing documents which allow others to re-run every step of our analysis (see Chapter 16 in the “Helpful Tools” section). But this is relevant after we complete our analyses. In the analysis plan, we specify what we plan to do before any data has been collected.
There are a few things we should always specify in our analysis plan. We should make clear which information we will extract, and which effect size metric will be calculated for each included study (see Chapter 3). It is also recommended to decide beforehand if we will use a fixed- or random-effects model to pool results from each study, based on the amount of variation between studies we expect (see Chapter 4). An a priori power analysis may also be helpful to determine how many studies are required for our meta-analysis to find a statistically significant effect (see Chapter 14 in the “Helpful Tools” section).
Furthermore, it is crucial to determine if we want to assess if some variables explain differences in the outcomes of included studies using subgroup analysis (Chapter 7) or meta-regression (Chapter 8). For example, if our hypothesis states that the publication year might be associated with a study’s outcome, and if we want to have a look at this association later in our meta-analysis, we mention this in our analysis plan. If we plan to sort studies into subgroups and then have a look at these subgroups separately, we should also report the exact criteria through which we will determine that a study belongs to a specific subgroup (see Chapter 1.4.4).
In part II of this book (“Meta-Analysis in R”), we will cover various statistical techniques to apply as part of a meta-analysis. Every technique we learn there and plan to apply in our meta-analysis should be mentioned in the analysis plan.
Once you are finished writing your analysis plan, do not simply bury it somewhere–make it public. There are a few excellent options for researchers to make their research documents openly available. For example, we can create a new project on the website of the Open Science Framework (OSF; see Chapter 16.3 in the “Helpful Tools” section) and upload our analysis plan there. We can also upload our analysis plan to a preprint server such as medrxiv.org, biorxiv.org, or psyarxiv.com, depending on the nature of our research question.
Once our research question, eligibility criteria, analysis plan, and search strategy (see next chapter) are set, we should also register our meta-analysis. If the meta-analysis has a broadly health-related outcome, this may preferably be done using PROSPERO, one of the largest registries for prospective systematic reviews and meta-analyses. The preregistration service of the OSF is also a good option.
In case we want to go even one step further, we can also write an entire protocol for our meta-analysis (Quintana 2015). A meta-analysis protocol contains the analysis plan, plus a description of the scientific background of our study, more methodological detail, and a discussion of the potential impact of the study.
There are also guidelines on how to write such protocols, such as the PRISMA-P Statement (Moher et al. 2015). Meta-analysis protocols are accepted by many peer-review journals. A good example can be found in Büscher, Torok and Sander (2019), or Valstad and colleagues (2016).
A priori analysis plans and preregistration are essential features of a well-made, trustworthy meta-analysis. And they should not make you anxious. Making the perfect choice for each and every methodological decision straight away is difficult, if not impossible. It is perfectly normal to make changes to one’s initial plans somewhere down the road. We can assure you that, if you are honest and articulate about changes to your planned approach, most researchers will not perceive this as a sign of failure, but of professionalism and credibility.
1.4.3 Study Search
The next step after determining your eligibility criteria and analysis plan is to search for studies. In Chapter 1.1, we discussed that most meta-analyses are an advanced type of systematic review. We aim to find all available evidence on a research question in order to get an unbiased, comprehensive view of the facts. This means that the search for studies should also be as comprehensive as possible. Not only one, but several sources should be used to search for studies. Here is an overview of important and commonly used sources.
Review articles. It can be very helpful to screen previous reviews on the same or similar topics for relevant references. Narrative and systematic reviews usually provide a citation for all the studies that they included in their review. Many of these studies may also be relevant for your purposes.
References in studies. If you find a study that is relevant for your meta-analysis, it is sensible to also screen the articles this study references. It is very likely that the study cites previous literature on the same topic in the introduction or discussion section, and some of these studies may also be relevant for your meta-analysis.
Forward search. A forward search can be seen as the opposite of screening the references of previous primary studies and reviews. It means to take a study that is relevant for the meta-analysis as basis, and then search for other articles that have cited this study since it has been published. This can be done quite easily on the Internet. You simply have to find the online entry of the study; usually, it is on the website of the journal in which it has been published. Most journal websites today have a functionality to display articles that have cited a study. Alternatively, you can also search for the study on Google Scholar (see Table 1.1). Google Scholar can display citing research for every entry.
Relevant journals. Often, there are a number of scientific journals which are specialized in the type of research question you are focused on. It can therefore be helpful to search for studies specifically in those journals. Virtually all journals have a website with a search functionality today, which you can use to screen for potentially eligible studies. Alternatively, you can also use electronic bibliographical databases, and use a filter so that only results from one or several journals are displayed.
The methods we described above can be seen as rather fine-grained strategies. They are ways to search in places where it is very likely that a relevant article will be listed. The disadvantage is that these approaches will unlikely uncover all evidence that is really out there. It is therefore advisable to also use electronic bibliographic databases for one’s search. An overview of important databases can be found in Table 1.1.
One should always conduct a search in several databases, not just one. Many bibliographical databases contain an immense number of entries. Nevertheless, it is common to find that the overlap in the results of databases is smaller than anticipated. You can select the databases you want to search based on their subject-specific focus. If your meta-analysis focuses on health-related outcomes, for example, you should at least search PubMed and CENTRAL.
When searching bibliographic databases, it is important to develop a search string. A search string contains different words or terms, which are connected using operators such as AND or OR. Developing search strings takes some time and experimenting. A good way to start is to use the PICO or eligibility criteria (Chapter 1.4.1) as basis and to connect them using AND (a simplified example would be “college student” AND “psychotherapy” AND “randomized controlled trial” AND “depression”).
Most bibliographical databases also allow for truncation and wildcards. Truncation means to replace a word ending with a symbol, allowing it to vary as part of your search. This is usually done using asterisks. Using “sociolog*” as a search term, for example, means that the database will search for “sociology”, “sociological”, and “sociologist” at the same time.
A wildcard signifies that a letter in a word can vary. This can come in handy when there are differences in the spelling of words (for example, differences between American English and British English). Take the search term “randomized”. This will only find studies using American English spelling. If you use a wildcard (often symbolized by a question mark), you can write “randomi?ed” instead, and this will also give results in which the British English spelling was used (“randomised”).
When developing your search string, you should also have a look at the number of hits. A search string should not be too specific, so that some relevant articles are missed. For example, getting around 3000 hits for your search string is manageable in later steps, and it makes it more likely that all important references will be listed in your results. To see if your search string is generally valid, it sometimes helps to search the first few hundred hits you get, and to check if at least some of the references have something to do with your research question.
Once you developed the final versions of the search strings you want to use in your selected databases, save them somewhere. It is best practice to already include your search string(s) in your preregistration. Reporting of the search string (for example in the supplement) is required if you want to publish a meta-analysis protocol (see Chapter 1.4.1), or the final results of your meta-analysis.
In conclusion, we want to stress that searching bibliographic databases is an art in and of itself, and that this paragraph only barely scratches the surface. A much more detailed discussion of this topic can be found in Cuijpers (2016) and Bramer and colleagues (2018).
| Database | Description |
|---|---|
| Core Database | |
| PubMed | Openly accessible database of the US National Library of Medicine. Primarily contains biomedical research. |
| PsycInfo | Database of the American Psychological Association. Primarily covers research in the social and behavioral sciences. Allows for a 30-day free trial. |
| [Cochrane Central Register of Controlled Trials (CENTRAL) ]( | ttps://www.cochranelibrary.com/central)|Openly accessible database of the Cochrane Collaboration. Primarily covers health-related topics. |
| Embase|Database of biomedical research maintained by the large scientific publisher Elsevier. Requires a license. | |
| [ProQuest International Bibliography of the Social Sciences] | https://www.about.proquest.com/products-services/ibss-set-c.html)|Database of social science research. Requires a license. |
| Education Resources Information Center (ERIC)|Openly accessible database on education research. | |
| Citation Database | |
| Web of Science | Interdisciplinary citation database maintained by Clarivate Analytics. Requires a license. |
| Scopus | Interdisciplinary citation database maintained by Elsevier. Requires a license. |
| Google Scholar | Openly accessible citation database maintained by Google. Has only limited search and reference retrieval functionality. |
| Dissertations | |
| ProQuest Dissertations|Database of dissertations. Requires a license | |
| Study Registries | |
| [WHO International Clinical Trials Registry Platform (ICTRP) | (https://www.www.who.int/ictrp)|Openly accessible database of clinical trial registrations worldwide. Can be used to identify studies that have not ( |
| OSF Registries | Openly accessible interdisciplinary database of study registrations. Can be used to identify studies that have not (yet) been published. |
1.4.4 Study Selection
After completing your study search, you should have been able to collect thousands of references from different sources. The next step is now to select the ones that fulfill your eligibility criteria. It is advised to follow a three-stepped procedure to do this.
In the first step, you should remove duplicate references. Especially when you search in multiple electronic bibliographical databases, it is likely that a reference will appear more than once. An easy way to do this is to first collect all your references in one place by importing them into a reference management software. There are several good reference management tools. Some of them, like Zotero or Mendeley can be downloaded for free. Other programs like EndNote provide more functionality but usually require a license.
Nearly all of those reference managers have a functionality which allows you to automatically remove duplicate articles. It is important that you write down the number of references you initially found in your study search, and how many references remained after duplicate removal. Such details should be reported later on once you make your meta-analysis public.
After duplicate removal, it is time to eliminate references that do not fit your purpose, based on their title and abstract. It is very likely that your study search will yield hundreds of results that are not even remotely linked to your research question5. Such references can be safely removed by looking at their title and abstract only. A reference manager will be helpful for this step too. You can go through each reference one after another and simply remove it when you are sure that the article is not relevant for you6.
If you think that a study might contain interesting information based on the title and abstract, do not remove it–even if it seems unlikely that the study is important. It would be unfortunate if you put considerable time and effort into a comprehensive study search just to erroneously delete relevant references in the next step. The title and abstract-based screening of references does not require you to give a specific reason why you excluded the study. In the end, you must only document how many studies remained for the next step.
Based on title and abstract screening, it is likely that more than 90% of your initial references could be removed. In the next step, you should now retrieve the full article for each reference. Based on everything reported in the article, you then make a final decision if the study fulfills your eligibility criteria or not. You should be particularly thorough here because it is the final step determining if a study will be included in your meta-analysis or not. Furthermore, it is not simply sufficient to say that you removed a study because it did not fit your purpose. You have to give a reason here. For each study you decide to remove, you should document why exactly it was not eligible as per your defined criteria. Besides your eligibility criteria, there is one other reason why you might not be able to include a study.
When going through the full article, it might be possible that you discover that not enough information is provided to decide whether the study is eligible or not. It may be possible that a study simply does not provide enough information on the research design. Another frequent scenario is that the results of a study are not reported in a form that would allow to calculate the effect size metric required for your meta-analysis. If this happens, you should try to contact the corresponding author of the study at least two times, and ask for the needed information. Only if the author does not respond, and if the information lacking in the published article is essential, you can exclude the study.
Once we have arrived at the final selection of studies to include, we write down all the details of the inclusion process in a flow diagram. A commonly used template for such a flow chart is the one provided by the PRISMA guidelines7. This flow chart documents all the necessary information we covered above:
How many references we could identify by searching electronic databases;
How many additional references we found through other sources;
The number of references that remained after duplicate removal;
The number of references we removed based on title and abstract;
The number of articles we removed based on the full manuscript, including how many articles where excluded due to specific reason;
The number of studies we included in our qualitative synthesis (i.e. systematic review) and quantitative synthesis (i.e. meta-analysis).
Please note that the number of articles that were not excluded at (5) and the number of studies included in (6) are usually identical, but they do not have to be. For example, it is possible that one article reports results of two or more independent studies, all of which are suitable for meta-analysis. The number of studies would then be higher than the number of included articles.
Double-Screening
Nearly all relevant guidelines and consensus statements emphasize that double screening should be used during the study selection process (Tacconelli 2009; Julian Higgins et al. 2019; Campbell Collaboration 2016).
This means that at least two people should perform each of the study selection steps independently to avoid errors. Reference removal based on the title and abstract should be conducted independently by two or more researchers, and the combination of all records that have not been removed by the assessors should be forwarded to the next step.
Using two or more assessors is even more important in the final step, in which full articles are screened. In this step, each person should independently assess if a study is eligible, and if it is not, give reasons why.
The assessors should then meet and compare their results. It is common that assessors disagree on the eligibility of some studies, and such disagreements can usually be resolved through discussion. If assessors fail to find an agreement, it can be helpful to determine a senior researcher beforehand who can make a final decision in such cases.
Using two or more assessors is not only advisable in the study selection process. This approach is also beneficial when extracting and coding data (see Chapter 1.4.5).
1.4.5 Data Extraction & Coding
When the selection of studies to be included in the meta-analysis is finalized, data can be extracted. There are three major types of information we should extract from the selected articles (Pim Cuijpers 2016):
- Characteristics of the studies.
- Data needed to calculate effect sizes.
- Study quality or risk of bias characteristics.
It is conventional for high-quality meta-analyses to provide a table in which characteristics of the included studies are reported. The exact details reported in this table can vary depending on the research field and research question. However, you should always extract and report the first author of a study, and when it was published. The sample size of each study should also be reported.
Apart from that, you may include some information on characteristics specified in the PICO of your meta-analysis; such as the country of origin, the mean or median age, the proportion of female and male participants, the type of intervention or exposure, the type of control group or comparison (if applicable), as well as the assessed outcomes of each study. If one or several studies have not assessed one of the characteristics, you should indicate that this detail has not been specified in the table.
It is also necessary to extract and collect the data needed to calculate the effect sizes or outcome measures we plan to pool. In Chapter 2, we will discuss in greater detail how you can structure your effect size data in a spreadsheet so that it can easily be used for calculations in R. If your analysis plan (see Chapter 1.4.2) also includes planned subgroup analyses and meta-regressions, you should also extract the data you need for these analyses from the articles.
It is common in meta-analysis to also rate and report the quality of the primary studies. The information you need to extract from each study to do this depends on the type of rating system you are using. Countless tools to assess the quality of primary studies have been developed in the last decades (Sanderson, Tatt, and Higgins 2007).
When only randomized controlled trials are eligible for your study, one of the best ways to code the study quality is to use the Risk of Bias Tool developed by Cochrane (Julian Higgins et al. 2011; Sterne et al. 2019). As it says in the title, this tool does not assess the quality of studies per se, but their risk of bias.
Study quality and risk of bias are related, but not identical concepts. “Bias” refers to systematic errors in the results of a study or their interpretation. Risks of bias are aspects of the way a study was conducted, or its results, that may increase the likelihood of such systematic errors. Even when a study only applies methods that are considered the “state of the art”, it is still possible that biases exist. A study can fulfill all quality standards that are perceived as important in a particular research field, but sometimes even these best practices may not be enough to shield the study from distortions. The “risk of bias” concept thus has a slightly different focus compared to study quality assessments. It primarily cares about the question if the output of an intervention study is believable, and focuses on criteria which are conducive to this goal (Julian Higgins et al. 2019).
On several domains, the risk of bias tool lets you classify the risk of bias of a study as “high” or “low”, or it can be determined that there are “some concerns”. There are also conventions on how the risk of bias can be summarized visually (see Chapter 15, where we describe how this can be done in R). A similar resource to assess the risk of bias in non-randomized studies is the Risk of Bias in Non-randomized Studies of Interventions, or ROBINS-I, tool (Sterne et al. 2016).
The Cochrane Risk of Bias tools have become the standard approach to assess the risk of bias in (non-)randomized clinical trials (Jørgensen et al. 2016). In other areas, current practices unfortunately still rather resemble the Wild West. In psychological research, for example, study quality assessments are often inconsistent, nontransparent, or not conducted at all (Hohn, Slaney, and Tafreshi 2019).
If you plan to meta-analyze studies other than clinical trials, there are two things you can do. First, you can check if the Risk of Bias or ROBINS-I tool may still be applicable, for example if your studies focus on another type of intervention that simply has no health-related focus. Another–admittedly suboptimal–way may be to search for previous high-quality meta-analyses on similar topics, and check how these studies have determined the quality of primary studies.
This ends our dive into the history of meta-analysis, its problems, and how we can avoid some of them when collecting and encoding our data. The next chapter is the beginning of the “hands-on” part of this guide. In it, we will do our own first steps in R.
\[\tag*{$\blacksquare$}\]
1.5 Questions & Answers
Test your knowledge!
- How can a meta-analysis be defined? What differentiates a meta-analysis from other types of literature reviews?
- Can you name one of the founding mothers and fathers of meta-analysis? What achievement can be attributed to her or him?
- Name three common problems of meta-analyses and describe them in one or two sentences.
- Name qualities that define a good research question for a meta-analysis.
- Have a look at the eligibility criteria of the meta-analysis on sleep interventions in college students (end of Chapter 1.4.1). Can you extract the PICO from the inclusion and exclusion criteria of this study?
- Name a few important sources that can be used to search studies.
- Describe the difference between “study quality” and “risk of bias” in one or two sentences.
1.6 Summary
More and more scientific research is published each year, making it harder to keep track of available evidence. However, more research output does not automatically result in scientific progress.
Meta-analysis aims to combine the results of previous studies in a quantitative way. It synthesizes all available evidence pertaining to a research question and can be used for decision-making.
Meta-analytic methods trace back to the beginning of the 20th century. Modern meta-analytic approaches, however, have been developed in the second half of the 20th century, and meta-analysis has become a common research tool since then.
There are several problems that are relevant for each meta-analysis: the “Apples and Oranges” problem, the “Garbage In, Garbage Out” problem, the “File Drawer” problem, and the “Researcher Agenda” problem.
Many of these problems can be mitigated by defining a clear research question and eligibility criteria, writing an analysis plan, pre-registering the meta-analysis, and conducting the study search and data extraction in a systematic and reproducible way.