Chapter 14 Correlation
14.1 Introduction
Understanding relationships between variables is crucial in food science, where we often deal with complex datasets, such as chemical properties, sensory attributes, or production parameters. Correlation analysis quantifies the degree to which two variables are related, while heatmaps provide an intuitive plot of these relationships, enabling easy identification of patterns and clusters.
In this chapter, we will:
Perform correlation analysis on a sample dataset.
Visualize the results using a heatmap.
Discuss practical applications of correlation analysis in food science.
14.2 Preparing the Dataset
For demonstration, we will use the mtcars dataset, a built-in dataset in R that provides data on various car attributes. While not directly related to food science, the structure of this dataset is analogous to real-world datasets with multiple numeric variables.
##                    mpg cyl disp  hp drat    wt  qsec vs am gear carb
## Mazda RX4         21.0   6  160 110 3.90 2.620 16.46  0  1    4    4
## Mazda RX4 Wag     21.0   6  160 110 3.90 2.875 17.02  0  1    4    4
## Datsun 710        22.8   4  108  93 3.85 2.320 18.61  1  1    4    1
## Hornet 4 Drive    21.4   6  258 110 3.08 3.215 19.44  1  0    3    1
## Hornet Sportabout 18.7   8  360 175 3.15 3.440 17.02  0  0    3    2
## Valiant 18.1 6 225 105 2.76 3.460 20.22 1 0 3 114.3 Correlation Analysis
We calculate the correlation matrix for the selected numeric variables. Correlation coefficients range from -1 (perfect negative correlation) to +1 (perfect positive correlation), with 0 indicating no correlation.
# Calculate the correlation matrix
cor_matrix <- cor(correlation_data, use = "complete.obs")

# Display the correlation matrix
print(cor_matrix)
## mpg cyl disp hp drat wt
## mpg 1.0000000 -0.8521620 -0.8475514 -0.7761684 0.68117191 -0.8676594
## cyl -0.8521620 1.0000000 0.9020329 0.8324475 -0.69993811 0.7824958
## disp -0.8475514 0.9020329 1.0000000 0.7909486 -0.71021393 0.8879799
## hp -0.7761684 0.8324475 0.7909486 1.0000000 -0.44875912 0.6587479
## drat 0.6811719 -0.6999381 -0.7102139 -0.4487591 1.00000000 -0.7124406
## wt -0.8676594 0.7824958 0.8879799 0.6587479 -0.71244065 1.0000000
## qsec 0.4186840 -0.5912421 -0.4336979 -0.7082234 0.09120476 -0.1747159
## vs 0.6640389 -0.8108118 -0.7104159 -0.7230967 0.44027846 -0.5549157
## am 0.5998324 -0.5226070 -0.5912270 -0.2432043 0.71271113 -0.6924953
## gear 0.4802848 -0.4926866 -0.5555692 -0.1257043 0.69961013 -0.5832870
## carb -0.5509251 0.5269883 0.3949769 0.7498125 -0.09078980 0.4276059
## qsec vs am gear carb
## mpg 0.41868403 0.6640389 0.59983243 0.4802848 -0.55092507
## cyl -0.59124207 -0.8108118 -0.52260705 -0.4926866 0.52698829
## disp -0.43369788 -0.7104159 -0.59122704 -0.5555692 0.39497686
## hp -0.70822339 -0.7230967 -0.24320426 -0.1257043 0.74981247
## drat 0.09120476 0.4402785 0.71271113 0.6996101 -0.09078980
## wt -0.17471588 -0.5549157 -0.69249526 -0.5832870 0.42760594
## qsec 1.00000000 0.7445354 -0.22986086 -0.2126822 -0.65624923
## vs 0.74453544 1.0000000 0.16834512 0.2060233 -0.56960714
## am -0.22986086 0.1683451 1.00000000 0.7940588 0.05753435
## gear -0.21268223 0.2060233 0.79405876 1.0000000 0.27407284
## carb -0.65624923 -0.5696071 0.05753435 0.2740728 1.0000000014.4 Correlations with a Heatmap
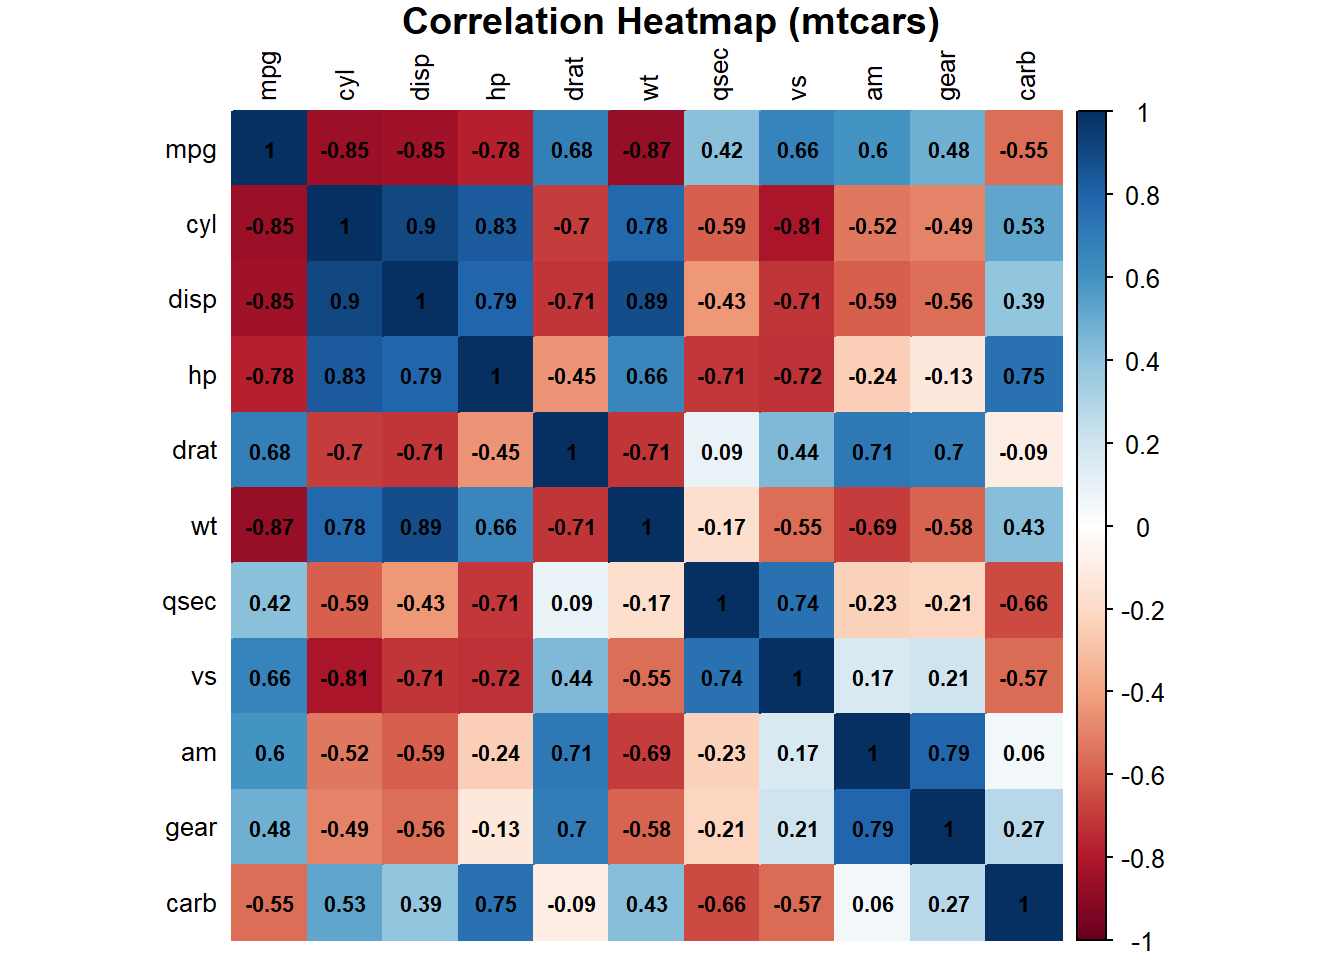
A heatmap is a powerful way to visualize correlations between variables. High correlations are typically represented with stronger colors, making patterns easier to identify.
Using the corrplot package:
# Basic heatmap using corrplot
c1 <- corrplot(cor_matrix, method = "color", addCoef.col = "black",
tl.col = "black", tl.cex = 0.8, number.cex = 0.7,
title = "Correlation Heatmap (mtcars)", mar = c(0, 0, 1, 0))
## $corr
##             mpg        cyl       disp         hp        drat         wt
## mpg   1.0000000 -0.8521620 -0.8475514 -0.7761684  0.68117191 -0.8676594
## cyl  -0.8521620  1.0000000  0.9020329  0.8324475 -0.69993811  0.7824958
## disp -0.8475514  0.9020329  1.0000000  0.7909486 -0.71021393  0.8879799
## hp   -0.7761684  0.8324475  0.7909486  1.0000000 -0.44875912  0.6587479
## drat  0.6811719 -0.6999381 -0.7102139 -0.4487591  1.00000000 -0.7124406
## wt   -0.8676594  0.7824958  0.8879799  0.6587479 -0.71244065  1.0000000
## qsec  0.4186840 -0.5912421 -0.4336979 -0.7082234  0.09120476 -0.1747159
## vs    0.6640389 -0.8108118 -0.7104159 -0.7230967  0.44027846 -0.5549157
## am    0.5998324 -0.5226070 -0.5912270 -0.2432043  0.71271113 -0.6924953
## gear  0.4802848 -0.4926866 -0.5555692 -0.1257043  0.69961013 -0.5832870
## carb -0.5509251  0.5269883  0.3949769  0.7498125 -0.09078980  0.4276059
##             qsec         vs          am       gear        carb
## mpg   0.41868403  0.6640389  0.59983243  0.4802848 -0.55092507
## cyl  -0.59124207 -0.8108118 -0.52260705 -0.4926866  0.52698829
## disp -0.43369788 -0.7104159 -0.59122704 -0.5555692  0.39497686
## hp   -0.70822339 -0.7230967 -0.24320426 -0.1257043  0.74981247
## drat  0.09120476  0.4402785  0.71271113  0.6996101 -0.09078980
## wt   -0.17471588 -0.5549157 -0.69249526 -0.5832870  0.42760594
## qsec  1.00000000  0.7445354 -0.22986086 -0.2126822 -0.65624923
## vs    0.74453544  1.0000000  0.16834512  0.2060233 -0.56960714
## am   -0.22986086  0.1683451  1.00000000  0.7940588  0.05753435
## gear -0.21268223  0.2060233  0.79405876  1.0000000  0.27407284
## carb -0.65624923 -0.5696071  0.05753435  0.2740728  1.00000000
##
## $corrPos
## xName yName x y corr
## 1 mpg mpg 1 11 1.00000000
## 2 mpg cyl 1 10 -0.85216196
## 3 mpg disp 1 9 -0.84755138
## 4 mpg hp 1 8 -0.77616837
## 5 mpg drat 1 7 0.68117191
## 6 mpg wt 1 6 -0.86765938
## 7 mpg qsec 1 5 0.41868403
## 8 mpg vs 1 4 0.66403892
## 9 mpg am 1 3 0.59983243
## 10 mpg gear 1 2 0.48028476
## 11 mpg carb 1 1 -0.55092507
## 12 cyl mpg 2 11 -0.85216196
## 13 cyl cyl 2 10 1.00000000
## 14 cyl disp 2 9 0.90203287
## 15 cyl hp 2 8 0.83244745
## 16 cyl drat 2 7 -0.69993811
## 17 cyl wt 2 6 0.78249579
## 18 cyl qsec 2 5 -0.59124207
## 19 cyl vs 2 4 -0.81081180
## 20 cyl am 2 3 -0.52260705
## 21 cyl gear 2 2 -0.49268660
## 22 cyl carb 2 1 0.52698829
## 23 disp mpg 3 11 -0.84755138
## 24 disp cyl 3 10 0.90203287
## 25 disp disp 3 9 1.00000000
## 26 disp hp 3 8 0.79094859
## 27 disp drat 3 7 -0.71021393
## 28 disp wt 3 6 0.88797992
## 29 disp qsec 3 5 -0.43369788
## 30 disp vs 3 4 -0.71041589
## 31 disp am 3 3 -0.59122704
## 32 disp gear 3 2 -0.55556920
## 33 disp carb 3 1 0.39497686
## 34 hp mpg 4 11 -0.77616837
## 35 hp cyl 4 10 0.83244745
## 36 hp disp 4 9 0.79094859
## 37 hp hp 4 8 1.00000000
## 38 hp drat 4 7 -0.44875912
## 39 hp wt 4 6 0.65874789
## 40 hp qsec 4 5 -0.70822339
## 41 hp vs 4 4 -0.72309674
## 42 hp am 4 3 -0.24320426
## 43 hp gear 4 2 -0.12570426
## 44 hp carb 4 1 0.74981247
## 45 drat mpg 5 11 0.68117191
## 46 drat cyl 5 10 -0.69993811
## 47 drat disp 5 9 -0.71021393
## 48 drat hp 5 8 -0.44875912
## 49 drat drat 5 7 1.00000000
## 50 drat wt 5 6 -0.71244065
## 51 drat qsec 5 5 0.09120476
## 52 drat vs 5 4 0.44027846
## 53 drat am 5 3 0.71271113
## 54 drat gear 5 2 0.69961013
## 55 drat carb 5 1 -0.09078980
## 56 wt mpg 6 11 -0.86765938
## 57 wt cyl 6 10 0.78249579
## 58 wt disp 6 9 0.88797992
## 59 wt hp 6 8 0.65874789
## 60 wt drat 6 7 -0.71244065
## 61 wt wt 6 6 1.00000000
## 62 wt qsec 6 5 -0.17471588
## 63 wt vs 6 4 -0.55491568
## 64 wt am 6 3 -0.69249526
## 65 wt gear 6 2 -0.58328700
## 66 wt carb 6 1 0.42760594
## 67 qsec mpg 7 11 0.41868403
## 68 qsec cyl 7 10 -0.59124207
## 69 qsec disp 7 9 -0.43369788
## 70 qsec hp 7 8 -0.70822339
## 71 qsec drat 7 7 0.09120476
## 72 qsec wt 7 6 -0.17471588
## 73 qsec qsec 7 5 1.00000000
## 74 qsec vs 7 4 0.74453544
## 75 qsec am 7 3 -0.22986086
## 76 qsec gear 7 2 -0.21268223
## 77 qsec carb 7 1 -0.65624923
## 78 vs mpg 8 11 0.66403892
## 79 vs cyl 8 10 -0.81081180
## 80 vs disp 8 9 -0.71041589
## 81 vs hp 8 8 -0.72309674
## 82 vs drat 8 7 0.44027846
## 83 vs wt 8 6 -0.55491568
## 84 vs qsec 8 5 0.74453544
## 85 vs vs 8 4 1.00000000
## 86 vs am 8 3 0.16834512
## 87 vs gear 8 2 0.20602335
## 88 vs carb 8 1 -0.56960714
## 89 am mpg 9 11 0.59983243
## 90 am cyl 9 10 -0.52260705
## 91 am disp 9 9 -0.59122704
## 92 am hp 9 8 -0.24320426
## 93 am drat 9 7 0.71271113
## 94 am wt 9 6 -0.69249526
## 95 am qsec 9 5 -0.22986086
## 96 am vs 9 4 0.16834512
## 97 am am 9 3 1.00000000
## 98 am gear 9 2 0.79405876
## 99 am carb 9 1 0.05753435
## 100 gear mpg 10 11 0.48028476
## 101 gear cyl 10 10 -0.49268660
## 102 gear disp 10 9 -0.55556920
## 103 gear hp 10 8 -0.12570426
## 104 gear drat 10 7 0.69961013
## 105 gear wt 10 6 -0.58328700
## 106 gear qsec 10 5 -0.21268223
## 107 gear vs 10 4 0.20602335
## 108 gear am 10 3 0.79405876
## 109 gear gear 10 2 1.00000000
## 110 gear carb 10 1 0.27407284
## 111 carb mpg 11 11 -0.55092507
## 112 carb cyl 11 10 0.52698829
## 113 carb disp 11 9 0.39497686
## 114 carb hp 11 8 0.74981247
## 115 carb drat 11 7 -0.09078980
## 116 carb wt 11 6 0.42760594
## 117 carb qsec 11 5 -0.65624923
## 118 carb vs 11 4 -0.56960714
## 119 carb am 11 3 0.05753435
## 120 carb gear 11 2 0.27407284
## 121 carb carb 11 1 1.00000000
##
## $arg
## $arg$type
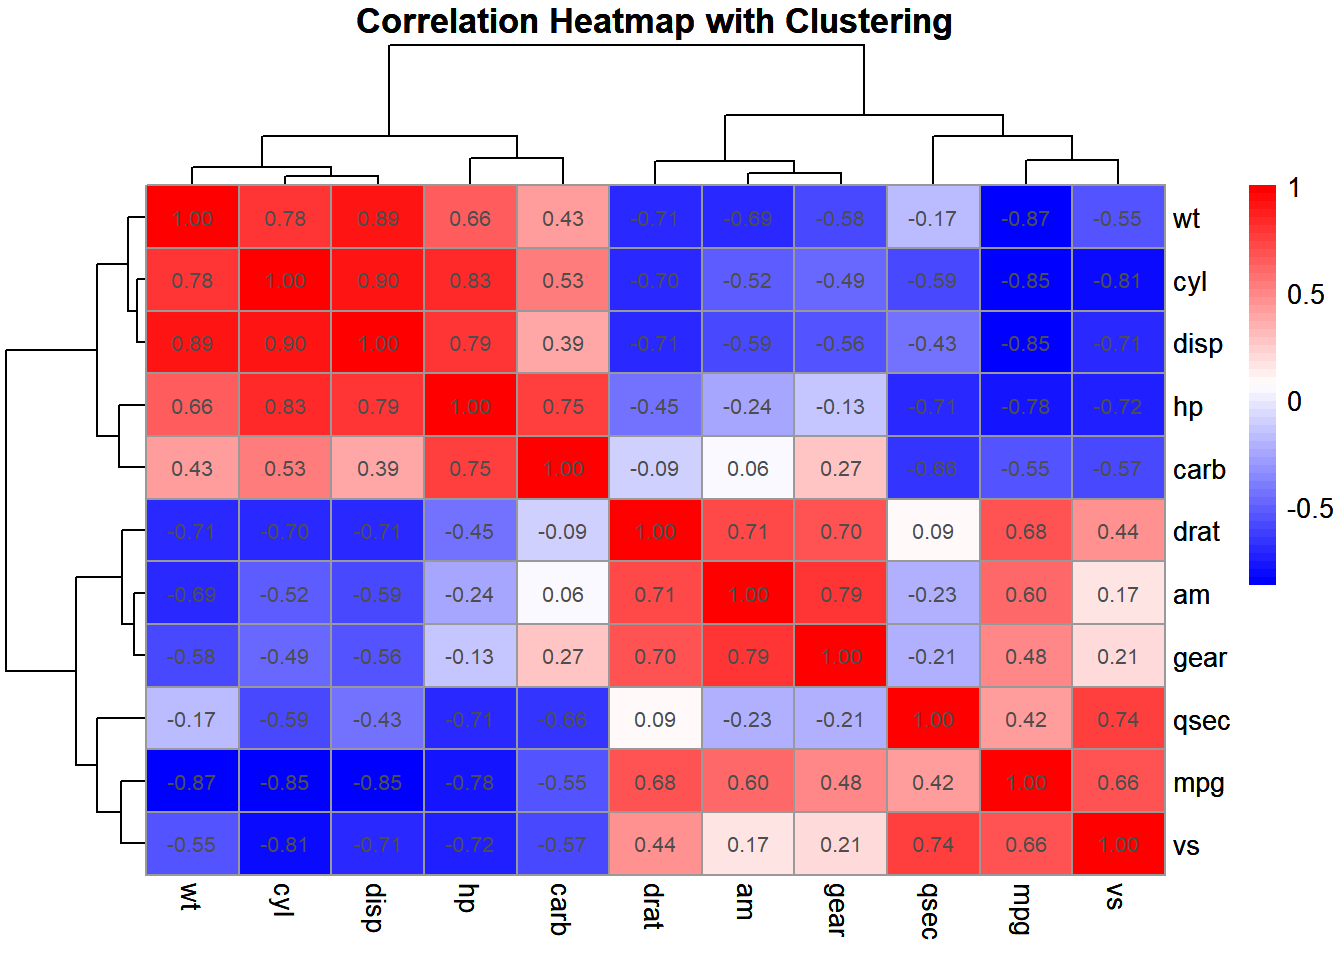
## [1] "full"Using the pheatmap package for clustering:
# Heatmap with hierarchical clustering
c2 <- pheatmap(cor_matrix,
         display_numbers = TRUE,
         color = colorRampPalette(c("blue", "white", "red"))(50),
         fontsize = 10,
         main = "Correlation Heatmap with Clustering")

c2
14.4.1 Interpreting the Results
Positive Correlations: Variables that increase together. For instance, in the
mtcarsdataset,disp(engine displacement) andwt(weight) may show a strong positive correlation.Negative Correlations: Variables that move inversely. For example,
mpg(miles per gallon) might have a negative correlation withwt.Clusters: Groups of variables that are highly correlated with each other. These clusters can reveal underlying relationships, such as similar chemical properties or sensory profiles in food science.
14.5 Summary
Correlation analysis and heatmap visualization are powerful tools for understanding complex datasets in food science. By identifying relationships between variables, researchers can derive actionable insights, optimize processes, and improve product quality.
Try applying these techniques to your own datasets, whether analyzing chemical compositions, sensory data, or production parameters, and unlock valuable patterns hidden in the data.