Chapter 4 Errors of nonobservation: Sampling and coverage
Fundamental to most research in the social and behavioral sciences is the idea of inference (see, for example, Groves et al. (2009, chap. 1); see also Figure 4.1). That is, researchers are usually not only interested in how the participants in their study behave or think but they want to generalize these behaviors and attitudes to a larger population (i.e., the target population), for example, all adults living in a county. Ideally, a study would collect WAS data from a sample of people that reflects that target population well, with full participation from each person approached to participate in the study.
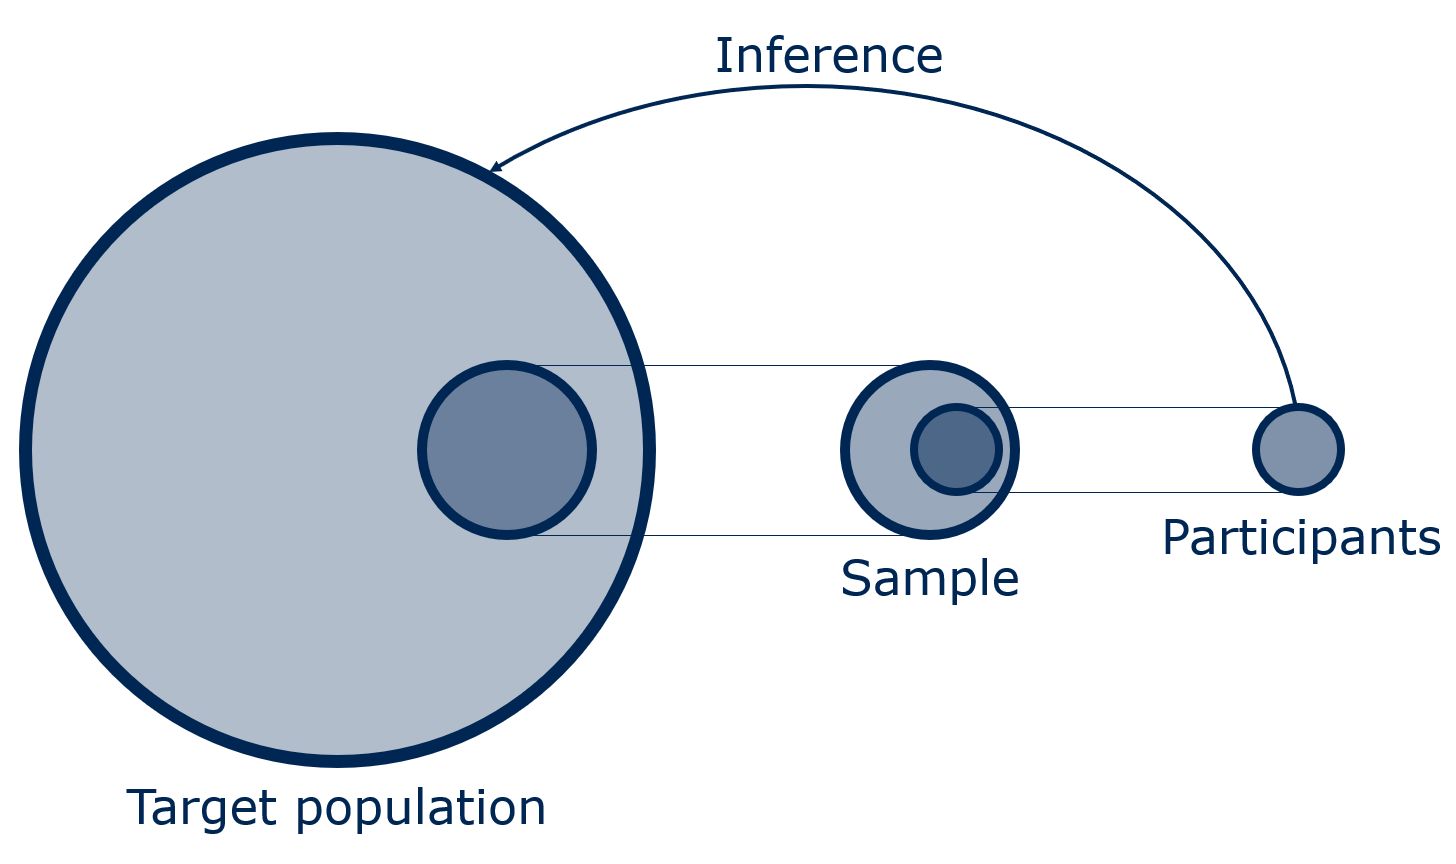
Figure 4.1: Inference from participants in a study to the target population
Of course, in the real world, nearly all studies, not only those using WAS, fall short of this ideal. For example, consider a public health researcher who aims at estimating what proportion of the adult residents in a specific county are engaging in the recommended amount of physical activity. To recruit participants, they post a message on the county’s Facebook page looking for volunteers who already own a fitness tracker. Only people who are on Facebook who follow the county’s posts and have a fitness tracker would be able to participate in the study. And only some of those who notice the post would be willing to let the study continuously track their physical activity. Each step in this recruitment process (being on Facebook, seeing the post, having a fitness tracker, being willing and able to sign up to the study, consenting to share tracking data over a longer period of time) can introduce selection bias if study participants have different activity patterns than other members of the target population of all adults living in the county. For example, people who already own a fitness tracker may be more physically active than other members of the community.
This and the next chapter will discuss what factors play a role in who is included in WAS studies and how the decisions made by the researcher in designing the recruitment for the study and the people invited to participate affect the quality of the data and the conclusions we can draw from that data. Before we dive deeper into the issues of nonobservation in WAS studies, Section 4.1) will give a brief introduction to the Total Survey Error (TSE) framework, which we will use throughout the book as a guiding principle on how to think about data quality both from a representation and a measurement perspective. Section 4.2 then discusses coverage and the consequences for data quality when subpopulations are excluded from WAS studies. Section 4.3 introduces methods of selecting samples for WAS studies, focusing on probability and nonprobability sampling techniques. Readers familiar with the TSE framework may decide to skip Section 4.1 and focus on the sections where we discuss the specific WAS study related issues of coverage (4.2.2) and sampling (4.3.1.2 and 4.3.2.2). Chapter 5 covers nonparticipation, that is, what happens when some people can participate but choose not to. And Chapter 6 will then move on to discuss errors of observation when measuring certain constructs with WAS.
4.1 Thinking about data quality using the TSE framework
As a guiding principle for our discussion on data quality in this book, we will use the Total Survey Error framework or TSE (Groves and Lyberg 2010). This framework allows us to think about how a statistical product, such as a mean or a proportion, is generated from a survey and as an extension from any other primary data collection. Figure 4.2 shows a typical depiction of the survey life cycle that illustrates the procedural steps that are necessary to produce such a statistic but also the error sources that can interfere with inference related to representation (i.e., From whom do the data come from?; the focus of Chapters 4 and 5) and measurement (i.e., How is a phenomenon measured?; the focus of Chapter 6). These two concepts are closely related to what is known as external and internal validity in other strands of the methods literature (Shadish, Cook, and Campbell (2002)). The right side of Figure 4.2 uses squares to denote steps in the survey process related to representation. We start with the target population, which is the group of people we want to understand with our study. We develop a sampling frame, which is a list of members of the target population. We select a sample from the frame and then approach the selected cases to participate in the study. At each step, errors can creep in. Errors are shown in Figure 4.2 as circles on the outside pointing to lines between the steps. We discuss these errors in more depth below. The left side shows steps related to measurement and the errors that can creep in at each step in the process of measuring the construct we are interested in; we discuss this side of the figure in Chapter 6.
![Survey life cycle from a quality perspective [@groves_total_2010,p.48]](images/Figure%204.2.jpg)
Figure 4.2: Survey life cycle from a quality perspective (Groves and Lyberg 2010, 48)
Error in this framework is defined as “the deviation of a survey response from its underlying true value. [TSE] refers to the accumulation of all errors that may arise in the design, collection, processing, and analysis of survey data” (Biemer 2010, 817). In this context, error does not necessarily mean that someone made a mistake; it can also reflect uncertainty (or lack of confidence) in the inference from a statistic that is produced by a study (e.g., the average amount of physical activity estimated based on volunteers) to the true value in a population (e.g., the average amount of physical activity in the population of all adults in the county) given the study design. Note that errors always pertain to a single statistic (e.g., the mean or percentage of a specific variable that you are interested in) and not the entire study.
Errors come in two flavors (see also Box 4.1): bias is error that systematically over- or underestimates certain phenomena while variance describes a random variability in a measure (Groves and Lyberg 2010, 55ff). In our example study, bias would occur if the participating volunteers were more physically active than the target population of all adults which would lead to an overestimation of the share of people who reach a certain level of physical activity. Variance would occur, for example, if the realized sample in the study yields different, yet random, results every time it would be repeated. The sources of errors can be diverse, including but not limited to the frame from which the sample for a study is drawn, the specific data collection method used by a researcher, the wording of survey questions, how much data are missing, the way the data are processed during and after data collection, and many more.
Since the introduction of the original TSE framework, several researchers have adapted it for other types of data. Examples include the Total Error Framework for Big Data (TEF) (Amaya, Biemer, and Kinyon 2020), the Total Error Framework for Digital Traces of Human Behavior on Online Platforms (TED-On) (Sen et al. 2021), the Total Error Framework for Digital Traces Collected with Meters (TEM) (Bosch and Revilla 2022), and the Total Error for Social Scientific Data Collection with Data Download Packages (Boeschoten et al. 2022). While these frameworks vary in the specific error components they include, each relies on the two broad categories of measurement and representation.
BOX 4.1. Mean square error (MSE)
The statistical notion of error in the TSE framework can be expressed as the mean squared error (MSE), which is the expected squared difference between an estimator \(\hat{\theta}\) and the population parameter \(\theta\) that it intends to estimate (Biemer 2010, 826):
\[\begin{equation} MSE(\hat{\theta}) = E(\hat{\theta}-\theta)^2 \tag{4.1} \end{equation}\]
Decomposing error into squared bias and variance, Equation (4.2) shows that an estimator \(\hat{\theta}\) will be accurate if it has both a small bias \(B\) and a small variance \(Var\) (Biemer 2010, 826):
\[\begin{equation} MSE(\hat{\theta}) = B^2(\hat{\theta})+Var(\hat{\theta}) \tag{4.2} \end{equation}\]
MSE relies on the idea of the theoretical repetition of the same data collection process. Even though we conduct a given study just one time, we can imagine what would happen if we conducted it more than once. Bias refers to errors that are always the same each time we conduct the study and relates to the accuracy of an estimate. Variance captures errors that vary over (hypothetical) repetitions of the data collection process and tells us something about the precision of an estimate. Usually on the representation side of Figure 4.1 we are primarily concerned with bias: for example, the people left out of the sampling frame or the characteristics of those who do not participate. However, the representation side is also affected by variance: for example, when we select a sample of cases, the sample we get is different in each study, which leads to variability in our estimates. This variability is captured by the standard error, confidence interval, or margin of error (Groves and Lyberg 2010, 56ff) – each of which is related to the variance term in Equation (4.2).
In practice, we rarely calculate the MSE. However, using the TSE framework and Equation (4.2) allows researchers to do two things (Biemer 2010). First, we can design each component of our study to minimize errors inherent to that component, for example, by thinking about the best way to measure a behavior of interest such as physical activity (e.g., using an accelerometer vs. letting people self-report). We assess the error associated with all alternative procedures and choose a combination of approaches with the overall smallest error, while also taking cost into account. TSE should thus always be an explicit part of study design decisions. Second, we can use our knowledge about errors to assess the quality of data after they were collected. As users of secondary data, it is important to know how the data were generated. This knowledge helps us understand what errors might be present and judge the quality of the data.
4.2 Coverage of the target population
The target population of a study is the set of people that the researcher wants to understand with their study (Groves and Lyberg 2010, 69). In our example public health study, the target population is the adult residents of this county at a given point in time. In another case, a sociologist may wish to understand how access to resources, such as a car, influences whether and how fast men recently released from prison find a job; here the target population would be all men recently released from prison.
A related concept is the covered population: the set of all individuals who, at least in theory, have a chance to be selected into the sample of a study. The covered population may differ from the target population in two ways (Groves and Lyberg 2010, chap. 3.3). If there are some members of the target population who cannot end up in the sample, for some reason, then they are undercovered. If there are some members of the covered population who could be selected into the study, although they are actually not part of the target population, then they are overcovered. Figure 4.3 shows the relationship between the target population, the covered population, and their intersection, the study population.
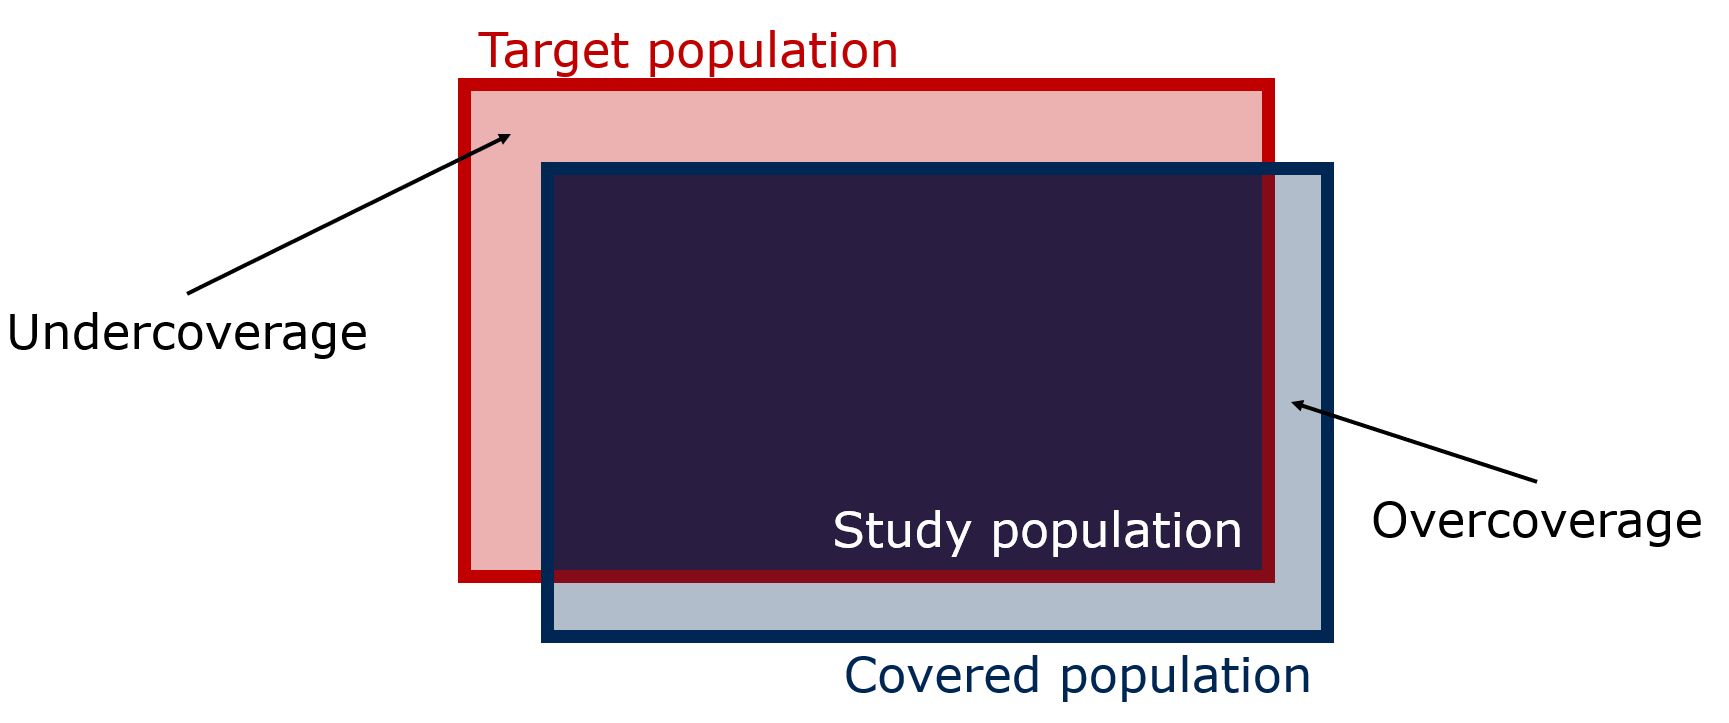
Figure 4.3: Target population, covered population, and study population
To better understand the coverage issue, let’s reconsider the example of the public health researcher who wants to estimate the share of the residents in a county who meet the physical activity standard. They recruit participants who own a fitness tracker using posts on the county’s Facebook page. Only residents of the county who use Facebook can see the message and only those who own a tracker will be able to take part in the study. Those who are not on Facebook and Facebook users who do not own the necessary device are excluded from participation and thus undercovered1. At the same time, Facebook users who are not county residents may see the post and may be able to take part in the study, which constitutes overcoverage.
This example illustrates that coverage relates to both how researchers reach out to the target population and whether the members of the target population have the technology to participate in the study. Concerning the former, ideally a researcher has access to a high-quality sampling frame (Groves and Lyberg 2010, 70). The sampling frame is a list that includes all members of the target population once and only once with up-to-date contact information for each individual (e.g., names, home addresses, e-mail addresses, telephone numbers, etc.). A well-maintained sampling frame exists and is accessible only in rare cases and only for some populations, such as students at a university, employees of a company, members of a professional organization. However, in other cases, the list might be outdated, or it might be proprietary (e.g., members of a social media platform) and thus not accessible to researchers. And sometimes, a dedicated list just does not exist at all. The researchers will then have to find other ways to access and recruit members of the target population to their study (see below the discussion on nonprobability samples in Chapter 4.3.2).
The second issue related to coverage in WAS studies is whether everybody in the target population has access to the technology that is used for data collection. In our example above, the researcher, maybe for cost reasons, made it a requirement that study participants all need to use their own devices (we introduced the term “bring your own device” or BYOD earlier in Chapter 3). People who do not have such a device are thus undercovered and excluded from participating in the study.
4.2.1 Coverage bias2
Coverage bias arises when the members of the target population (the red portion in Figure 4.3) have different characteristics relevant for the outcomes of the study than those who are covered (the blue portion in Figure 4.3; see also Groves and Lyberg (2010, 55)). Continuing the example from above, those who already have a fitness tracker may be more physically active on average than the general adult population of the county, which would cause the study to overestimate the percentage of all county residents who meet the physical activity standards.
While both under- and overcoverage can cause bias, we generally worry more about undercoverage than overcoverage. Overcoverage can often be corrected by screening out individuals who are not part of the target population (leading to the study population, the dark blue portion in Figure 4.3). In the above example, people who live outside of the target county are not eligible for the study. Thus, they would include a question about where people interested in the study live as part of the recruitment interview. Those who live outside the county would be informed that they are not eligible for the study. If the researcher forgets to screen or is unable to do so, the study is at risk of overcoverage bias, if the residents from other counties have different activity patterns compared to those from the target county.
Coverage bias for a mean is the difference between the mean of the entire target population \(\overline{Y}\) and the mean of the covered population \(\overline{Y}_{C}\). Bias due to undercoverage is a function of two factors: first, how large the undercovered population \(U\) is compared to the entire target population \(N\) and, second, how much the covered population differs in the variable of interest \(\overline{Y}_{C}\) from the undercovered population \(\overline{Y}_{U}\) (Groves et al. 2009:55):
\[\begin{equation} \overline{Y}_{C} - \overline{Y} = \frac{U}{N}(\overline{Y}_{C} - \overline{Y}_{U}) \tag{4.3} \end{equation}\]
To further illustrate this relationship, let’s consider two extreme but not unlikely cases. First, the covered population might only make up a very small part of the total target population. This could be the case in our example with the Facebook users who can see an ad for the study on the page of the county they live in and already have a fitness tracker. Probably only a very small portion of all the adults living in any given county would be covered in such a study design. If, however, the difference between the covered and the noncovered population in physical activity is small, then information from even that relatively small group of people would provide a good estimate for the entire county (of course, assuming that there are no other errors from nonparticipation – see Chapter 5 – and measurement – see Chapter 6). Second, consider an example where researchers achieve very high coverage, for example, by using an expensive, high quality sampling frame (e.g., an address list of dwellings in a county) and by providing devices to everybody. Such a design might provide good coverage of the target population (i.e., the undercoverage rate \((\frac{U}{N})\) of adults living in the county is small). However, if there is a really large difference in physical activity between the covered and the noncovered \((\overline{Y}_{C} - \overline{Y}_{U})\), then undercovering just a small portion of the target population would yield substantial bias.
4.2.2 Evidence of coverage error in WAS studies
Assessing the severity of coverage error for a given study is not trivial. To study coverage error, one needs auxiliary information on how many people are covered and undercovered (by a sampling frame and by a technology) and on the variable of interest for both the covered and the noncovered population (see Equation (4.3))3. Even in situations where we know \(U\) and \(N\), we usually do not know anything about the undercovered cases, because measuring the variable of interest is the primary goal of a study. In these situations, we rely on proxy measures of coverage bias. One method uses the undercoverage rate \((\frac{U}{N})\) as an estimate. Another method uses other information about the covered and undercovered population. For example, to understand coverage bias in the physical activity study we might compare the sociodemographic characteristics of those who use Facebook and have fitness tracker devices with those who do not. If the two groups differ in income, race, and age, and these variables correlate with physical activity, then we worry that coverage error is a problem in the study. Although these types of analyses are based on assumptions, they are often the best we can do. We will start with looking at differences between owners and nonowners of smartphones and then move on to discuss ownership differences in other devices that might be used in WAS studies.
4.2.2.1 Differences in smartphone ownership
To assess the potential undercoverage rate in WAS studies that require participants to bring their own smartphones, we can look at smartphone ownership in the general population. We have seen a worldwide proliferation of smartphone ownership over the past couple of years. A helpful resource here comes from the Pew Research Center that regularly surveys people in many countries around the globe on their technology use and, among others, smartphone ownership. In 2023, 90 percent of U.S. adults reported owning a smartphone, compared to only 35 percent in 2011 (Center 2024). Eurostat (2023) reports that in 2011, 19 percent of adults living in the EU used a smartphone (or another mobile phone) to access the Internet. In 2019, this proportion increased to almost 73 percent. Mobile Internet access varies considerably by country in the EU, ranging from 49 percent in Italy to 92 percent in Sweden in 2019. Figure 4.4 shows that the median smartphone ownership rate among 18 countries in North America, Western Europe, and East Asia was at 85 percent in 2022 (Wike et al. 2022). While smartphone ownership rates are still lower in emerging economies, they also rapidly increase in these countries (Silver 2019). Smartphone penetration levels in Africa tend to be lower compared to other parts of the world but there is also considerable variability between countries ranging from 22 percent in Uganda to 80 percent in Mauritius in 2023 (Afrobarometer 2023).
![Smartphone ownership across 18 selected countries in 2021/2022 [@wike_social_2022]](images/Figure%204.4.jpg)
Figure 4.4: Smartphone ownership across 18 selected countries in 2021/2022 (Wike et al. 2022)
As discussed earlier (4.2.1), coverage bias has two components, and the high rates of smartphone ownership might hide the fact that those who do own a smartphone can be quite different from those who do not. For example, a consistent finding across countries is that the likelihood to own a smartphone is higher for younger people, those with higher educational attainment, and higher income. In 2023, 97 percent of people in the U.S. aged 18 to 49 years owned a smartphone while the share of smartphone owners was 89 and 76 percent for people aged 50 to 64 and 65 and older, respectively. U.S. adults with a high school degree were less likely (83 percent) to own a smartphone compared to people with some college experience (92 percent) and those with a college degree (97 percent). Similarly, smartphone ownership increases with household income (Less than $30k: 90 percent; $30k-$74,999: 94 percent; $75k and more: 98 percent) (Center 2024). Keusch et al. (2023) found comparable results for Germany. In 2017, smartphone ownership sharply dropped after age 55 and with lower education. In addition, smartphone ownership in Germany differed by gender (male: 79 percent vs. female: 73 percent), region, and degree of urbanicity.
Keusch et al. (2023) also analyzed differences in smartphone ownership based on the operating system (OS) of the device. This point is relevant for researchers who have to decide whether to implement their research protocol on multiple OS (e.g., Android and iOS) which increases costs. In Germany, almost two-thirds of smartphones operated on the Android platform in 2017 and less than 15 percent ran on iOS. Android users in 2017 had similar characteristics to the population of all smartphone owners and to the general adult population. However, limiting a study in Germany just to users of Apple iPhones would undercover adults over the age of 25, those with lower formal education, and those who live outside of large cities. While the market share of different OS differs by country and region, iPhone owners usually have larger monthly budgets compared to Android smartphone owners (Götz, Stieger, and Reips 2017; Schmall 2018; Yarow 2013). In contrast, Android smartphone owners are more likely to look for deals and discounts (Schmall 2018). These findings are consistent with the price difference between Android smartphones and iPhones.
If a researcher has access to population information on sociodemographics such as age, gender, education, income, and urbanicity, standard weighting procedures could adjust for these differences between the covered and uncovered members of a population (Valliant, Dever, and Kreuter 2018). However, many unobserved behavioral and attitudinal variables that might be of particular interest to the researchers may not be accounted for by weighting of sociodemographics. Few studies have analyzed the effects of smartphone ownership on such substantive measures, and the findings of these studies are not always consistent. For example, Antoun et al. (2019) found that smartphone owners in the Netherlands are more likely to prefer using a tablet to go online and to eat out in restaurants more often compared to those who do not own a smartphone, even after controlling for differences in sociodemographics between owners and nonowners of smartphones. Using data from the U.S. National Survey of Family Growth (NSFG) of people aged 15 to 44, Couper et al. (2018) found very few differences in measures on divorce, cohabitation, and various dimensions of fertility behaviors after controlling for sociodemographics between smartphone owners and nonowners. For attitudinal questions, the bias introduced by smartphone coverage never exceeded 2.5 percentage points. For Germany, Keusch et al. (2023) reported differences in estimates of general life satisfaction, satisfaction with health, housing, and living standards, personal network size, and self-efficacy between smartphone owners and nonowners, but these differences could be reduced by weighting for sociodemographic differences. However, large coverage bias was found based on iPhone ownership that could not be reduced through sociodemographic weighting: people who own an iPhone reported having significantly and substantially higher general life satisfaction, higher satisfaction with their living standards, and higher sense of social inclusion.
4.2.2.2 Differences in ownership of smartwatches, fitness trackers, and other wearable devices
While smartphones are already a very well-established mobile technology globally, smartwatches, fitness trackers, and other wearable devices still tend to be niche products in many countries. Estimates on how large the market penetration of different product categories and individual products are usually stem from (unofficial) business reports and should thus be treated with caution. For example, Counterpoint (2023) estimates the global smartwatch shipments for Q2 of 2023 to be 35 million, with Apple watches making up about 22 percent as the largest brand (see Figure 4.5). According to Curry (2023), Fitbit sold 9.2 million units in 2022 globally, and 37 million people use Fitbit once a week.
![Global smartwatch shipments market share Q2 2022 through Q2 2023 [@team_counterpoint_global_2023]](images/Figure%204.5.jpg)
Figure 4.5: Global smartwatch shipments market share Q2 2022 through Q2 2023 (Counterpoint 2023)
Information on device ownership and use at the country level usually come from self-reported data, and again numbers vary widely by survey. According to Kantar, around 17 percent of Australians and 15 percent of U.S. Americans had a smartwatch in 2021 while the penetration seems to be lower in Europe (Chan (2021); see also Table 4.1). Pew Research survey data suggests that in 2019, 21 percent of U.S. adults reported regularly wearing a smartwatch or wearable fitness tracker (Vogels 2020).
| Country | Q3 2019 | Q3 2020 | Q3 2021 |
|---|---|---|---|
| USA | 10.3% | 11.6% | 15.0% |
| France | 5.6% | 7.6% | 10.2% |
| Germany | 8.4% | 8.7% | 11.3% |
| Great Britain | 9.0% | 11.3% | 14.1% |
| Italy | 9.0% | 10.8% | 14.3% |
| Australia | 11.1% | 13.7% | 16.9 |
| Japan | 3.0% | 3.3% | 4.2% |
The Pew Research data are also the only large-scale survey that we are aware of that breaks down smartwatch and fitness tracker ownership by subgroups. As shown in Figure 4.6, U.S. women are more likely to report owning these devices than men, Hispanics more likely than Blacks and Whites, and people under the age of 50 more likely than those 50 and older. Ownership of these devices is also strongly positively correlated with educational attainment and income (Vogels 2020). Clearly, owners of smartwatches and fitness trackers make up a relatively small group within the general population. Estimates from studies that collect data only from people who already own these devices likely have high coverage bias. While no data on other covariates of ownership are available, it is very likely that the sociodemographic differences between owners and nonowners extend to many of the outcomes researchers seek to measure with these devices in a WAS study, such as physical activity and health outcomes and behaviors. Thus, we strongly recommend not to solely rely on people who already have their own devices to participate in WAS studies but to equip all participants with a device for the purpose of the study.
![Percent of U.S. adults reporting regular use of smartwatches and fitness trackers in 2019 [@vogels_about_2020]](images/Figure%204.6.jpg)
Figure 4.6: Percent of U.S. adults reporting regular use of smartwatches and fitness trackers in 2019 (Vogels 2020)
4.3 Sampling for a WAS study
Once we have considered coverage, we need to decide whether to conduct a census – the “systematic effort to count an entire population” (Groves and Lyberg 2010, 3) – or to recruit a sample from the population. In practice, conducting a census only makes sense if the target population is relatively small and easy to reach (e.g., members of a professional society where we have a complete list of email addresses) or if there is a constitutional requirement to do so (e.g., the Decennial Census of Population and Housing in the U.S.). In most studies, including those that use WAS for data collection, one will very likely not conduct a census but recruit a sample. An important choice when using a sample is whether any eligible person can volunteer to participate (i.e., nonprobability sampling) or only those who are selected by a random mechanism are invited to participate (i.e., probability sampling).
4.3.1 Probability sampling
In studies using a probability sample, only those who are randomly selected from the population – more precisely, from a sampling frame (see Chapter 4.2 above) – are invited to participate. The key feature of probability sampling is that every element of the population has a known, non-zero chance of randomly being selected into the sample (Kalton 1983; Kish 1965). The theoretical underpinning of probability sampling provides researchers with multiple advantages. A probability sample is the basis for calculating unbiased population estimates, that is, it allows researchers to generalize the results from the sample to the target population (i.e., design-based statistical inference; see Elliott and Valliant (2017)). A probability sample also lets researchers calculate sampling error; the variability introduced into estimates because we observe only a portion of the population. Because we would get a different sample if we repeated the study, this type of error is variance rather than bias. Sampling variance allows us to assess the precision of a population estimator that comes from one sample realization. Note that this type of error is deliberately introduced into studies by design in an effort to save money and increase feasibility when deciding to draw a probability sample instead of conducting a census. The size of the sampling error is influenced by the size of the sample and what probability sampling method is used.
The downside to using a probability sample is that they are usually (much) more expensive than nonprobability samples. Additional funds are needed for creating a sampling frame, contacting the selected persons (or households), and convincing them to take part. To increase participation rates, studies usually must make multiple contact attempts, further increasing costs. Given limited resources, probability-based studies might involve smaller samples than studies that rely on volunteers, due to the higher cost of recruiting each participant. And, of course, probability sampling does not solve the problem of nonparticipation. The statistical theory on how to project the results from the sample to the target population is based on probability samples with 100 percent participation from all selected cases. When the participation rate is less than 100 percent, as it usually is, bias can arise, even if we started with a probability sample (more on participation in Chapter 5). However, probability-based samples generally deliver more accurate results compared to nonprobability samples (see Box 4.2).
4.3.1.1 Probability sampling techniques
Probability samples can be drawn in many different ways (see Blair and Blair (2014) and Groves et al. (2009, chap. 4) for introductions to the different approaches). We will use the example of a large company with \(N=5,000\) employees that wants to select a probability sample of \(n=100\) employees for a study to illustrate the different ways of drawing a probability sample. The goal of the study is to understand how time spent on different tasks at work is related to job satisfaction. The study uses a smartphone app which tracks activities, location, and sends short surveys at multiple random points in time during the workday over the course of one week (something called an EMA or ESM, see Chapter XX). The firm could start with a list of all employees (the sampling frame), likely from the Human Resources department. Using the most basic form of probability sampling, the firm would draw a simple random sample of \(n=100\), for example, by assigning each employee a random number (perhaps using random.org) and then sorting the list by that random number. The first 100 names on the list sorted by the random number would be selected into the sample.
Another option would be to order the list of employees by last name, and then draw every 50-th name from the list (starting with a random name among the first 50 entries on that list). Such a sample is called a systematic sample, because it systematically draws every \(k\)-th entry from a list to create a sample of the required size, where \(k = \frac{N}{n}\).
To ensure that the sample is diverse, we could use stratified sampling. Strata are subpopulations that are homogeneous with respect to prespecified variables. In our example, they might be the departments of the firm; other stratification variables could be gender, employment type, or any other characteristic that is known in advance about all elements of the population. From each stratum an independent sample would then be drawn, for example, using a simple random or systematic sampling approach. Stratified sampling guarantees that individuals from all strata (also the small ones, such as departments with just a few employees) are included in the sample. If the variables used to form that strata are related to the variable of interest, estimates from stratified samples can have substantially lower sampling variance than those from simple random samples, depending on how the sample is allocated across the strata.
Finally, probability samples are sometimes also drawn not on the individual level (here, the employee) but on a group level. This approach is called cluster sampling, where the clusters are groupings of the elements of the target population. Sometimes, clusters are easier to access than the individuals, thus saving resources. At the same time, clustering reduces the amount of information that an individual in the sample contributes, thus reducing precision of estimates (i.e., increasing sampling variance). In our example, clusters could be the different branches of the firm. Instead of needing an up-to-date list of all employees in the entire company, one would require just a list of branches in a first step. Then all employees in the selected branches or a random sample of them are invited for the study.
A special case of the cluster sampling approach is used when the target population is hard-to-reach (i.e., difficult to sample because individuals with that characteristic are rare and/or no specific sampling frame exists for them) but their members tend to attend certain locations. With location sampling (sometimes also referred to as venue sampling or intercept sampling; see Kalton (2014)), researchers identify the locations frequented by the members of the target population (e.g., air- and seaports for international travelers, specialized clinics for people with a rare disease) and select a sample of the location-time pairs.Interviewers then visit each selected location during the selected time period and interview visitors. To draw a proper probability sample with this approach, one needs to cover the entire range of locations where the target population might be reached and account for multiple visits to the locations by the same person during the data collection period. For example, in a study on mental health of homeless youth in a city, researchers might select a sample from a list of all known homeless shelters and other places where homeless teenagers might be in that city. At the selected locations, a sample of unique visitors during two weeks is then recruited and equipped with smartphones to complete EMA-style questionnaires and track their mobility patterns.
In practice, especially in large scale population studies, researchers often use complex multi-stage sampling designs which incorporate combinations of the probability sampling approaches discussed above (Saavedra 2008).
4.3.1.2 Examples of probability sampling in WAS studies
One example of a large-scale, population-based probability study using WAS data collection can be found as part of the UK Biobank. UK Biobank is a long-term cohort study of adults aged between 40 to 69 years at the time of their recruitment in 2006 to 2010 (see also https://www.ukbiobank.ac.uk/). Researchers used a registry from the National Health Service Primary Care Trusts as the sampling frame and mailed invitation letters to everybody in the target age range who lived within 40 km (25 miles) of one of 22 assessment centers in England, Wales, and Scotland (a total of 9.2 million individuals) to participate. While the sampling and recruitment approach raises concerns about undercoverage of those living more than 40km from an assessment center, more than 500,000 participants completed the baseline assessment (Allen et al. 2024; Fry et al. 2017). The study collected a wide range of data on phenotypic and genotypic information, using among others questionnaires, physical measures, sample assays, and multimodal imaging (Sudlow et al. 2015). In addition, between February 2013 and December 2015 out of all study participants who had provided a valid email address upon registration (except for the ones living in the North West region), more than 236,000 were randomly invited to wear a wrist-worn accelerometer (Axivity AX3) for seven days (Doherty et al. 2017).
Another example of a probability-based WAS study is TDS Underway in the Netherlands (ODiN), a smartphone-assisted travel diary study, conducted by Statistics Netherlands for the Dutch Ministry of Infrastructure in 2019 (McCool et al. 2021). The target population of this study was people 16 years and older living in non-institutionalized households in the Netherlands. The study aimed to test a travel diary app, available on Android and iOS, that used GPS for trip detection. To ensure high coverage of the Dutch population, half of the sample was drawn randomly from the Dutch population register. To control costs, the other half of the sample was recruited from a pool of people who had responded to earlier studies and thus were more likely to agree to download and use the travel diary app. In total, a sample of 1,902 people was invited via postal mail.
Several recent WAS studies piggybacked on large-scale longitudinal studies, reducing the cost of sampling and recruitment by building on existing probability-based survey infrastructure.
The IAB-SMART study (Kreuter et al. 2020) recruited a random sample of participants from the German panel study Labour Market and Social Security (PASS) to compare physical activity, mobility, and social interactions of individuals (among other variables) with different employment status using a smartphone app. PASS, an annual household panel survey of the German residential population, uses an address-based sample of the German general population and a welfare benefit recipients sample from national registers (Trappmann et al. 2019).
Several studies used smartphones and accelerometers for data collection about physical activity and mobility in the Longitudinal Internet Studies for the Social Sciences (LISS) Panel (A. Elevelt et al. 2021; Anne Elevelt, Lugtig, and Toepoel 2019; Scherpenzeel 2017). LISS is a probability-based online panel in the Netherlands that recruits participants using a stratified sample from the population register (Scherpenzeel 2011).
Similarly, the Understanding America Study (UAS), is a probability-based Internet panel of the U.S. adult population where addresses of potential participants are sampled from the U.S. Postal Service Delivery Sequence File (Alattar, Messel, and Rogofsky 2018). UAS has implemented studies using consumer- and researcher-grade activity trackers (Chaturvedi et al. 2023) as well as mobile wearable air quality monitors (Kapteyn, Saw, and Weerman 2023).
In the UK Understanding Society Innovation Panel, the use of receipt scanning with a smartphone app was tested as an alternative to traditional expenditure diary data collection (Jäckle et al. 2019; Wenz et al. 2023). The Innovation Panel, which is used as a methodological test bed for Understanding Society: The UK Household Longitudinal Study, uses a clustered and stratified sample of households in Great Britain (McFall and Buck 2013).
SHARE, the Survey of Health and Retirement in Europe is a panel study of the European population aged 50 and older in which participating countries select eligible participants from the best available frame; most participating countries have access to population registries (Börsch-Supan 2017). In SHARE Wave 8 in 2019 and 2020, panel members from 10 countries wore an accelerometer to measure the volume and intensity of their physical activity and sedentary behavior (Franzese et al. 2023).
The National Social Life, Health and Aging Project (NSHAP) is a longitudinal study of community-dwelling older adults in the U.S. between the ages of 55 and 85 in 2004. The goal of the project is to study the intersection between social and intimate relationships and healthy aging. NSHAP used a complex, multistage area probability sample and data are collected with in-person interviews and leave-behind survey booklets (Jaszczak et al. 2014; O’Muircheartaigh, Eckman, and Smith 2009). Wave 2 in 2010/11 included an additional activity and sleep component where a random third of all participants were invited to carry a wrist actigraph (Actiwatch) and complete a booklet on activity and sleep for three full days (Benson et al. 2021; Chen, Lauderdale, and Waite 2016; Lauderdale et al. 2014).
Several smaller WAS studies have selected probability samples of small and very specific target populations. For example, Sugie (2018) studied reintegration effort and success of men recently released from prison using a smartphone app that tracked geolocation and sent EMA-type surveys for three months in the Newark Smartphone Reentry Project (NSRP). To select study participants, NSRP randomly sampled from a frame of all male parolees recently released from prison to Newark, NJ, between 2012 and 2013. The Daily Experiences and Well-being Study used a probability sample of adults aged 65 and older living in the greater Austin Texas Metropolitan Statistical Area to study social interactions, loneliness, and physical activity (Fingerman et al. 2020, 2022; Huo et al. 2020). Recruitment for this study was done via a random sample of listed landline numbers with a deliberate oversampling in high-density minority neighborhoods and lower SES neighborhoods. After phone screening, interviewers visited participants’ homes for a face-to-face interview and to provide participants with a loaner Android device for EMA data collection as well as an accelerometer (Actical) to measure physical activity and sedentary behavior during a five- to six-day period.
4.3.2 Nonprobability sampling
In contrast to probability sampling, nonprobability sampling does not rely on a random mechanism for selecting study participants from a sampling frame. Either the researcher arbitrarily or purposefully decides who to approach for their study, usually selecting individuals who are easy to reach and known to be willing to participate in research, or it is up to volunteers to react to a general call for participation in a study (e.g., social media posts, flyers, radio ads) allowing self-selection into the sample (Vehovar, Toepoel, and Steinmetz 2016). With such samples, the probability of selection is not known and some members of the target population may have no chance to be selected (Kalton 1983). Nonprobability sampling methods are often easier to implement and less expensive than probability methods (e.g., they do not require a sampling frame), and researchers typically use them when practical and/or budgetary constraints make it difficult to employ probability sampling methods.
Selection bias is problematic in nonprobability samples if certain subgroups of the population are more likely to end up in the sample than others, and their overrepresentation leads to systematic deviations in substantive results (see also Box 4.2 for a summary of empirical evidence). Nonprobability sampling lacks the theoretical foundation that allows for design-based statistical inference from the sample to the population (Elliott and Valliant 2017). Without this theoretical foundation, researchers using nonprobability sampling-based methods have to make assumptions about how well the recruited sample reflects the population on the variables of interest and how well they can model any differences between the sample and the target population. Weights can adjust a sample to better match a population in the characteristics that are known. For example, if a sample contains proportionally more older people than the population, weights can help increase the contribution of the younger participants when making estimates about the population (see Valliant (2020) for different approaches to model-based inference). However, characteristics that are unknown in the population but potentially relevant for the outcome variables of interest (e.g., personality traits), weighting is not possible. Given the lack of theoretical and statistical rigor in nonprobability sampling, it is less preferred than probability sampling methods. Nevertheless, for some populations, probability sampling is not possible or is prohibitively expensive.
Since nonprobability sampling does not rely on a sampling frame, the issues of undercoverage and nonprobability sampling are closely related yet theoretically distinct issues. For example, a researcher might decide to recruit study participants via Facebook, thus running the risk of undercoverage by excluding anyone who does not use Facebook (see Section 4.2). In such a case, one could still draw a probability sample by pushing invitation messages to the news feeds of a random sample of all active Facebook users (see, for example, Salomon et al. (2021)). However, more often recruitment posts are posted by specific accounts and only people who follow these accounts can see the ad and volunteer to participate in the study. In these situations, both undercoverage and nonprobability recruitment are of concern.
BOX 4.2. Accuracy of results from probability vs. nonprobability samples
Why do some studies go to the additional expense of selecting a probability sample when they could potentially recruit more cases at lower cost with a nonprobability sample of volunteers? There is a large literature on the pros and cons of each approach, and we do not have the space to summarize it all (see Cornesse et al. (2020) for an in-depth discussion of conceptual approaches and empirical evidence in this area). Three conditions are needed to efficiently estimate population characteristics with data from a sample (Mercer et al. 2017): (1) the sampled units are exchangeable with units not in the sample sharing the same measured characteristics (exchangeability), (2) the sample includes all segments of the population, with no systematic exclusion of any group (positivity), and (3) the sample distribution matches the target population with respect to the observed characteristics or can be adjusted to match (composition). These assumptions are satisfied for studies using probability sampling with a 100 percent participation rate. Researchers who favor probability samples worry that at least one of the necessary conditions is violated in nonprobability studies.
Of course, no study achieves 100 percent coverage and participation rates, and bias is a risk for all samples. A number of studies demonstrate that probability samples, even those with imperfect coverage and participation rates, generally outperform nonprobability samples in terms of the accuracy of point estimates for population means and proportions. Using benchmark data, for example, from official statistics and administrative records, the majority of studies find that the results from nonprobability samples are in general less accurate (Dassonneville et al. 2020; Kennedy et al. 2016; MacInnis et al. 2018; Malhotra and Krosnick 2007; Mercer and Lau 2023; Pasek 2016; Pekari et al. 2022; Sohlberg, Gilljam, and Martinsson 2017; Sturgis et al. 2018; Yeager et al. 2011; see also Cornesse et al. 2020 for an overview). Weighting the nonprobability samples using standard demographics (e.g., age, gender, education, region) usually does not eliminate selection bias (for exceptions, see Berrens et al. 2003; Lee and Valliant 2009; Steinmetz et al. 2014; Taylor 2000; W. Wang et al. 2015). The success of the weighting procedure appears to depend on the availability of the right variables for weighting, that is, variables related to both the self-selection into the nonprobability sample as well as the outcome variable of interest, and to a lesser degree on the complexity of the statistical method used for weighting (Mercer, Lau, and Kennedy 2018). Evidence on the benefits of probability sampling is less clear when the goal of a study is to estimate bivariate relationships (e.g., correlations) and coefficients in multiple regression models. In some cases, nonprobability samples produce similar results to probability samples while in others they do not (e.g., Ansolabehere and Rivers 2013; Berrens et al. 2003; Dassonneville et al. 2020; Kennedy et al. 2016; Malhotra and Krosnick 2007; Pasek 2016; Pekari et al. 2022; Salvatore et al. 2023; Steinmetz et al. 2014). If the mechanism that leads to selection into a nonprobability sample is independent of the correlation between two variables in the population (Groves 1989), then a nonprobability sample can produce unbiased estimators of bi- and multivariate relationships (Goldberger 1981; Heckman 1979). However, under what circumstances this independence holds in practice is still the issue of an ongoing debate (Cornesse et al. 2020).
4.3.2.1 Types of nonprobability samples
Several nonprobability sampling techniques are commonly used (see Vehovar, Toepoel, and Steinmetz (2016) for an overview). We first discuss common forms of nonprobability sampling relevant for WAS studies and then provide an overview of existing WAS studies that used these methods.
Nonprobability sampling is sometimes called convenience sampling because the researcher selects any eligible unit available to them. Samples might be recruited at events (e.g., sports, music, etc.) or in other locations where many people can easily be reached (e.g., at shopping malls and pedestrian areas). While potentially a relatively large and specific audience can be targeted at specialized events, selection bias is of major concern here. Take the example of a study that tries to estimate mobility patterns of older adults with a smartphone app in a large metropolitan area. The research team sets up a booth at a local senior fair to recruit sample members. While this method might be a practical and cost-efficient way of reaching many people in that target population within a short period of time in one location, one has to wonder whether and how much the people who attend this particular senior fair systematically differ in their mobility patterns from older adults in the metropolitan area who do not attend the fair, maybe because they are less mobile. Generalizing from this convenience sample to the population of all older adults in that metropolitan area based on the sample from the senior fair therefore seems not advisable.
Volunteer sampling – sometimes also called opt-in sampling – is a type of convenience sampling where individuals have to react to a public, non-individualized invitation for a study. Such invitations might be posted in public areas (e.g., community boards at supermarkets, senior centers, or on a university campus), the media (e.g., radio, TV, or newspaper ads, billboards and other out-of-home advertising, see Figure 4.7), or online (e.g., social media posts, ads on websites with high traffic). Selection bias can arise in such an opt-in study if the factors that influence peoples’ probability to see the ad and volunteer to participate correlate with the variables the study aims to measure. One such factor might be the topic of a study. For example, physically active individuals might be more likely than non-physically active people to be interested in, click on an online ad for, and volunteer to participate in a study that collects health and activity data with a fitness tracker. Disguising the topic of a study could, to some degree, help to reduce this type of selection bias but is not always possible or ethical.
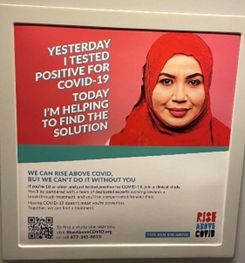
Figure 4.7: Ad recruiting participants for an opt-in health study. (Photo taken by one of the Authors, June 2021.)
A special form of volunteer samples is the concept of research subject pools that are maintained by many universities and research institutions, especially in the field of psychology (Landrum and Chastain 1999) and experimental economics (Greiner and Stephanides 2019). The advantage of such pools of (often undergraduate) students and other people living close to campus is that researchers can easily get access to a sample of sufficient size for their study at a fraction of the costs of recruiting a sample from scratch. However, it has been widely recognized that conducting research exclusively with WEIRD study participants (i.e., Westerners who are highly Educated and live in Industrialized, Rich, and Democratic societies) as they can be found on university campuses in North America and Western Europe does not necessarily generalize to the general population, neither in these specific countries nor in other parts of the world (Henrich, Heine, and Norenzayan 2010a, 2010b).
As an extension of this idea, online access panels have become a standard tool for recruitment of samples for surveys (Callegaro et al. 2014). Online panels provide large pre-recruited pools of diverse people who can be invited to participate in research in a timely manner4. There are a few online panels that recruit their members based on probability sampling techniques. However, the large portion of commercial online access panels uses some type of nonprobability sampling approach to recruit new members, including volunteer sign-ups, website banners, social media posts, search engine advertising, and members-get-members campaigns. How individual providers recruit members into their panels is often a proprietary secret, and the quality of approaches might vastly differ across panels (Callegaro, Lozar Manfreda, and Vehovar 2015, 207; Cornesse and Blom 2023). Since online panel members have signed up to participate in a variety of studies, the specific topic of any given study is less of a factor when panel members decide whether they want to participate in that specific study or not (Keusch 2013). However, online access panel members seem to be especially driven by high interest in research in general and by the monetary incentives they receive for participation (Keusch, Batinic, and Mayerhofer 2014). Many members tend to participate in a large number of surveys and other research studies (Zhang et al. 2020). Thus, there might be other types of selection biases at play. Several studies show that nonprobability online access panels tend to produce less accurate results than probability samples (see Box 4.2).
A similar issue can arise from samples recruited from crowdsourcing platforms such as Amazon’s MTurk, Prolific, and CloudResearch. These platforms were originally built to distribute labor-intensive tasks that are not easily automated (e.g., labeling images, looking up and verifying information) among human workers who get paid for completing the task. Increasingly, researchers use crowdsourcing platforms to recruit workers as participants for research studies (Antoun et al. 2016; Douglas, Ewell, and Brauer 2023). There is mixed evidence about whether samples from these platforms produce results comparable to those from probability samples (Berinsky, Huber, and Lenz 2012; Krupnikov and Levine 2014; Levay, Freese, and Druckman 2016; Mullinix et al. 2015).
There are several ways in which researchers try to improve the quality of nonprobability sampling over mere convenience and volunteer samples. One approach is called judgment sampling or expert choice where the researchers deliberately pick cases they deem to be typical for the population. The judgment often happens on an aggregate level, that is, maybe a specific city or neighborhood, clinic, or school is selected, and individuals who live, work, or attend the selected location are then recruited into the study. Of course, different experts might consider different cases to be typical so that even if individuals are sampled from within the cases using a probability-based technique, bias is likely to happen.
Another approach is quota sampling where quotas are set in order for the sample (e.g., the one selected from an online access panel) to better reflect the target population in some known characteristics (e.g., age, gender). For example, in the case of the health and physical activity fitness tracker study described above, the research team might aim to recruit a sample of volunteers that mimics the age and gender distribution of the population. Readers might note that guaranteeing that certain characteristics have the same proportion in the sample as in the population resembles the idea of stratified sampling (see 4.3.1.1). However, the quota sampling procedure is not probability-based, that is, interviewers may deliberately choose study participants or participants can self-select into the study until the quotas are filled. Thus, any other characteristics of the sample not controlled for by quotas, including behaviors and attitudes of interest, are likely to differ between the sample and the population. Quota samples will only provide unbiased estimators if the quota characteristics can also account for the differences in the variable of interest between the sample and the target population (Tillé and Matei 2016).
Finally, snowball sampling is a network-based form of nonprobability sampling. First, selected units from the target population of a study are used as the “seeds” for a sample. The seeds are usually recruited through typical convenience or volunteer methods (e.g., members of the personal network of the researcher, posts on social media, flyers on the message board of a community center). After successful recruitment interviews, the seeds are asked to recommend contacts (“referrals”) from their personal networks who also belong to the target population. The newly recruited sample members are then asked to provide further referrals and so on. This procedure is followed until the desired sample size is reached or the sample saturates, that is, referrals lead to no new sample members (Parker, Scott, and Geddes 2019). Snowball sampling is often used when hard-to-reach populations are the target of the research. These populations might be characterized by their relatively small size and/or geographic dispersion, be unrecorded, stigmatized, and/or particularly vulnerable, thus require a higher degree of trust in order to be willing to participate (Tourangeau 2014). For example, a researcher might want to study risk behavior in illegal sex workers and recruits a number of seeds with the help of a nonprofit organization run by former sex workers. The seeds then refer to other sex workers in their personal network to participate in the study. Note that the snowball sampling approach was originally developed to access hidden populations and study their network structure in qualitative research. To provide unbiased estimates of the size of a population or for specific behaviors and attitudes in the population, strong assumptions have to be met that build on a specific design in the recruitment of the seeds and referrals (respondent-driven sampling; see Heckathorn (2011)).
4.3.2.2 Examples of nonprobability sampling in WAS studies
Several WAS studies have relied on self-recruitment of volunteers from the general population. In one of the earliest large-scale smartphone-based WAS studies, almost 22,000 people in the UK downloaded the Mappiness app to their iPhones and completed EMA questions about happiness while sharing their geographic location via GPS between August 2010 and February 2011 (MacKerron and Mourato 2013). The start of the study was accompanied by a media campaign in traditional and social media. The app was also highlighted in Apple’s App Store at the time of its launch, and many participants shared the app with friends and acquaintances. Given the recruitment of volunteer iPhone users, it is not surprising that the Mappiness sample was substantially younger and more wealthy compared to the general adult population in the UK at that time (MacKerron and Mourato 2020). Researchers who use the data to study the relationship between momentary subjective wellbeing and being in a natural environment (MacKerron and Mourato 2013), at work (Bryson and MacKerron 2017), near an airport (Fujiwara, Lawton, and MacKerron 2017), or living in rural areas (Gilbert, Colley, and Roberts 2016) need to assume that the factors that lead to self-selection do not influence these relationships.
Another large-scale WAS study that relies on volunteer self-recruitment is the All of Us Research Program. In 2018, All of Us started enrolling participants aged 18 and older in the U.S. The goal of the study is to eventually comprise a sample of at least one million individuals from diverse backgrounds, including minority groups that are usually less likely to participate in health research (Us Research Program Investigators 2019). As of February 2024, more than 760,000 volunteers (according to https://www.researchallofus.org/) have enrolled online (via https://www.joinallofus.org/) or through one of 340 recruitment sites. In addition to health questionnaires, electronic health records, physical measurements, and collection of biospecimens, All of Us allows study members who own a Fitbit device to share their data with the program (Health All of Us Research Program 2019). As of 2023, almost 15,000 participants had provided Fitbit data (Master et al. 2023). Note how All of Us differs in their recruitment strategy from the UK Biobank study (described in 4.3.1.2). While the UK Biobank study actively approached all people living in a specific area with a postal letter to enroll, All of Us relies on members of the public to volunteer via an online platform or at a recruitment site. In addition, the UK Biobank study provided accelerometers to a random sample of the enrolled members while All of Us allows people who own a Fitbit to self-select. Thus, it is not surprising that the All of Us Fitbit subsample is biased in several sociodemographic variables compared to all program participants and the general population (Guyer et al. 2023). More than 80 percent of Fitbit participants reported being white (U.S. adult population: 63 percent; All of Us full sample: 54 percent), 68 percent were female at birth (U.S. adult population: 51 percent; All of Us full sample: 61 percent), 45 percent had an annual household income of more than $100,000 (U.S. adult population: 34 percent; All of Us full sample: 27 percent), and 72 percent were college graduates or had an advanced degree (U.S. adult population: 35 percent; All of Us full sample: 46 percent). Compared to the full All of Us sample, Fitbit participants also lower rates of lifetime smoking (33 vs. 40 percent), coronary heart disease (3 vs. 8 percent), and type 2 diabetes (6 vs. 13 percent), and higher self-rated health (excellent or very good: 49 vs. 39 percent). In 2021, the program started providing 10,000 Fitbit devices to selected study participants (Research 2021).
On a smaller scale, the PhoneStudy is a mobile sensing research project that recruited over 700 German volunteers via posts in online forums, on social media, and on physical blackboards as well as using flyers and direct personal contact between 2014 and 2018 (Stachl et al. 2023). Based on a combination of self-reports and an Android smartphone app that collected information about smartphone usage and location for 30 days, the researchers studied, among others, what individual differences exist in in daily social behavior (Harari et al. 2020) and in day-night activity patterns (Schoedel et al. 2020) as well as how specific patterns of communication and social behavior correlate with the Big Five personality dimensions (Stachl et al. 2017, 2020), sensation seeking (Schoedel et al. 2018), and autistic traits (Schuwerk et al. 2019). To generalize from the sample to the general population, as with all nonprobability samples, the researchers of these studies have to assume that the relationships found in the volunteer sample are independent of the self-selection process.
Some WAS studies have commissioned commercial access panel vendors to generate quota samples of the general population. For example, the Smartphone Sensing Panel Study recruited 800 Android smartphone owners aged 18 to 65 years living in Germany who are members out of an existing nonprobability online panel. Participants had to install a smartphone app that allowed sensing, pushed experience sampling questions, and administered monthly online surveys over a period of six months. To mimic the general German population, quotas for gender, age, education, income, religion, and relationship status were used (Schoedel et al. 2023; Schoedel and Oldemeier 2020).
In addition to these general population studies, there are numerous smaller WAS data collection efforts that target specific subgroups based on nonprobability samples. For example, several studies with research questions around the social life and health of university students have recruited convenience samples of students from selected classes on a campus (R. Wang et al. 2014) or the entire cohort of incoming students at a university (Stopczynski et al. 2014). Several studies have targeted older adults for WAS studies. Maher, Rebar, and Dunton (2018) recruited 104 community-dwelling adults aged 60 years or older from Los Angeles County through announcements at local senior centers and retirement communities and via a pre-recruited subject pool of a university in Southern California. Participants received a smartphone for EMA self-reports and an accelerometer (ActivPAL) that monitored their physical activity and sedentary behavior over ten days. The Real-time Neighborhoods and Social Life Study recruited a convenience sample of 60 participants over 55 years of age at senior centers in four neighborhood areas in New York City. To study the activity spaces of older adults, the researchers provided the participants with iPhones to carry for seven days which collected GPS location data and pushed EMA questions several times a day (York Cornwell and Cagney 2017; York Cornwell and Goldman 2020). An example of recruiting a hard-to-reach population for a WAS study can be found in Wray et al. (2019). For their study of alcohol drinking locations in high-risk gay and bisexual men using geofencing technology (see Chapter 2.X), the researchers recruited participants living in the metro areas of Providence, Rhode Island, and Boston, Massachusetts from gay-oriented smartphone dating applications, general social media sites, and via flyers. How much the conclusions drawn from these self-recruited samples can be generalized to the larger population of university students/older adults/gay and bi-sexual men who did not volunteer to participate and/or would be found at different university programs/retirement communities/social media platforms is unknown.
4.4 Additional readings
Readers who want to learn more about the theory of sampling, on how to select samples in practice, and how to work with data from complex samples should consult one of the following books for more information:
Chapter 3 of Groves et al. (2009) Survey Methodology discusses target populations, sampling frames, and coverage error. Chapter 4 provides a gentle introduction to the idea of probability sampling for large-scale surveys but does not contain enough detail to allow readers to select samples themselves. Nevertheless, it is a very good place to start for those who are new to sampling.
Applied Survey Sampling by Blair and Blair (2014) is an introductory-level book to sampling, covering the different basic forms of probability and nonprobability sampling with many illustrative examples.
For readers interested in the general idea of probability sampling, we recommend the classic Survey Sampling textbook by Kish (1965).
Valliant, Dever, and Kreuter (2018) Practical Tools for Designing and Weighting Survey Samples is (not surprisingly) a very practical book for readers who desire insight into the statistical thinking and steps taken to design, select, and also weight samples. The book uses examples that can be followed with the free statistical software R, including an associated R package, PracTools, to implement many of the techniques discussed.
Lohr (2022) Sampling: Design and Analysis digs deeper into the statistical theory behind sampling. Readers who want to select complex samples with stratification and clustering will likely want to understand the theory behind these approaches.
References
In this chapter, we are considering only those who see the posting, have a chance to click on the post, and own a tracker. We are not yet considering who chooses to click on the posting and who does not: we discuss that issue in Chapter 5.↩︎
While coverage bias is usually more the focus of concern, coverage variance can also occur if the sampling frame can vary from one theoretical repetition of the study to another. This type of variance is most likely when interviewers or other study staff are involved in creating the sampling frame (Eckman 2013).↩︎
Another challenge to estimating coverage error is that sometimes the issues of coverage and nonparticipation are hard to separate in practice (Eckman and Kreuter 2017).↩︎
Probability-based online panels recruit their members offline, for example, via address-based sampling or random digit dialing. To overcome coverage issues, some of them even provide Internet access and devices to households that lack the necessary technology (Blom et al. 2016; Bosnjak, Das, and Lynn 2016; DiSogra and Callegaro 2016). Examples for these probability-based online panels are the LISS panel in the Netherlands and the UAS panel in the US, both mentioned as sampling sources for WAS studies in 4.3.1.2. The recruitment and maintenance of these panels is very expensive, and the majority of them are operated by universities or other large-scale research infrastructures.↩︎