Chapter 1 Introduction
1.1 Wearables, apps, and sensors as novel tools for data collection
Smartphones, smart watches, fitness trackers, and other wearable devices have become integral parts of our lives. Many users carry their devices around with them throughout the day, thus the devices are often present in the same physical and social contexts as their users. In this book, we will demonstrate how sensors, apps, and other technologies built into mobile devices and wearables such as smartphones, fitness trackers, and smartwatches (for readability, we will use the acronym WAS when we collectively mean wearables, apps, and sensors), allow researchers to collect data about human behavior and social interactions at an unprecedented level of detail and scale. The findings from such studies will likely increasingly provide guidance on policy decisions. For example, research using smartphone sensors focusing on labor market outcomes or public health researchers using accelerometers to study physical activity can help to uncover phenomena that we could not be studied through traditional methods providing better evidence for policy makers.
WAS promise not only to collect more but also better data. Take for example physical activity. In the past, many studies of physical activity did not have access to objective measures of physical activity. Instead, they relied on participant reports of physical activity using surveys or diaries. For example, a question from the U.S. National Health Interview Survey asks: “In a typical week, do you do any vigorous intensity sports, fitness, or recreational activities that cause large increases in breathing rate or heart rate like running or basketball for at least 10 minutes continuously?“ If answered “yes“, a question on the number of days and the number of hours and minutes in a day that respondents did those activities follows. Such questions can be difficult to understand because they are long and complex. The questions might also be hard to answer precisely. For example, could you accurately answer the question on the number of hours and minutes that you perform vigorous activity? Participants may also be tempted to report that they get more physical activity than they really do – they might report how much activity they plan to do or wish that they did, or they might engage in impression management and respond in a socially desirable way. Kapteyn et al. (2018) equipped participants in the Netherlands, the UK, and the U.S. with wrist-worn accelerometers that capture movement multiple times per second, recording objective data about how the device, and the user, moved through space. From these data, researchers can figure out whether participants are sitting, running, biking, moving in a car or train, etc. This and other studies found that the objective data did not necessarily align with data from participants’ self-reports about the physical activity, and participants usually overreported their activity.
Measuring physical activity with designated accelerometers is just one of the applications we will discuss in this book, other examples of WAS and their application in research can be found in Box 1.1. And of course, we need to consider the challenges that come with using WAS for data collection. While these devices solve some of the challenges with other methods of data collection, researchers should not assume that data collected with WAS are error-free. For example, people might forget to put the wearable back on after taking a shower, they might leave their smartphone at home, and some people might even refuse to have their data collected altogether, which could bias conclusions drawn from the data. We will see this as one of the major themes throughout the book.
In this book, we aim to show the breadth of opportunities for data collection using WAS. We also provide the required tools for readers to think critically about potential challenges and the resulting data quality. This book will provide evidence-based guidance for researchers, students, and practitioners who wish to collect data about human behavior and social interactions using WAS.
In the remainder of this first chapter, we clarify important terminology such as what we mean when we talk about sensors or passive data collection (Section 1.2). We then provide arguments for why we think that WAS are powerful tools when studying human behavior and social interactions (Section 1.3). Of course, there are also potential challenges when collecting data with WAS, and we provide a review of these challenges (Section 1.4). We end this chapter with a brief overview of what the readers will find (and not find) in the book (Section 1.5) and how we envision that different groups of readers can make the most of using the book for research, teaching, and learning (Section 1.6).
BOX 1.1. Examples of studies using wearables, apps, and sensors for data collection
To understand how much physical activity adults in the UK engage in and how physical activity relates to their overall health, more than 100,000 people in the UK wore a device (Axivity AX3) for about a week that tracked their activity as part of the UK Biobank study between 2013 and 2015. The data showed that, on average, women were more active than men, and older participants were more active in the mornings than in the afternoons or evenings, while younger participants were more active in the afternoons or evenings. Physical activity decreased by about 7.5 percent for each 10 years of additional age (Doherty et al. 2017).
MacKerron and Mourato (2013) studied the impact of one’s surroundings on emotions using in-the-moment surveys (Ecological Momentary Assessment or EMA) that more than 20,000 participants in the UK completed on their smartphones. They linked participants’ location tracked through the smartphone’s Global Navigation Satellite System (GNSS) module while completing the EMA to spatial data (e.g., type of space, weather conditions, amount of daylight). The data revealed, perhaps not surprisingly, that participants tended to be happier in outdoor, green, or natural habitats than in urban environments.
In Denmark, Stopczynski et al. (2014) handed out 1,000 smartphones to students to study the formation of social networks. The smartphones collected data via Bluetooth and Wi-Fi networks about the proximity to others as well as data about calling and texting behavior and social media usage. One interesting finding is the distinct patterns of face-to-face versus digital social interactions; face-to-face interactions during the week were driven by university-related activities and only few of the social ties manifested themselves during the weekend despite students sending and receiving messages and making and receiving calls to the people they interacted with during the week.
Wang et al. (2014) studied U.S. students’ behavior and well-being throughout an academic term. Their study took advantage of multiple sensors built into smartphones: microphones, light sensors, and accelerometers. With these sensors, they inferred when students were sleeping and when they were engaged in conversation. These measures correlated with self-reported depression levels, stress, and academic performance.
Sugie and Lens (2017) provided smartphones to recent parolees in New Jersey to study how spatial context influences reintegration into the labor market. The researchers showed that there exists a spatial mismatch that affects the success prospects of a job search: low-skilled, nonwhite job seekers are located within city centers while job openings are in outlying areas. Such spatial mismatch lengthens the time to employment; however, mobility can compensate for residential deficits and improve employment outcomes.
In a German study, Kreuter et al. (2020) asked participants in the ongoing panel study to download a research app to their smartphones. The app (IAB SMART) asked participants questions repeatedly over the course of six months, among others, about their current employment status, job search activities, and smartphone-related stress. The app also passively collected data from the smartphones: geographic locations, physical activity, means of transportation, use of smartphone apps, interactions via calls and text messages, and characteristics of participants’ social networks from contact lists (i.e., gender and nationality). The study found, for example, that, on weekends, unemployed men were less physically active than employed men, but differences between the employed and unemployed men were quite small during the week and there was no difference in physical activity for women (Bähr et al. 2019).
The Daily Experiences & Wellbeing Study (DEWS) was conducted with older adults in Texas who resided at home and were no longer working to better understand the relationship between social connectedness, cognitive health, and other measures of well-being. Approximately 350 participants completed an in-depth survey in their home and were then provided with an Actical accelerometer to wear for five days, as well as a mobile device that delivered six EMA surveys throughout the day and recorded 30 seconds of sound every three minutes during waking hours. The study found that participants who had more social connections were more likely to be more physically active and engaged in conversation throughout the day than those who had a smaller social network (Fingerman et al. 2020).
The All of Us study is a large U.S. National Institutes of Health (NIH) initiative that began in the U.S. in 2018 with the goal to enroll a total of one million participants. Participants actively provide data from a variety of sources, creating a rich, longitudinal data set inclusive of minority populations typically underrepresented in such research efforts. The study collects data via health questionnaires, electronic health records (EHRs), physical measurements, biospecimens, as well as digital health technology. Participants can currently share data from their own Fitbit devices with the All of Us program; the program will expand to support other devices as well (All of Us Research Program Investigators 2019).
1.2 Terminology: What do we mean by wearables, apps, and sensors?
This book is about collecting data on human behavior and social interactions with wearables, apps, and sensors (which we refer to collectively as WAS). Thus, it is important to define these terms before we get too far into the book. We first discuss what we mean by sensors.
In the most basic technical sense, a sensor is “a device that converts a physical phenomenon into an electrical signal” (Kenny 2004, 1). The physical phenomena that sensors can measure include temperature, force, pressure, flow, position, and light intensity. One common example of a sensor is the accelerometer, which measures the rate of change of velocity (i.e., acceleration) of a body in relation to its rest frame (Rindler 2013). We will discuss how accelerometer sensors and other technologies work and how they can be used to measure human behavior and social interaction in more detail in Chapter 2. For now, it is important to understand that sensors do not operate by themselves but are usually part of a larger system that constitutes multiple signal processing circuits allowing data acquisition, measurement, and/or process control (Kester 2004).
When we collect data with sensors, we usually use devices that contain multiple sensor systems. For example, many fitness wristbands and smartwatches include an accelerometer, a GNSS module, and a heartbeat detector. The devices often come with an internal storage that saves the output of the sensor system and many consumer-grade devices also include an interface or display that allows the user to immediately read the output from the sensor system. Sometimes, the terminology used for the sensors and the devices that contain one or more sensors is imprecise and inconsistent. For example, in physical activity research, the devices that are used to collect movement data, such as the Axivity AX3 used in the UK Biobank study mentioned above, are called accelerometers, even when the devices also contain heartbeat sensors. Sleep researchers, on the other hand, tend to call these devices actigraphy devices (C. Smith et al. 2020).
Devices that include sensors and are worn on or around the body are called wearables or wearable technology. They can be defined as “lightweight, sensor-based devices which are worn close to and/or on the surface of the skin, where they detect, analyze, and transmit information concerning several internal and/or external variables to an external device” (Düking et al. 2016, 2). Wearable technologies include smartwatches, wristbands, hearing aids, electronic/optical tattoos, head-mounted displays, subcutaneous sensors, electronic footwear, and electronic textiles (Yetisen et al. 2018).
Central to smartphones and many other smart devices are apps. Apps are programs that allow the user to interact with a device. Researchers can use apps to collect data from study participants. For example, a smartphone app can display survey questions to study participants and record their answers. Research apps can also access information about the number of text messages and calls sent and received on a phone (so-called log files) to understand how socially connected a user is. Apps can assemble information recorded by one or many sensors built into the device, and they can aggregate and process these different sources of information, store it, and transfer the data to a database outside the device (Struminskaya, Lugtig, et al. 2020).
Throughout the book, we will also mention other devices that include sensors, such as non-wearable smart devices that people might have at home (e.g., smart scales, energy meters). All these aforementioned devices are considered smart because they “automatically gather information about users or their environment to assist them in gaining knowledge about themselves and/or taking action” (Lazar et al. 2015, 635). Finally, there is another class of technology that is usually referred to as “environmental sensors” (Sanders 2008), which are deployed in public spaces that collect information, for example, about air pollution or climate in a specific area.
When we use wearables, apps, and sensors to collect data about human behavior and social interaction, we can distinguish two forms of data collection: passive and active Wenz, Jäckle, and Couper (2019). The measurement of certain phenomena is passive if the data are byproducts of a person’s everyday activities. For example, a smartphone user sends a text message or a person with a smartwatch walks between two locations. Data about these activities are generated and stored automatically by a sensor or a device, without any input by the user. While the passive measurement requires behavior on the part of the participants – in this case texting and walking – the measurement itself happens without any additional involvement of the participant.
These passively collected data can be captured and repurposed for research use. Of course, to use these passively collected data for research purposes, usually some initial action by the participant is required, such as downloading a research app to their smartphone, agreeing to wear a fitness tracker, or consenting to data linkage from their smartwatch (see Section 1.4.4 for a first discussion of privacy and ethics in this context). However, once consent is given, the participant goes about their everyday life without being interrupted by the measurement process. Sometimes the terms mobile sensing (Harari et al. 2015) and digital phenotyping (Torous et al. 2016) are used to describe passive measurement.
Data collection is active when the data are created by the participant as a reaction to a stimulus given by a researcher. These stimuli are deliberately designed to generate data for research purposes. Such a stimulus can be a survey question, for example, triggered as part of an Ecological Momentary Assessment (EMA), where the participants are prompted via a research app on their smartphone to respond about their current mood or environment. Device features, such as the camera on a smartphone, might also be used for active data collection, for example, when participants are asked to share a photo of their current surroundings or of the food they are about to consume or to scan a barcode or receipt they received for a purchase. WAS data collection can be active or passive, depending on the interests of the researchers and the consent of the participants.
BOX 1.2. Definitions for key terms used in this book
Sensor: A piece of hardware that converts a physical phenomenon into an electrical signal. For example, the accelerometer sensor measures the rate of change of velocity of an object.
Wearable: A lightweight device including one or multiple sensors that people can wear close to or on their skin, e.g., a fitness bracelet or smartwatch.
App: A software program that runs on a smartphone or other smart device. Apps allow users to interact with a device. For researchers, apps provide the opportunity to collect, aggregate, and process data collected on the device.
Passive data collection: Data are collected, for example, by sensors, as a byproduct of everyday activity (e.g., accelerometer collecting data about walking).
Active data collection: A participant deliberately creates data as a reaction to a stimulus designed by the researcher (e.g., responding to a survey question, taking a picture and sharing it with the researcher).
1.3 Why use wearables, apps, and sensors to understand society?
In this book, we will demonstrate that sensors, apps, and other technologies built into mobile devices and wearables such as smartphones, fitness trackers, and smartwatches, allow researchers to collect data about human behavior and social interactions at an unprecedented level of detail and scale. While we do not believe that these new technologies will make traditional methods of data collection, such as self-reports in surveys, obsolete, we do see them as a valuable addition to the methods toolkit for social and behavioral researchers. Data collection using wearables, apps, and sensors can be combined with traditional methods to get a better, more complete picture about people’s behavior in their everyday lives and their interaction with others. Integrating wearables, apps, and sensors into social and behavioral data collection is a natural step in the evolution of methods. In this section, and throughout this book, we will present the pros and cons for the use of these methods in research.
1.3.1 Taking advantage of technology that is widely used in society
Traditionally, data collection in the social and behavioral sciences has relied on self-reports from survey-based methods and human observations. Research that leveraged technology for direct observation of human behavior was usually confined to small-scale studies that involved providing technology to participants (for example, pagers to remind people to complete a diary) and lab studies where often expensive, non-mobile equipment was used to observe people in an artificial environment (for example, sleep studies in a lab). With the increasing penetration of mobile devices, in particular smartphones, many people now carry powerful technology with them wherever they go. In most Western countries, smartphones have become essential to many people’s daily lives (A. Smith 2015) and other consumer-grade wearable technology, such as fitness trackers and smartwatches, are becoming increasingly popular as well (Vogels 2020). On an individual level, the technology allows users to collect biological, physical, behavioral, and environmental information about themselves – a phenomenon that has become known as the quantified-self movement (Lupton 2016; Swan 2013).
The increasing use of such devices and their sensing capability make them powerful research tools. Researchers can study human behavior and social interaction on a much larger scale and in a more naturalistic context (see also Section 1.3.6) than was ever possible in lab studies that use expensive research-grade technology. Many people have their own smartphones, fitness trackers, and smartwatches with them during the day, thus the devices are present in the same physical and social contexts as their users. In February 2021, 85 percent of U.S. adults reported owning a smartphone (Pew Research Center 2021) and smartphone penetration is similarly high in many other Western countries (K. Taylor and Silver 2019). The high penetration of these devices allows researchers to collect in situ data actively and passively from potentially hundreds if not thousands of participants at relatively low cost. When study participants use devices that they already own, this has been referred to as “Bring Your Own Device” (BYOD), which can be contrasted with providing devices to participants such as in the UK Biobank study described in section 1.1.
1.3.2 New forms of measurement
Current models of smartphones, smartwatches, fitness trackers, and other wearable devices are equipped with a multitude of technical features which allow researchers to collect a wide range of data about people (see Figure 1.1). As discussed earlier, we can distinguish between passive and active data collection (see section 1.2).
Passive data collection, where we extract data from a device’s sensor without active engagement in the data collection process by the participant, is especially suitable for objective phenomena that are difficult, or even impossible, to self-report. For example, the exact distance someone travelled throughout the day or their heart rate at different points in the day would virtually be impossible to self-report.
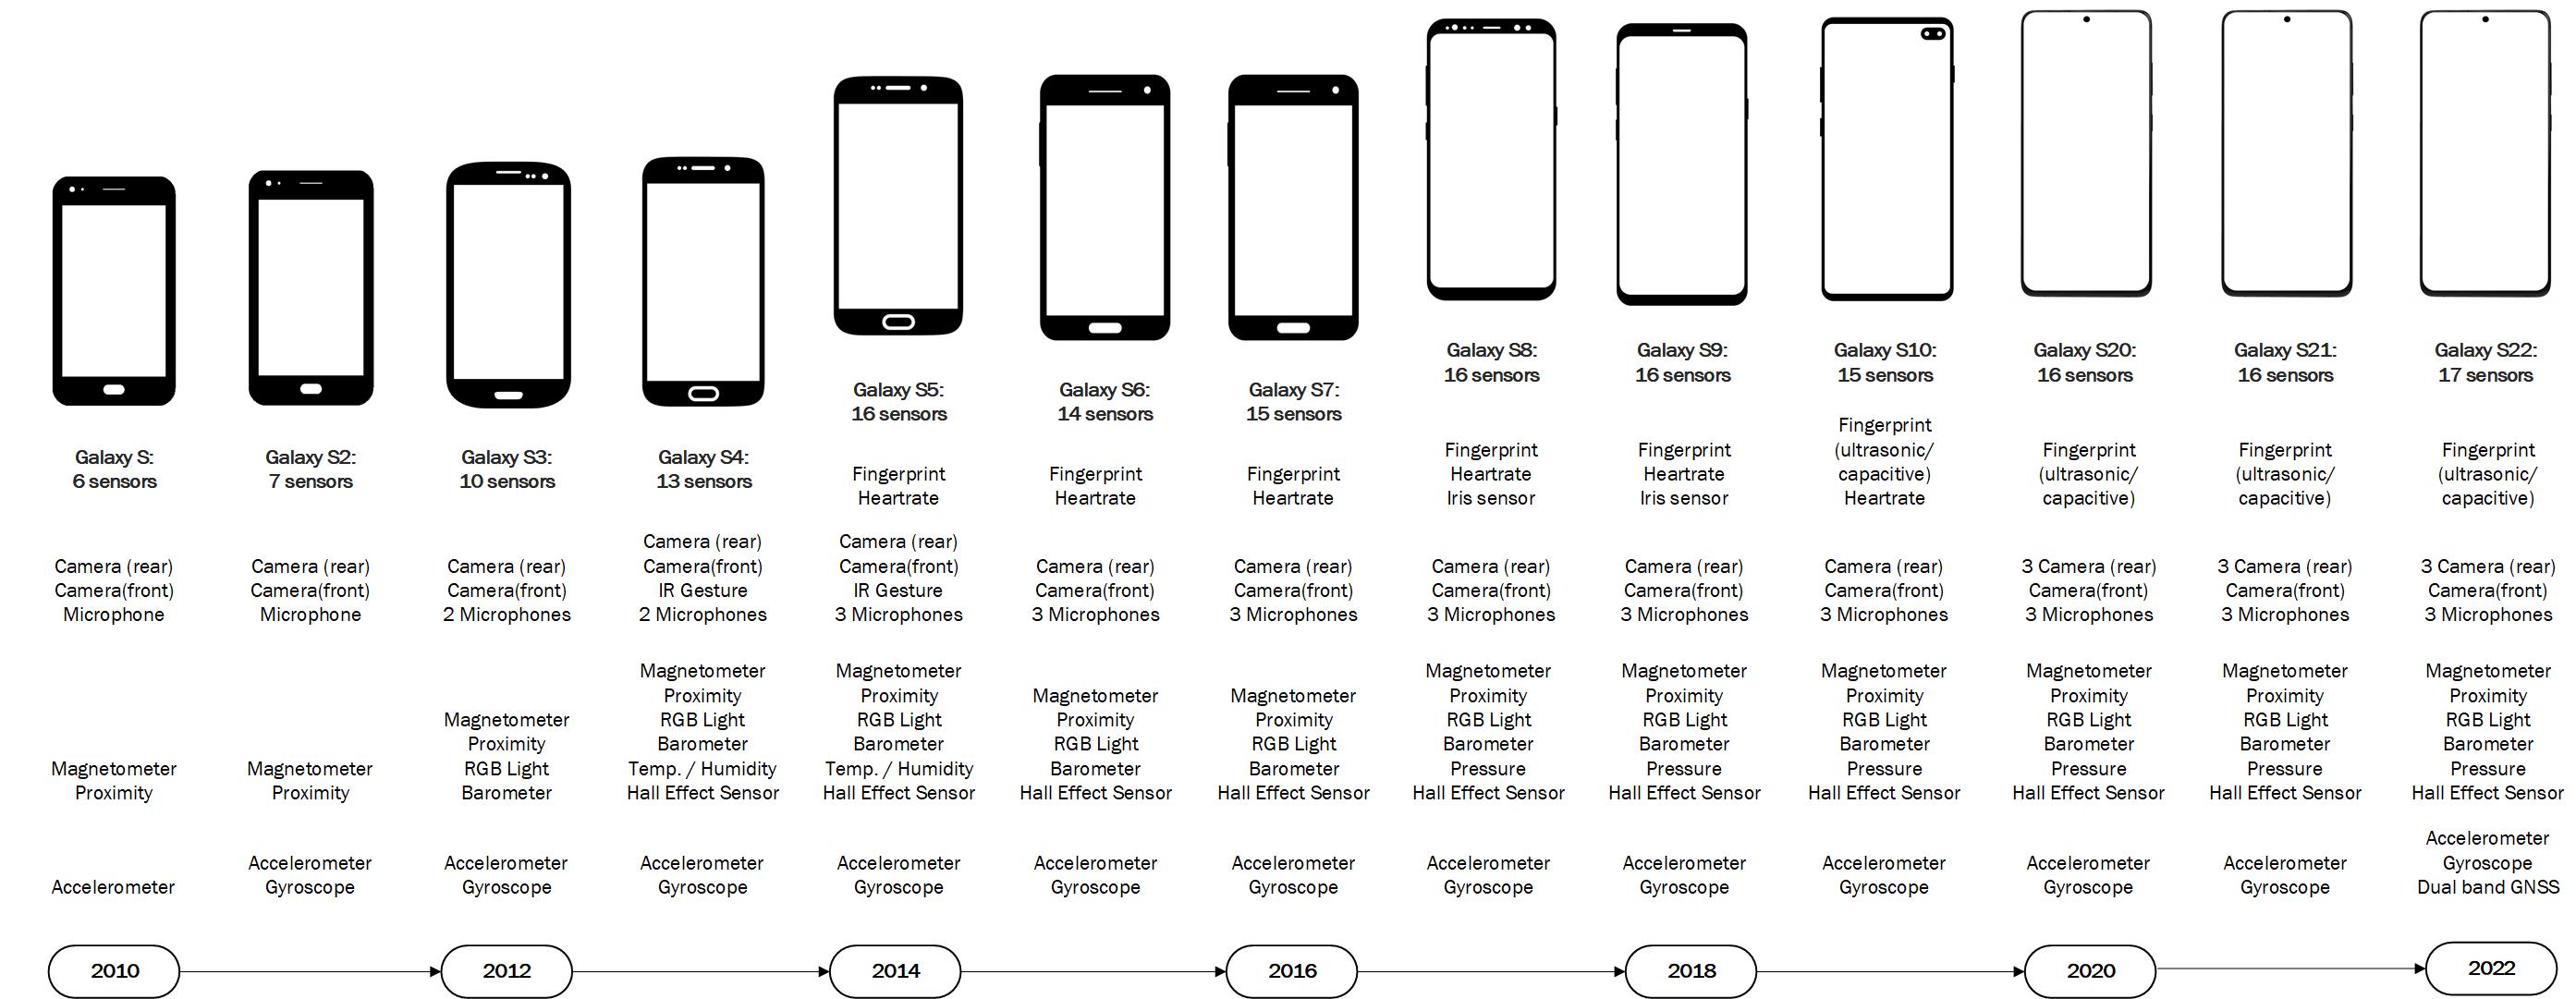
Figure 1.1: The number of sensors built into smartphones has increased over time
Active data collection of self-reports is necessary when researchers want to learn something about internal, subjective states (for example, attitudes, opinions, intentions) that cannot be inferred from passively collected data alone (note that increasingly passive measurement of behavior is used to infer internal states, see also Section 6.3). In addition, researchers might ask for self-reports to provide context to the passively collected data. For example, when travel activity is measured passively via GNSS, one might ask for information about the purpose of the trip, the mode of transportation, or whether the participant was accompanied by someone else.
Both active, in situ self-reports and passive measurement are certainly not new research methods. For example, EMAs have been conducted with paper diaries and paging devices since well before the existence of smartphones (e.g., Myin-Germeys and Kuppens 2021; Shiffman, Stone, and Hufford 2008). There is also a long-standing history of studies that have provided participants with research-grade sensor devices to monitor their activity and mobility (e.g., Lee and Mase 2002). However, it has become much more feasible to jointly collect different types of data, potentially on one device that people already own and carry around with them anyways. This relatively new phenomenon allows researchers to leverage the strength of the individual data sources at a lower cost and with less burden than using traditional data collection methods (Keusch and Conrad 2022).
1.3.3 More detailed data without increasing participant burden
One advantage of passive data collection is that we can directly observe people’s behaviors and their interactions at much higher frequency and detail than was possible before. For example, accelerometers collect information about acceleration in three dimensions, which can be used to measure physical activity. These sensors are built into virtually all smartphones, fitness trackers, smartwatches, and other wearable devices on the market today. A typical accelerometer operates at 60 Hz, that is, it collects 60 readings per second on three axes, 180 data points per second, 10,800 data points per minute for just one participant (Figure 1.2). The fine-grained measurement allows researchers not only to collect information about current states at a single time point of measurement but also to evaluate moment-to-moment change in a behavior (for example, changes in activity level from minute to minute, and throughout the day). Collecting that much detail about participants’ movement and physical activity via self-reports would impose too much burden: a researcher can only ask so many survey questions about physical activity without repelling study participants.
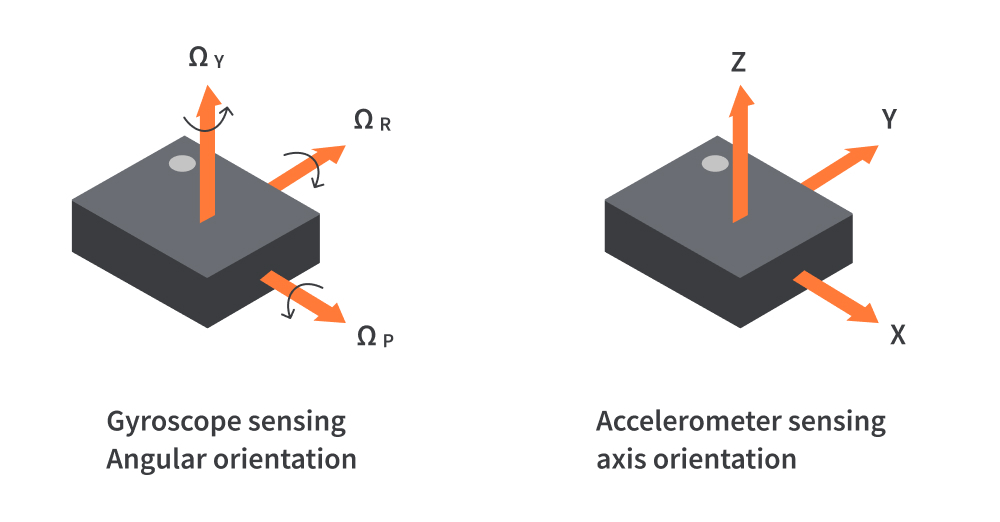
Figure 1.2: Accelerometer sensors built into smartphones and wearable smart devices measure the acceleration of the device in three axes (right). The gyroscope detects the angular velocity of a device (left). REPLACE FIGURE.
And even if respondents were willing to answer many questions, for some of the phenomena of interest, sensor measures are the only way to objectively collect information. Take sleep, for example: while respondents could provide a qualitative estimate about their sleep experience last night, they cannot report how much time they spent in each sleep stage. A wrist-worn device such as a smartwatch or a fitness tracker, however, can collect data about heart rate, movement, and other factors that let the researcher infer how much time a person spent in the different sleep stages during a night. Additional biometric data that are collected using sensors embedded in wearable devices include blood oxygen levels and changes throughout the night as well as body temperature. The external environmental factors as well as the biometric and movement data collected using the wearable can be utilized to determine sleep initiation, duration, quality, efficiency, and sleep stages (Figure 1.3).
](images/fitbit1.jpg)
](images/fitbit2.jpg)
Figure 1.3: Examples of Fitbit graphics on sleep duration and quality provided to the wearable user on the phone app that is synced to the device. Source: https//help.fitbit.com
1.3.4 Unobtrusive, direct measurement can lead to more accurate estimates
We know that self-reports contain measurement error (see Tourangeau, Rips, and Rasinski 2000), for example, due to limitations in human comprehension (understanding the meaning of a survey question), recall (forgetting about events that happened in the past), and estimation ability (providing information about how frequently something happened). In addition, self-reports can suffer from reactivity, that is, participants reacting to a researcher-initiated stimulus and changing their behavior or reporting in a way that conceals the truth (i.e., social desirability).
Passive measurement, on the other hand, is a relatively unobtrusive form of data collection. Once a participant has installed a research app on their smartphone, agreed to wear a fitness tracker, or given consent to data linkage from their smartwatch, data collection happens in the background without any further notice of the participant. This unobtrusive form of measurement should lead to less reactivity (i.e., changing one’s behavior as a result of being observed) in the data collection (Webb et al. 1999). In addition, some forms of passive measurement are the most direct way of collecting information about behavior. Take, for example, smartphone usage; the operating system of a smartphone automatically stores information about incoming and outgoing voice calls and text messages as well as any app usage that happens on the device. As such, this passively collected information will be much more accurate than any type of self-report about smartphone usage (Andrews et al. 2015; David, Roberts, and Christenson 2018; Jones-Jang et al. 2020; Revilla, Ochoa, and Loewe 2017). Even for behaviors where the measurement via WAS is less direct than for smartphone usage, passive measurement can be more accurate than self-reports. For example, several studies that aim to measure human mobility and travel behavior have found that people tend to forget to report certain trips, especially short ones, when asked to recall them. Passive tracking of trips via GNSS and other sensors, however, does not suffer from such recall bias (see, for example, Lynch et al. 2019; Scherpenzeel 2017; Stopher, FitzGerald, and Xu 2007).
However, we should not conclude that data collected via passive means are always more accurate than data collected via active means. We will show in this book that other forms of measurement error can produce some inaccuracy in passively collected data (see Section 1.4.3).
1.3.5 Lower response burden
Passive and active measurement using wearables, apps, and sensors can be especially useful in the context of diary studies that place a particularly high burden on participants who have to provide data with relatively high intensity, resulting in high fatigue and dropout (Schmidt 2014). Completing an app-based questionnaire close to the time and point of activity first reduces recall periods and associated errors. Second, and potentially more importantly, additional functionalities of the device such as geolocation, camera, and microphone, can provide measures of context that can replace traditional survey questions and thus reduce respondent burden.
For example, in the Dutch pilot of the Time Use Survey, information on the geographic location is collected from respondents to infer their functional location and potentially reduce the necessity to enter certain activities (Elevelt et al. 2021). Similarly, in a travel app study by Statistics Netherlands, measures of geolocation via GNSS and deriving the means of transportation via device acceleration could potentially replace the web-based Travel Survey diaries (McCool et al. 2021). To measure food intake, Yan (2019) describes a smartphone app that allows participants to take pictures of food to estimate calorie counts and to use geolocation information to identify places where a participant consumed food. A number of pilot studies in the UK experimented with pictures of receipts to reduce the amount of data entry that are usually involved in expenditure studies (Jäckle et al. 2019; Wenz, Jäckle, and Couper 2019). An expansion of this study is currently underway in three European countries (the Netherlands, Luxembourg, and Spain).
However, in addition to decreasing respondent burden through more convenient data collection that potentially includes fewer and more targeted survey questions, there might be a new kind of burden when we ask people to share data from wearables, apps, and sensors. A different kind of burden arises because some people might not feel technically competent enough to use the technology involved in a study (see Section 1.4.2) or they feel that this specific form or data collection is an invasion of their privacy (see Section 1.4.4).
1.3.6 Collecting data at scale
Behavioral data collection in labs and with human observers was in the past limited to relatively small samples and, at times, to participants in limited geographic areas, such as those living near a hospital with a sleep lab, for example. The widespread use of mobile technology in the general population now allows researchers to collect data at a much larger scale than before. For example, between mid-2010 and early 2011, 22,000 volunteer iPhone users in the UK downloaded the Mappiness app and answered EMA questions on activities and affect for a total of more than 2,000,000 collected data points. Upon consent, the app also collected information on the location of the participants when responding to the EMAs. Linking survey responses to geolocation data allowed the researchers to study the relationship between well-being and spatial and environmental indicators about the location (e.g., type of land cover, coastal proximity, weather) (MacKerron and Mourato 2013). The UK Biobank study provided wrist-worn accelerometer devices to almost 100,000 participants who wore them for seven days (Doherty et al. 2017) to study the relationship between physical activity and health outcomes.
Other studies have used smaller samples but collected more detailed data over longer periods of time, creating longitudinal data sets of individual behavior. For example, the IAB-SMART study (Kreuter et al. 2020) collected data from around 650 German Android smartphone owners over six months, including geolocation every 30 minutes, physical activity every two minutes, as well as any call, texting, and app usage activity on the phone.
1.4 Potential challenges
While believe that the use of wearables, apps, and sensors for data collection certainly has its merits, there are several potential challenges that need to be considered when conducting research using this technology. Here we provide an overview of challenges inspired by what Couper (2019) calls “myths and misconceptualizations about passive mobile data collection”, and we will unpack these throughout the book.
1.4.1 Coverage issues – The ubiquity myth
While smartphones seem to have become ubiquitous in the developed world, there is still a risk of coverage error. That is, those who do not own the devices can systematically differ from owners on many variables. Differences between owners and nonowners include sociodemographics, such as age and educational attainment. For example, according to data from the Pew Research Pew Research Center (2021), 95 percent of U.S. adults under the age of 50 owned a smartphone in 2021, but only around 60 percent of people aged 65 years and older did so. Similarly, smartphone penetration is higher among U.S. college graduates (93%) than people with a high school degree or less (75%). Even more problematic is the fact that this bias extends to phenomena that are intended to be measured passively. Keusch et al. (2020) found that German smartphone owners reported higher life satisfaction and higher social inclusion compared to non-owners, even after accounting for differences in sociodemographics. Smartwatches and fitness trackers are, at least for now, less common in the general population. In 2019, 21 percent of U.S. adults reported regularly wearing such a device. Women (25%), Hispanics (26%), people under the age of 50 (25%), college graduates (27%), and those with a household income of $75k and above (31%) were overrepresented among owners.
In studies that focus on subpopulations who are underrepresented among smartphone owners, such as the elderly (English et al. 2022; York Cornwell and Cagney 2017) or men recently released from prison (Sugie 2018), researchers have given smartphones to the participants. Similarly, the Michigan Predictive Activity & Clinical Trajectories in Health (MIPACT) study provided more than 6,500 people with an Apple Watch to collect health data (Golbus et al. 2021). Depending on the sample size and the type of device, equipping everybody with the technology can be expensive. Thus, some studies send loaner devices in batches to participants who, at the end of the data collection period, must return the devices so that they can be reused by other participants (see Scherpenzeel (2017) for a study with loaner smartphones and Doherty et al. (2017) for a study using loaner accelerometers). While loaner devices reduce the investment costs for buying the equipment, additional costs occur because of handling, shipping, and cleaning the devices (see Chapter 3.3).
1.4.2 Nonparticipation
Even if everyone in the target population owns the necessary technology, participation rates in studies collecting data with wearables, apps, and sensors can vary extensively. For example, in the IAB-SMART study, 16 percent of the invited German smartphone owners downloaded a research app that administered survey questions and passively collected multiple types of smartphone data over several months (Kreuter et al. 2020). Scherpenzeel (2017) conducted the Dutch Smartphone Time Use Study that collected survey responses and passively collected GNSS and log files data via loaner smartphones with a cumulative participation rate of 19 percent. In a study by Struminskaya et al. (2021), 46 percent of the invited sample shared their current location once via their smartphones. As part of the Newark Smartphone Reentry Project, Sugie (2018) gave men recently released from prison a smartphone with a research app that collected geolocation and information about calls and text messages, and 63 percent of eligible individuals completed the study. Out of the approximately 240,000 invited sample members in the UK Biobank Study about 43 percent agreed to wear an accelerometer for a week (Doherty et al. 2017).
Nonparticipation in these types of studies correlates with sociodemographic characteristics (i.e., participants are younger and have higher educational attainment), attitudes on privacy, security, and trust, and behavior related to technology use (Keusch et al. 2022). Especially privacy concerns appears to be a driving factor for not being willing to participate in passive mobile data collection (Keusch et al. 2019; Struminskaya, Toepoel, et al. 2020; Toepoel, Luiten, and Zandvliet 2021; Wenz, Jäckle, and Couper 2019). If the reasons for nonparticipation correlate with the measures that are collected in a study (e.g., engaging in certain sensitive behaviors), then nonparticipation bias in these estimates can be expected. For example, a regular patron of the local red-light district might be unwilling to have their location tracked because doing so will likely expose this contra-normative behavior. Likewise, older sample members may not participate because they feel less comfortable using certain technology. At the same time, older people might also be less mobile and less active than younger ones. If mobility and activity are key measures of the study, nonparticipation increases the risk of bias.
1.4.3 Data from WAS are not free of error
While the passive nature of data collection using wearables, apps, and sensors reduces the influence of psychosocial factors known from self-reports (e.g., social desirability, forgetting), other forms of measurement error can occur. These errors can stem from (1) how the data are collected, (2) how study participants engage with a device, and (3) how the raw data are processed and interpreted. First, the measurement of the same phenomenon with two different devices can produce discrepant results depending on the type of device (e.g., smartphone vs. fitness tracker), the sensor used (e.g., GNSS vs. cellular network), where the device is worn (e.g., in a pocket vs. around the wrist), which operating system is used (e.g., Android vs. iOS), and other external factors (e.g., weather conditions, third-party apps).
Second, users differ in their experience and comfort with technology and how they handle the devices. Some people might be more experienced and advanced users than others and use the devices differently. For example, differences in smartphone behavior (e.g., forgetting to charge the device, turning the device off, leaving it at home, not carrying it close to one’s body) can influence the quality of the sensor data and the inferences about everyday activity (Keusch, Wenz, and Conrad 2022).
Third, even if passively measured data are highly accurate, researchers need to bring meaning to the raw sensor data. While some measures are direct and unambiguous records of behaviors (e.g., the number of phone calls recorded in the log files of a smartphone), other phenomena need to be inferred from the raw data. For example, sleep is in many studies inferred from the lack of physical movement detected through the accelerometer, sometimes in combination with data from other sensors (e.g., light sensors, microphone, pulse, body temperature, breathing rate). Passively measuring sleep based on these data bears the risks of misclassifying phenomena (e.g., a smartphone left at home in a bag may be mistaken as evidence that the participant is asleep). On many devices, raw sensor data, for example, from the accelerometer, are pre-processed (i.e., aggregated and classified) to conserve storage space. The processing step leads to a loss of information if only derived measures (e.g., number of steps taken) are available to researchers, which is usually the case when consumer-grade technology is used where the exact processing steps are a black box. What then seems to be objective raw data are often actually the result of considerable processing, often using proprietary and manufacturer-, device- and version-specific algorithms, involving layers of interpretation and aggregation that can be incorrect or inappropriate for the research task at hand.
1.4.4 Privacy and ethics
The unobtrusive, high frequency characteristic of measurement from wearables, apps, and sensors makes data collection much more sensitive than other types of measurement. Consider, for example, location detection where a single GNSS data point about a person’s current location might be relatively innocuous. However, the more frequent the measurement, the more likely it is that specific details of participants’ lives (e.g., where they live or work, where their children go to school) can be inferred from patterns in the data. Participants might also forget after some time that they are even being observed. While this decreases the risk of reactivity in the data collection (see 1.3.4), an ethical question arises about whether study participants need to be repeatedly reminded about passive data collection to truly ensure informed consent. Finally, the data collected through wearables, sensors, and apps might not only reveal information about the study participants but also from others who were never asked for consent. For example, if the microphone on a smartphone is used to collect audio data, voices of people in the participant’s vicinity might be recorded as well. When information about social interactions is recorded through a participant’s smartphone logs and text communication, personal private information about the communication partners (e.g., their names and phone numbers) might be recorded. Researchers collecting these types of data need to address participants’ privacy concerns (e.g., providing clear information about study goals, what data are collected, and how they are used, reducing frequency of measurement, allowing participants to temporarily turn off data collection, using privacy-sensitive audio classifiers, encrypting phone numbers and names).
Figure 1.4 shows an example from the Fitbit app where the user is informed of the need to activate the microphone during sleeping hours in order to track external noise, such as snoring, and the impact of environmental factors on sleep. As one can imagine, sensitive information could be recorded and stored in the Fitbit database. The user should be made aware of this in advance including the full terms and conditions (i.e., privacy policy in this example) and be asked to provide consent to allow the app to access the native microphone on the device itself.
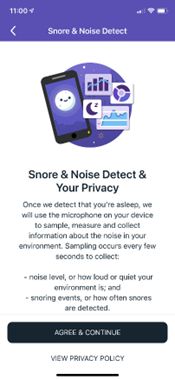
Figure 1.4: A Fitbit user consent screen to allow the app to access the native microphone on the device while the participant is sleeping
1.5 What’s in this book?
This book will provide evidence-based guidance for researchers, students, and practitioners who wish to collect data about human behavior and social interactions using wearables, apps, and sensors (WAS). The data from WAS can be collected stand-alone or in combination with self-reported data such as Ecological Momentary Assessments (EMAs), surveys, or diaries. We will review the research approaches taken by social, behavioral, and health scientists, as well as statistical agencies. Drawing on examples from diverse domains in the social, behavioral, and health sciences, this book will help readers design studies to collect high quality data using WAS.
Many issues that arise when planning a WAS research study are like those encountered in other types of studies: how to recruit participants and the importance of informed consent. However, some issues are unique to WAS studies that should be considered early in the study design phase: providing devices to those who agree to participate and whether to allow participants to use their own devices, as well as issues of data structure, storage, and analysis. The book will focus on opportunities and challenges when collecting WAS data using different technologies and specifically on issues related to measurement and representation. The book will also provide insights on the future of WAS data collection methods.
1.5.1 Outline of the book
We just provided a motivation for why we think that researchers should consider implementing data collection from wearables, apps, and sensors into studies about human behavior and social interactions. We also discussed some of the potential drawbacks of doing so. Next, we focus on specific technologies and how they can be used for data collection (Chapter 2). When describing these technologies, we do not aim for detailed technical sophistication but will operate on a conceptual level that should allow all readers, even if they do not have a technical background, to be able to understand how these technologies operate and what kind of data they can and cannot collect. We are aware that technology is subject to constant change. Thus, this chapter will introduce general concepts of how the technology works that we consider to be rather stable. For example, while with every new generation of sensors, measurement will very likely get better (i.e., more precise), the way how acceleration or geolocation measurement work will probably not change dramatically in the foreseeable future.
Chapter 3 describes practical considerations when implementing WAS data collection into research studies with a focus on the core operational considerations to take into account when designing and carrying out a study such as ethical considerations, obtaining consent, recruitment materials, and data storage considerations.
Next, we dive into the errors that can arise when collecting data in such studies, using the Total Survey Error framework (Biemer 2010). This framework divides errors that can arise in collected data into errors of nonobservation and errors of observation. Two chapters deal with errors of nonobservation: errors that arise because we do not have data on everyone in the population. Chapter 4 discusses issues of coverage and sampling, and Chapter 5 discusses nonparticipation; the reasons behind unwillingness to take part and refusal/dropout from WAS studies and what study design features can influence participation.
The next three chapters deal with errors of observations: errors that occur during the observation process when using WAS. Chapter 6 discusses the issue of construct validity, raising questions about what the measures collected with wearables, apps, and sensors represent and what they don’t. Chapter 7 focuses on problems in the measurement process that lead to measurement error: for example, how well do smartwatches measure cardiac health? Chapter 8 deals with the issue of missing data. We will discuss the reasons for missingness and common methods of dealing with missing data when trying to reconstruct participants’ behavior from sensor data that is prone to missingness.
In Chapter 9, we show examples of working with data from WAS. We will use examples from our own work and the All of Us program. We conclude the book with a look into the future of WAS data collection, including a discussion of novel technologies that are still niche at this point but could be implemented in data collection in the future as well as what societal challenges we think the use of the technology could contribute to (Chapter 10). Each chapter ends with a section “Further reading” in which we point the readers to relevant literature that addresses specific topics in depth.
1.5.2 What is this book not about?
While we cover a large range of technologies and types of data in this book, there are certain things and topics that go beyond the scope of this book. First, while we will provide guidance on how to implement data collection using WAS technology, we will not be able to provide detailed technical instruction, for example, on how to program your own app. Instead, we will point readers to existing platforms that can easily be implemented without a strong technical background. We will guide readers’ decisions on when to use off-the-shelf solutions as opposed to programming technology from scratch, which would require professional assistance that we cannot provide as part of this book.
Second, this is not a book on how to conduct data analysis. While we conceptually discuss how to extract, process, and analyze WAS data and show several examples of how to work with the data from our own research, we do not cover in detail what statistical tests and models should be used when answering specific research questions. If you need help with statistical tests or programs, there are many good introductory textbooks available. For example, “R for Data Science” (Wickham and Grolemund 2017), “Data Analysis Using Stata” (Kohler and Kreuter 2012), “Regression and Other Stories” (Gelman 2020), and others.
Third, we do not cover the collection and use of what has come to be known as “found” (S. J. Taylor 2013) or “ready-made” (Salganik 2018) data, including data from social media platforms, mobile network operators, Internet searches, and other processes that happen independently of social researcher. While these data share many of the characteristics of the data from WAS (e.g., high frequency of data collection, passive data collection), they need to be repurposed to be useful for research. Our focus is entirely on data collection that is initiated and designed with a specific research question in mind.
1.6 How to read and use this book?
We wrote this book with a diverse audience from different backgrounds in mind, and we hope that it is useful for teaching and learning as well as when designing your own research study. Throughout the book, we draw on examples from different fields, to make the book applicable to readers from various disciplines and with varying research objectives. We have used the materials presented in the book in our own teaching and we draw on experience from our own research to make this book as applicable an hands-on as possible. No prior statistical nor technical training will be necessary to read or benefit from the book. For some chapters, a basic understanding of statistical methods and research design will be helpful. No matter how you might wish to use this book, we would love to hear your feedback on the topics, the practical exercises, and everything related to this book!
1.6.1 If you are a student,…
…this book or sections of this book might have been assigned to you as reading material for a general research, study design methods, or data collection course. We have provided practical examples for you in all chapters that will give you a good understanding on how WAS can be used in combination with other, more traditional data collection methods, such as EMAs, diaries, and surveys. If you are planning such data collection for your Bachelor’s, Master’s, or PhD thesis, the book will give you important pointers on how to get started.
1.6.2 If you are a researcher or practitioner,…
…this book will help you design studies using new technologies to collect (and analyze) data. The materials of this book have been proven useful for practitioners from organizations such as government statistical offices, non-profits, university research centers, and for-profit companies. We cover a variety of topics within social, behavioral, and health sciences, and while our main focus is on designing data collection, if you have data from smartphones, apps, and/or wearables, this book will be useful for those who wish to learn about data-generating mechanisms to understand data quality when performing secondary analysis.
1.6.3 If you are an instructor,…
…you might find this book useful as a supplementary reading for general social science methods courses or as a main textbook for specialized courses focusing on using wearables, apps, and sensors in the social, behavioral, and health sciences. We have used the materials that have become this book in courses with a wide range of participants who have come from diverse fields and organizations.