Chapter 8 Cross-Tabulation
This chapter provides generic code for generating a contingency table and carrying out a chi-square test of independence. It is recommended that you proceed through the sections in the order they appear.
Placeholders that need replacing:
- mydata – name of your dataset
- rowvar – name of your row variable (usually your causal factor)
- colvar – name of your column variable (usually your outcome)
- object – whatever you want to call your object(s))
- label – any titles, axis labels, category labels
8.1 Packages Needed for Cross-Tab
This code will check that required packages for this chapter are installed, install them if needed, and load them into your session.
req <- substitute(require(x, character.only = TRUE))
libs<-c("sjPlot")
sapply(libs, function(x) eval(req) || {install.packages(x); eval(req)})
8.2 Data Prep for Cross-Tab
I recommend consulting the resources on knowing your data and data prep. You may want to add category labels and potentially collapse categories.
8.3 Cross-Tabulation, Chi-Square Test of Independence, and Effect Size
The sjPlot package allows us to conduct the cross-tabulation and chi-square test of independence at the same time using its tab_xtab() function. The command produces a html contingency table, chi-square test results, and Cramer’s V statistic.
sjPlot::tab_xtab(var.row = mydata$rowvar, var.col = mydata$colvar, title = "Table Title", show.row.prc = TRUE)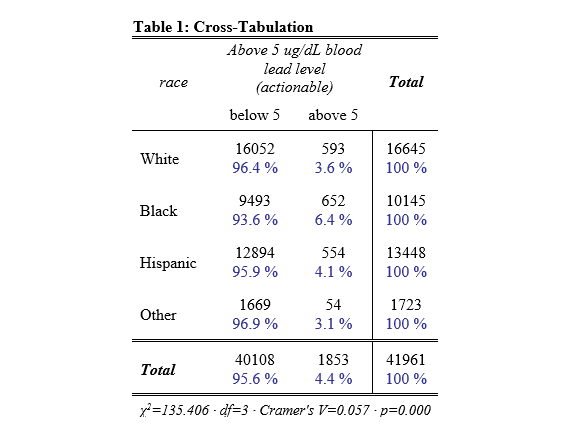
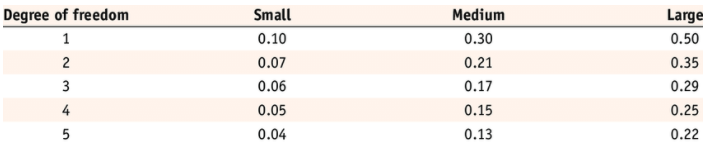
Interpretation of Cramer’s V is contingent on the degree of freedom. The following table offers guidance on the appropriate characterization of V.
8.4 Graphing Options for Cross-Tab
A table is often your best bet for representing a contingency table. Beyond the table, you might consider your graphing options, which include a mosaicplot or sjPlot’s bar graph plot.
I also encourage you to check out the R Graph Gallery, a website that showcases different graphs and provides their associated code.
In this series of commands, the first command generates an object containing the cross-tab results. The mosaicplot command then translates that object into a mosaic plot.
object <- table(mydata$rowvar, mydata$colvar)
mosaicplot(object, main = "Title of Graph", xlab = "X-axis label", ylab = "Y-axis label", color = TRUE)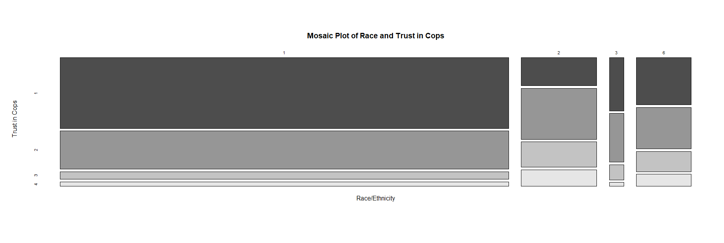
Alternatively, the sjPlot package allows us to generate a stacked bar chart.
sjPlot::plot_xtab(mydata$rowvar, mydata$colvar, margin = "row", bar.pos = "stack", coord.flip = TRUE)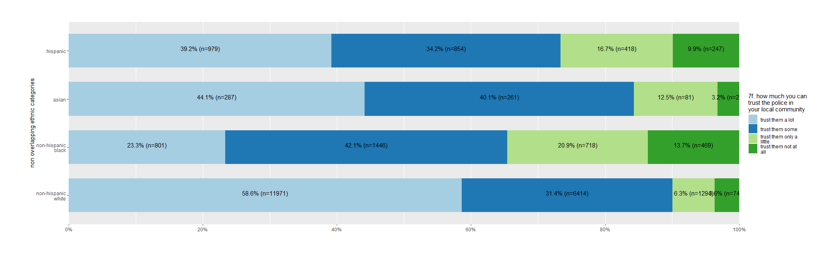
8.5 Consolidated Code for Cross-Tab
Below is the consolidated code from this chapter. One could transfer this code into an empty RScript, which also offers the option of find/replace terms. You can also download the generic cross-tab RScript file here.
Placeholders that need replacing:
- mydata – name of your dataset
- rowvar – name of your row variable (usually your causal factor)
- colvar – name of your column variable (usually your outcome)
- object – whatever you want to call your object(s))
- label – any titles, axis labels, category labels
# 7.1   Packages Needed

  req <- substitute(require(x, character.only = TRUE))
  libs<-c("sjPlot")
  sapply(libs, function(x) eval(req) || {install.packages(x); eval(req)})


# 7.2 Know your data and prep as needed


# 7.3 Conduct the cross-tabulation and chi-square test at the same time using sjPlot’s tab_xtab() function,
#       which (produces html contingency table, chi-square test results, and Cramer’s V)

    sjPlot::tab_xtab(var.row = mydata$rowvar, var.col = mydata$colvar, title = "Table Title", show.row.prc = TRUE)


# 7.4 Graphing Options

## A table is often your best bet for representing a contingency table. Beyond the table,
## you might consider your graphing options, which include a mosaicplot or sjPlot’s bar graph plot.

## mosaicplot

        object <- table(mydata$rowvar, mydata$colvar)
        mosaicplot(object, main = "Title of Graph", xlab = "X-axis label", ylab = "Y-axis label", color = TRUE)

## sjPlot’s plot_xtab() function
        sjPlot::plot_xtab(mydata$rowvar, mydata$colvar, margin = "row", bar.pos = "stack", coord.flip = TRUE)