Automated Fiber Quantification
If you have used results from this software for a publication, please use this citation (Yeatman, Dougherty, Myall, Wandell, & Feldman, 2012).
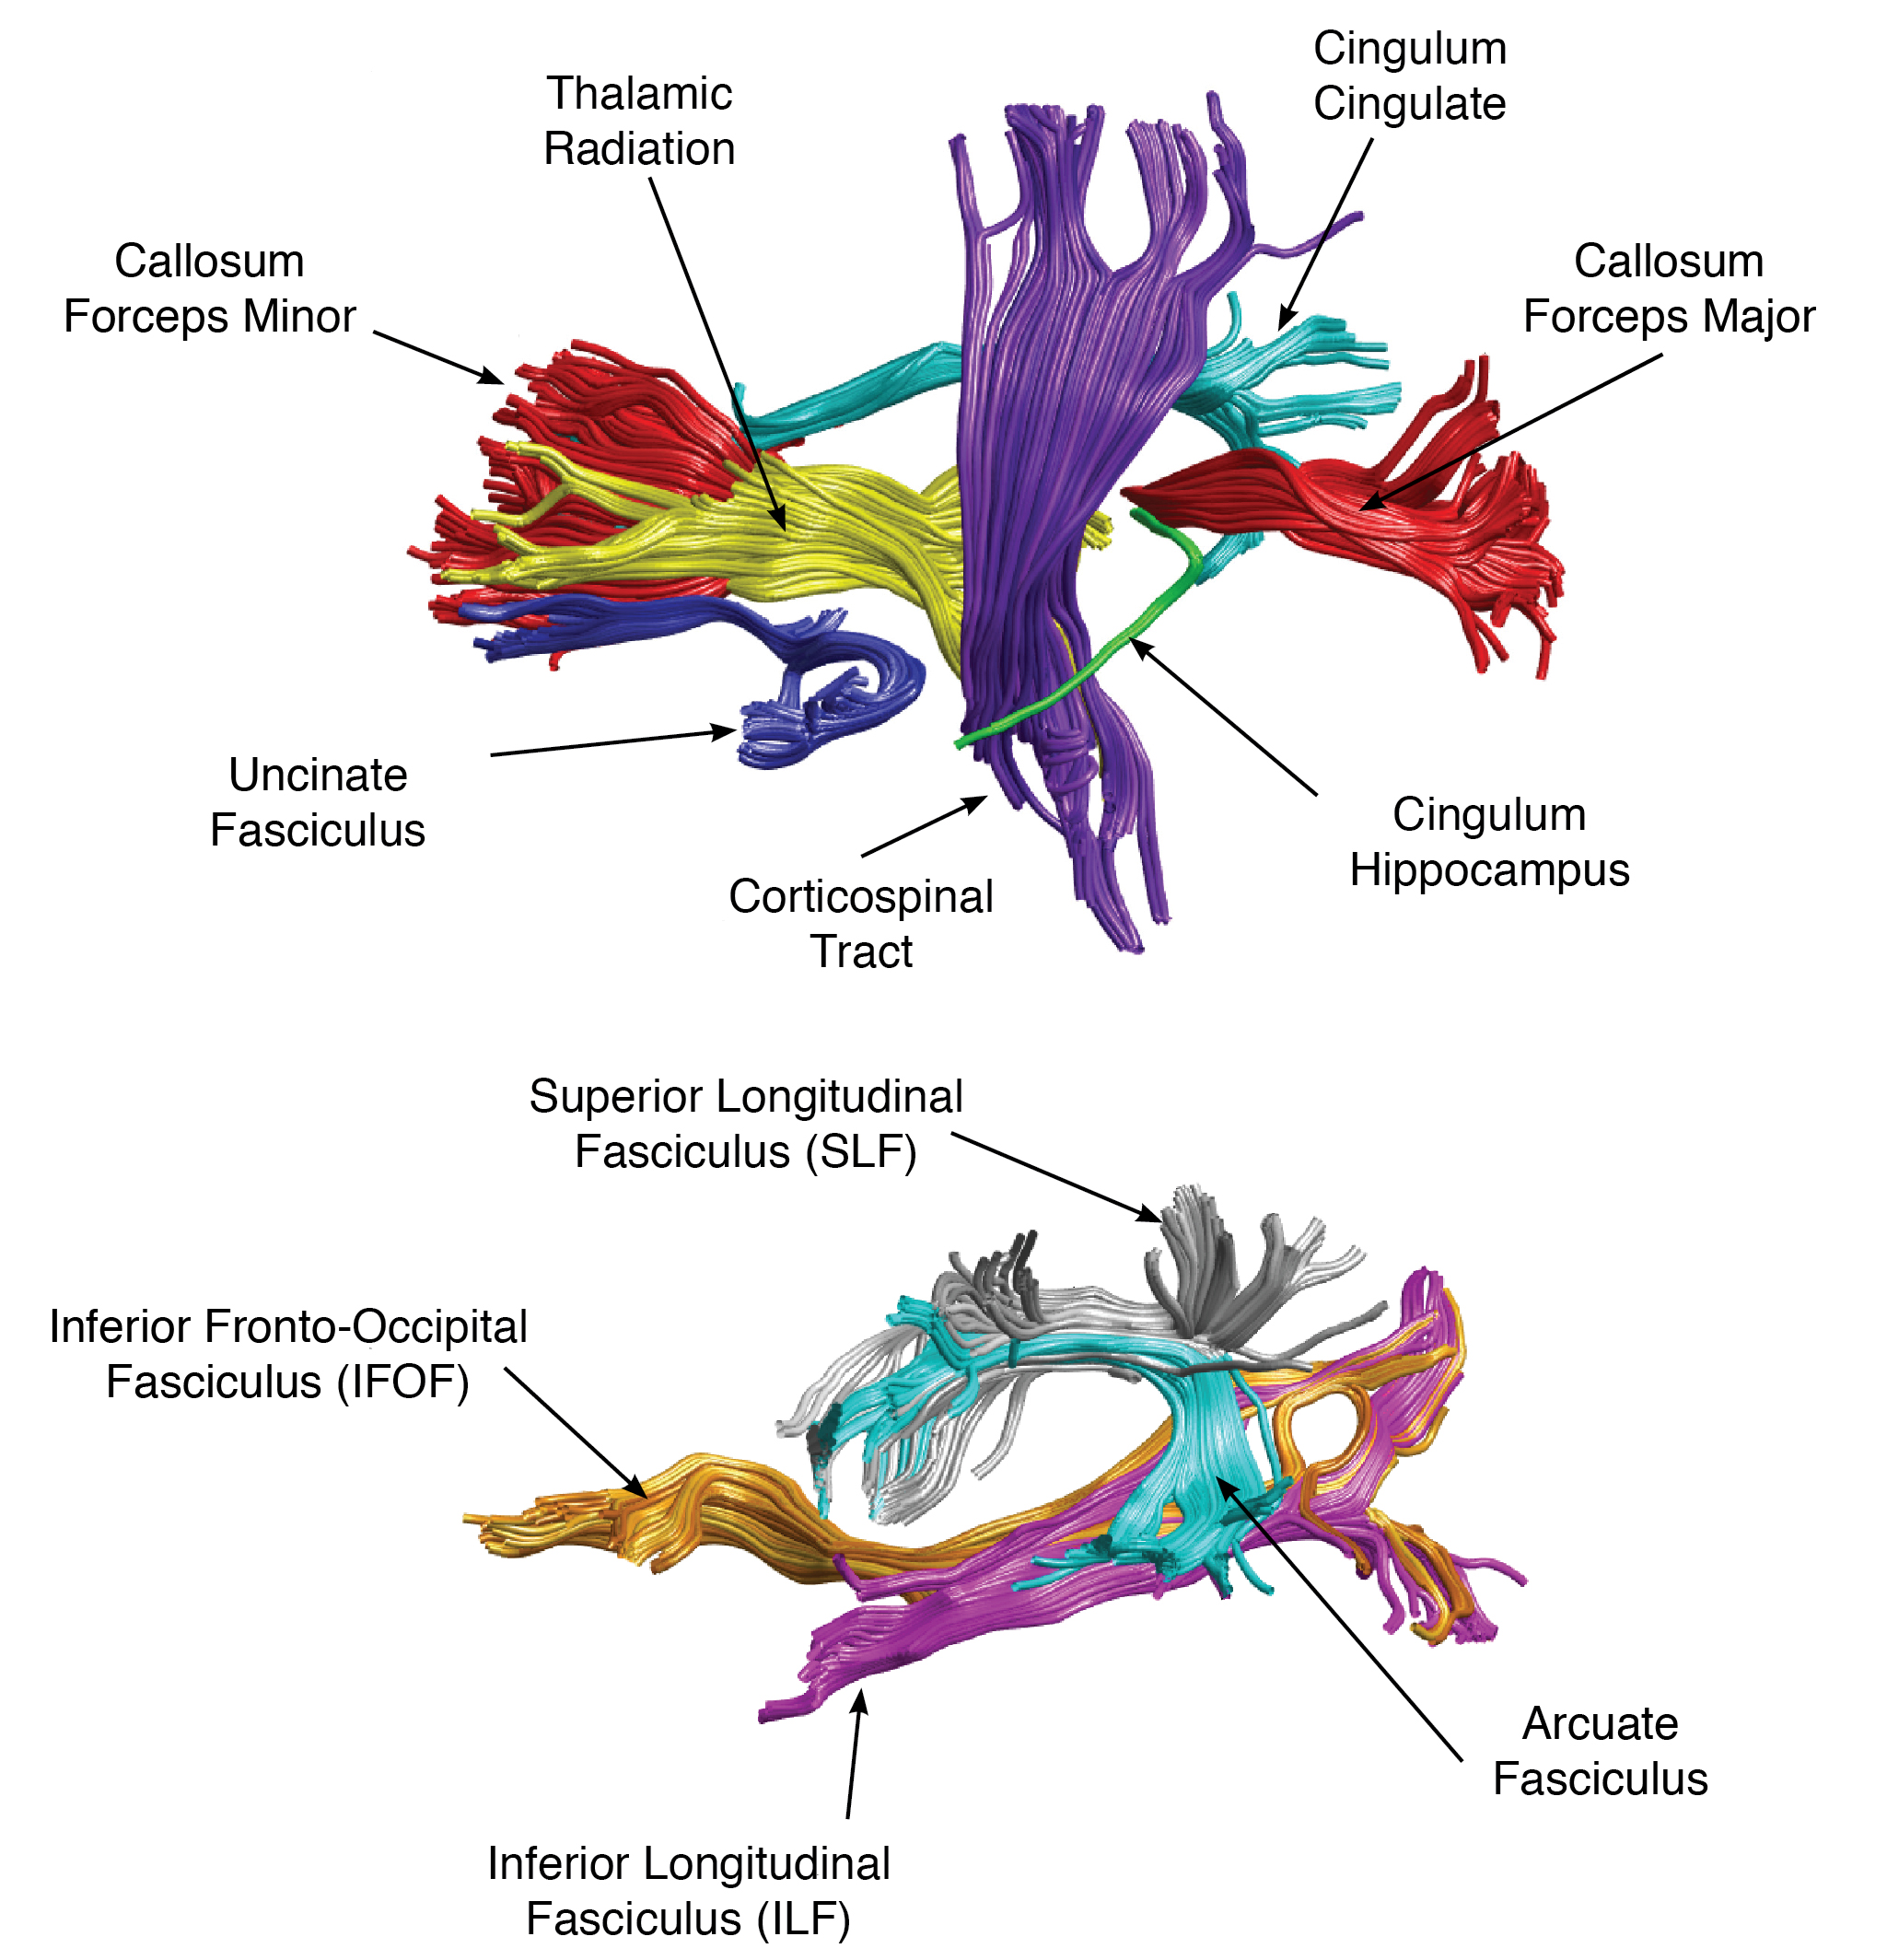
Automated Fiber Quantification version 1.2 (https://github.com/yeatmanlab/AFQ) identifies twenty major fiber tracts that include the corticospinal tract, inferior longitudinal fasciculus, inferior fronto-occipital fasciculus, uncinate fasciculus, anterior thalamic radiation, cingulum cingulate gyrus and hippocampal bundles, superior longitudinal fasciculus, arcuate fasciculus, and forceps major and forceps minor of the corpus callosum. For each identified pathway, fractional anisotropy (FA), mean diffusivity (MD), radial diffusivity (RD), and axial diffusivity (AD) are extracted along 100 segments of the tract.
From the AFQ wiki:
At present, AFQ uses functions from mrDiffusion, a component of vistasoft. We plan to implement AFQ in a docker container that can be invokved as a standalone routine. The AFQ pipeline is briefly described below. The main steps in the pipeline are linked to a detailed description of the function.
Preprocessing steps involve computing the means B0 if there are more than one B0 collected. Next step is eddy current correction which involves aligning all the volumes back to the average B0. Images are then aligned to a T1 which help correct EPI distortions. Images are resampled to 2-mm isotropic. The bvecs have to be reoriented before tensors are calculated since the volumes have moved. Finally, whole brain tensors are calculated.
If you need more information about preprocessing: http://web.stanford.edu/group/vista/cgi-bin/wiki/index.php/DTI_Preprocessing
AFQ requires that the data be [preprocessed in mrDiffusion with dtiInit to create a dt6.mat file (or processed in another software program and imported into mrDiffusion format). AFQ_run is the main routine to analyze group data. This function runs the full automated pipeline and is extensively documented. The example in help AFQ_run analyzes a data set that is included in the repository. For single subject analysis, see AFQ_example.m.
Inputs into AFQ_run are a cell array of paths to subject’s DTI data and, if there are two groups of subjects, a binary vector of 0s and 1s identifying subjects as patients (1) or controls (0). If two groups are provided AFQ_run will output plots of the normal range of the desired diffusion measurement (FA, RD etc.) along each of 20 major fiber tracts. Each subject that is outside this normal range on a given tract will be flagged and plotted with respect to the controls. It will also automatically perform group comparisons for each Tract Profile and plot out the results. If only one group of subjects is provided then the segmented fiber groups and Tract Profiles will be returned.
If you need more information about AFQ: https://github.com/yeatmanlab/AFQ/wiki

Files
List of files will include DTI measures from each of the 20 fiber tracts at 100 segments along each tract:
- afq-FA.csv
- afq-RD.csv
- afq-MD.csv
- afq-AD.csv
Head motion:
- afq-motion.csv