Chapter 4 Data Transformation with dplyr
Chapter 3 covers the following topics:
- Filter Rows with filter()
- Arrange Rows with arrange()
- Select Columns with select()
- Add New Variables with mutate()
- Grouped Summaries with summarize()
4.1 filter
We are using the built-in data-set "nycflights13" to demonstrate frequently-used functions for data manipulation:
# call the "nycflights13" package and the "tidyverse" package
library(nycflights13)
library(tidyverse)
# take a look at variables names and our data
names(flights)
## [1] "year" "month" "day" "dep_time" "sched_dep_time" "dep_delay"
## [7] "arr_time" "sched_arr_time" "arr_delay" "carrier" "flight" "tailnum"
## [13] "origin" "dest" "air_time" "distance" "hour" "minute"
## [19] "time_hour"sample_n(flights, 10)## # A tibble: 10 x 19
## year month day dep_time sched_dep_time dep_delay arr_time sched_arr_time arr_delay carrier flight tailnum origin
## <int> <int> <int> <int> <int> <dbl> <int> <int> <dbl> <chr> <int> <chr> <chr>
## 1 2013 11 17 1919 1920 -1 2242 2243 -1 B6 71 N552JB JFK
## 2 2013 3 10 642 645 -3 907 907 0 DL 2006 N347NB LGA
## 3 2013 10 15 1749 1755 -6 2035 2055 -20 AA 1185 N3CKAA LGA
## 4 2013 12 23 1705 1700 5 2039 2039 0 UA 512 N510UA JFK
## 5 2013 7 18 623 630 -7 725 750 -25 EV 4241 N11189 EWR
## 6 2013 12 12 1853 1825 28 2236 2120 76 B6 543 N653JB EWR
## 7 2013 7 8 1726 1519 127 2019 1820 119 UA 996 N561UA EWR
## 8 2013 4 16 1736 1740 -4 2033 2036 -3 B6 9 N534JB JFK
## 9 2013 6 1 1550 1555 -5 1819 1844 -25 DL 161 N3737C JFK
## 10 2013 11 27 952 940 12 1054 1110 -16 WN 3086 N467WN LGA
## # … with 6 more variables: dest <chr>, air_time <dbl>, distance <dbl>, hour <dbl>, minute <dbl>, time_hour <dttm>#filter rows with filter
head(flights %>% filter(month==1, day==1))## # A tibble: 6 x 19
## year month day dep_time sched_dep_time dep_delay arr_time sched_arr_time arr_delay carrier flight tailnum origin
## <int> <int> <int> <int> <int> <dbl> <int> <int> <dbl> <chr> <int> <chr> <chr>
## 1 2013 1 1 517 515 2 830 819 11 UA 1545 N14228 EWR
## 2 2013 1 1 533 529 4 850 830 20 UA 1714 N24211 LGA
## 3 2013 1 1 542 540 2 923 850 33 AA 1141 N619AA JFK
## 4 2013 1 1 544 545 -1 1004 1022 -18 B6 725 N804JB JFK
## 5 2013 1 1 554 600 -6 812 837 -25 DL 461 N668DN LGA
## 6 2013 1 1 554 558 -4 740 728 12 UA 1696 N39463 EWR
## # … with 6 more variables: dest <chr>, air_time <dbl>, distance <dbl>, hour <dbl>, minute <dbl>, time_hour <dttm>range(flights$year)## [1] 2013 2013head(filter(flights, month==1, day==1))## # A tibble: 6 x 19
## year month day dep_time sched_dep_time dep_delay arr_time sched_arr_time arr_delay carrier flight tailnum origin
## <int> <int> <int> <int> <int> <dbl> <int> <int> <dbl> <chr> <int> <chr> <chr>
## 1 2013 1 1 517 515 2 830 819 11 UA 1545 N14228 EWR
## 2 2013 1 1 533 529 4 850 830 20 UA 1714 N24211 LGA
## 3 2013 1 1 542 540 2 923 850 33 AA 1141 N619AA JFK
## 4 2013 1 1 544 545 -1 1004 1022 -18 B6 725 N804JB JFK
## 5 2013 1 1 554 600 -6 812 837 -25 DL 461 N668DN LGA
## 6 2013 1 1 554 558 -4 740 728 12 UA 1696 N39463 EWR
## # … with 6 more variables: dest <chr>, air_time <dbl>, distance <dbl>, hour <dbl>, minute <dbl>, time_hour <dttm>head(jan1 <- filter(flights, month==1, day==1))## # A tibble: 6 x 19
## year month day dep_time sched_dep_time dep_delay arr_time sched_arr_time arr_delay carrier flight tailnum origin
## <int> <int> <int> <int> <int> <dbl> <int> <int> <dbl> <chr> <int> <chr> <chr>
## 1 2013 1 1 517 515 2 830 819 11 UA 1545 N14228 EWR
## 2 2013 1 1 533 529 4 850 830 20 UA 1714 N24211 LGA
## 3 2013 1 1 542 540 2 923 850 33 AA 1141 N619AA JFK
## 4 2013 1 1 544 545 -1 1004 1022 -18 B6 725 N804JB JFK
## 5 2013 1 1 554 600 -6 812 837 -25 DL 461 N668DN LGA
## 6 2013 1 1 554 558 -4 740 728 12 UA 1696 N39463 EWR
## # … with 6 more variables: dest <chr>, air_time <dbl>, distance <dbl>, hour <dbl>, minute <dbl>, time_hour <dttm>head((dec25 <- filter(flights, month==12, day==25)))## # A tibble: 6 x 19
## year month day dep_time sched_dep_time dep_delay arr_time sched_arr_time arr_delay carrier flight tailnum origin
## <int> <int> <int> <int> <int> <dbl> <int> <int> <dbl> <chr> <int> <chr> <chr>
## 1 2013 12 25 456 500 -4 649 651 -2 US 1895 N156UW EWR
## 2 2013 12 25 524 515 9 805 814 -9 UA 1016 N32404 EWR
## 3 2013 12 25 542 540 2 832 850 -18 AA 2243 N5EBAA JFK
## 4 2013 12 25 546 550 -4 1022 1027 -5 B6 939 N665JB JFK
## 5 2013 12 25 556 600 -4 730 745 -15 AA 301 N3JLAA LGA
## 6 2013 12 25 557 600 -3 743 752 -9 DL 731 N369NB LGA
## # … with 6 more variables: dest <chr>, air_time <dbl>, distance <dbl>, hour <dbl>, minute <dbl>, time_hour <dttm>Notice that R does not automatically simplify math
#comparisons
#floating-point numbers: this is something interesting to know
sqrt(2)^2==2
## [1] FALSE1/49*49==1## [1] FALSEnear(sqrt(2)^2, 2, tol = 0.000000001)## [1] TRUEnear(1/49*49, 1) #with a certain tolarance## [1] TRUELet's continue with the "flights" data
head(nov_dec <- filter(flights, month %in% c(11,12)))## # A tibble: 6 x 19
## year month day dep_time sched_dep_time dep_delay arr_time sched_arr_time arr_delay carrier flight tailnum origin
## <int> <int> <int> <int> <int> <dbl> <int> <int> <dbl> <chr> <int> <chr> <chr>
## 1 2013 11 1 5 2359 6 352 345 7 B6 745 N568JB JFK
## 2 2013 11 1 35 2250 105 123 2356 87 B6 1816 N353JB JFK
## 3 2013 11 1 455 500 -5 641 651 -10 US 1895 N192UW EWR
## 4 2013 11 1 539 545 -6 856 827 29 UA 1714 N38727 LGA
## 5 2013 11 1 542 545 -3 831 855 -24 AA 2243 N5CLAA JFK
## 6 2013 11 1 549 600 -11 912 923 -11 UA 303 N595UA JFK
## # … with 6 more variables: dest <chr>, air_time <dbl>, distance <dbl>, hour <dbl>, minute <dbl>, time_hour <dttm>head(filter(flights, month==11 | month==12))## # A tibble: 6 x 19
## year month day dep_time sched_dep_time dep_delay arr_time sched_arr_time arr_delay carrier flight tailnum origin
## <int> <int> <int> <int> <int> <dbl> <int> <int> <dbl> <chr> <int> <chr> <chr>
## 1 2013 11 1 5 2359 6 352 345 7 B6 745 N568JB JFK
## 2 2013 11 1 35 2250 105 123 2356 87 B6 1816 N353JB JFK
## 3 2013 11 1 455 500 -5 641 651 -10 US 1895 N192UW EWR
## 4 2013 11 1 539 545 -6 856 827 29 UA 1714 N38727 LGA
## 5 2013 11 1 542 545 -3 831 855 -24 AA 2243 N5CLAA JFK
## 6 2013 11 1 549 600 -11 912 923 -11 UA 303 N595UA JFK
## # … with 6 more variables: dest <chr>, air_time <dbl>, distance <dbl>, hour <dbl>, minute <dbl>, time_hour <dttm>#find flights that weren't delayed by more than two hours
head(filter(flights, !(arr_delay>120 | dep_delay>120)))## # A tibble: 6 x 19
## year month day dep_time sched_dep_time dep_delay arr_time sched_arr_time arr_delay carrier flight tailnum origin
## <int> <int> <int> <int> <int> <dbl> <int> <int> <dbl> <chr> <int> <chr> <chr>
## 1 2013 1 1 517 515 2 830 819 11 UA 1545 N14228 EWR
## 2 2013 1 1 533 529 4 850 830 20 UA 1714 N24211 LGA
## 3 2013 1 1 542 540 2 923 850 33 AA 1141 N619AA JFK
## 4 2013 1 1 544 545 -1 1004 1022 -18 B6 725 N804JB JFK
## 5 2013 1 1 554 600 -6 812 837 -25 DL 461 N668DN LGA
## 6 2013 1 1 554 558 -4 740 728 12 UA 1696 N39463 EWR
## # … with 6 more variables: dest <chr>, air_time <dbl>, distance <dbl>, hour <dbl>, minute <dbl>, time_hour <dttm>head(filter(flights, arr_delay<=120 & dep_delay<=120))## # A tibble: 6 x 19
## year month day dep_time sched_dep_time dep_delay arr_time sched_arr_time arr_delay carrier flight tailnum origin
## <int> <int> <int> <int> <int> <dbl> <int> <int> <dbl> <chr> <int> <chr> <chr>
## 1 2013 1 1 517 515 2 830 819 11 UA 1545 N14228 EWR
## 2 2013 1 1 533 529 4 850 830 20 UA 1714 N24211 LGA
## 3 2013 1 1 542 540 2 923 850 33 AA 1141 N619AA JFK
## 4 2013 1 1 544 545 -1 1004 1022 -18 B6 725 N804JB JFK
## 5 2013 1 1 554 600 -6 812 837 -25 DL 461 N668DN LGA
## 6 2013 1 1 554 558 -4 740 728 12 UA 1696 N39463 EWR
## # … with 6 more variables: dest <chr>, air_time <dbl>, distance <dbl>, hour <dbl>, minute <dbl>, time_hour <dttm>A few words about NA missing values
#missing values
NA>5
## [1] NA10==NA## [1] NANA+10## [1] NANA/2## [1] NANA==NA## [1] NA(x<-NA)## [1] NA(y<-NA)## [1] NAx==y## [1] NAis.na(x)## [1] TRUE(df <- tibble(x=c(1,NA,3)))## # A tibble: 3 x 1
## x
## <dbl>
## 1 1
## 2 NA
## 3 3filter(df, x>1)## # A tibble: 1 x 1
## x
## <dbl>
## 1 3filter(df, is.na(x) | x>1)## # A tibble: 2 x 1
## x
## <dbl>
## 1 NA
## 2 34.2 arrange
head((arrange(flights, year, month, day)))## # A tibble: 6 x 19
## year month day dep_time sched_dep_time dep_delay arr_time sched_arr_time arr_delay carrier flight tailnum origin
## <int> <int> <int> <int> <int> <dbl> <int> <int> <dbl> <chr> <int> <chr> <chr>
## 1 2013 1 1 517 515 2 830 819 11 UA 1545 N14228 EWR
## 2 2013 1 1 533 529 4 850 830 20 UA 1714 N24211 LGA
## 3 2013 1 1 542 540 2 923 850 33 AA 1141 N619AA JFK
## 4 2013 1 1 544 545 -1 1004 1022 -18 B6 725 N804JB JFK
## 5 2013 1 1 554 600 -6 812 837 -25 DL 461 N668DN LGA
## 6 2013 1 1 554 558 -4 740 728 12 UA 1696 N39463 EWR
## # … with 6 more variables: dest <chr>, air_time <dbl>, distance <dbl>, hour <dbl>, minute <dbl>, time_hour <dttm>head(arrange(flights, desc(dep_delay))) #increasing order by default## # A tibble: 6 x 19
## year month day dep_time sched_dep_time dep_delay arr_time sched_arr_time arr_delay carrier flight tailnum origin
## <int> <int> <int> <int> <int> <dbl> <int> <int> <dbl> <chr> <int> <chr> <chr>
## 1 2013 1 9 641 900 1301 1242 1530 1272 HA 51 N384HA JFK
## 2 2013 6 15 1432 1935 1137 1607 2120 1127 MQ 3535 N504MQ JFK
## 3 2013 1 10 1121 1635 1126 1239 1810 1109 MQ 3695 N517MQ EWR
## 4 2013 9 20 1139 1845 1014 1457 2210 1007 AA 177 N338AA JFK
## 5 2013 7 22 845 1600 1005 1044 1815 989 MQ 3075 N665MQ JFK
## 6 2013 4 10 1100 1900 960 1342 2211 931 DL 2391 N959DL JFK
## # … with 6 more variables: dest <chr>, air_time <dbl>, distance <dbl>, hour <dbl>, minute <dbl>, time_hour <dttm>(df <- tibble(x=c(5,2,NA)))## # A tibble: 3 x 1
## x
## <dbl>
## 1 5
## 2 2
## 3 NA#missing values are always sorted at the end
arrange(df,x)## # A tibble: 3 x 1
## x
## <dbl>
## 1 2
## 2 5
## 3 NAarrange(df, desc(x))## # A tibble: 3 x 1
## x
## <dbl>
## 1 5
## 2 2
## 3 NA4.3 select
There are functions conflict with each other from the "plyr" and "dplyr" packages, for instance, the rename() function. Make sure to use these functions carefully, by either detaching the conflicting ones or by specifying the compatible functions.
#select columns by name
head(select(flights, year, month, day))
## # A tibble: 6 x 3
## year month day
## <int> <int> <int>
## 1 2013 1 1
## 2 2013 1 1
## 3 2013 1 1
## 4 2013 1 1
## 5 2013 1 1
## 6 2013 1 1head(select(flights, year:day))## # A tibble: 6 x 3
## year month day
## <int> <int> <int>
## 1 2013 1 1
## 2 2013 1 1
## 3 2013 1 1
## 4 2013 1 1
## 5 2013 1 1
## 6 2013 1 1head(select(flights, -(year:day)))## # A tibble: 6 x 16
## dep_time sched_dep_time dep_delay arr_time sched_arr_time arr_delay carrier flight tailnum origin dest air_time
## <int> <int> <dbl> <int> <int> <dbl> <chr> <int> <chr> <chr> <chr> <dbl>
## 1 517 515 2 830 819 11 UA 1545 N14228 EWR IAH 227
## 2 533 529 4 850 830 20 UA 1714 N24211 LGA IAH 227
## 3 542 540 2 923 850 33 AA 1141 N619AA JFK MIA 160
## 4 544 545 -1 1004 1022 -18 B6 725 N804JB JFK BQN 183
## 5 554 600 -6 812 837 -25 DL 461 N668DN LGA ATL 116
## 6 554 558 -4 740 728 12 UA 1696 N39463 EWR ORD 150
## # … with 4 more variables: distance <dbl>, hour <dbl>, minute <dbl>, time_hour <dttm>names(flights)## [1] "year" "month" "day" "dep_time" "sched_dep_time" "dep_delay"
## [7] "arr_time" "sched_arr_time" "arr_delay" "carrier" "flight" "tailnum"
## [13] "origin" "dest" "air_time" "distance" "hour" "minute"
## [19] "time_hour"names(plyr::rename(flights, c(tailnum="tail_num", minute="mi_nute")))## [1] "year" "month" "day" "dep_time" "sched_dep_time" "dep_delay"
## [7] "arr_time" "sched_arr_time" "arr_delay" "carrier" "flight" "tail_num"
## [13] "origin" "dest" "air_time" "distance" "hour" "mi_nute"
## [19] "time_hour"names(flights)## [1] "year" "month" "day" "dep_time" "sched_dep_time" "dep_delay"
## [7] "arr_time" "sched_arr_time" "arr_delay" "carrier" "flight" "tailnum"
## [13] "origin" "dest" "air_time" "distance" "hour" "minute"
## [19] "time_hour"head(select(flights, time_hour, air_time, everything()))## # A tibble: 6 x 19
## time_hour air_time year month day dep_time sched_dep_time dep_delay arr_time sched_arr_time arr_delay
## <dttm> <dbl> <int> <int> <int> <int> <int> <dbl> <int> <int> <dbl>
## 1 2013-01-01 05:00:00 227 2013 1 1 517 515 2 830 819 11
## 2 2013-01-01 05:00:00 227 2013 1 1 533 529 4 850 830 20
## 3 2013-01-01 05:00:00 160 2013 1 1 542 540 2 923 850 33
## 4 2013-01-01 05:00:00 183 2013 1 1 544 545 -1 1004 1022 -18
## 5 2013-01-01 06:00:00 116 2013 1 1 554 600 -6 812 837 -25
## 6 2013-01-01 05:00:00 150 2013 1 1 554 558 -4 740 728 12
## # … with 8 more variables: carrier <chr>, flight <int>, tailnum <chr>, origin <chr>, dest <chr>, distance <dbl>,
## # hour <dbl>, minute <dbl>4.4 mutate
#add new variables with mutate
names(flights)
## [1] "year" "month" "day" "dep_time" "sched_dep_time" "dep_delay"
## [7] "arr_time" "sched_arr_time" "arr_delay" "carrier" "flight" "tailnum"
## [13] "origin" "dest" "air_time" "distance" "hour" "minute"
## [19] "time_hour"head(flights_sml <- select(flights,
year:day,
ends_with("delay"),
distance,
air_time))## # A tibble: 6 x 7
## year month day dep_delay arr_delay distance air_time
## <int> <int> <int> <dbl> <dbl> <dbl> <dbl>
## 1 2013 1 1 2 11 1400 227
## 2 2013 1 1 4 20 1416 227
## 3 2013 1 1 2 33 1089 160
## 4 2013 1 1 -1 -18 1576 183
## 5 2013 1 1 -6 -25 762 116
## 6 2013 1 1 -4 12 719 150head(mutate(flights_sml,
gain=arr_delay-dep_delay,
speed=distance/air_time*60))## # A tibble: 6 x 9
## year month day dep_delay arr_delay distance air_time gain speed
## <int> <int> <int> <dbl> <dbl> <dbl> <dbl> <dbl> <dbl>
## 1 2013 1 1 2 11 1400 227 9 370.
## 2 2013 1 1 4 20 1416 227 16 374.
## 3 2013 1 1 2 33 1089 160 31 408.
## 4 2013 1 1 -1 -18 1576 183 -17 517.
## 5 2013 1 1 -6 -25 762 116 -19 394.
## 6 2013 1 1 -4 12 719 150 16 288.#you can refer to columns that you've just created:
mutate(flights_sml,
gain=arr_delay-dep_delay,
hours=air_time/60,
gain_per_hour=gain/hours)## # A tibble: 336,776 x 10
## year month day dep_delay arr_delay distance air_time gain hours gain_per_hour
## <int> <int> <int> <dbl> <dbl> <dbl> <dbl> <dbl> <dbl> <dbl>
## 1 2013 1 1 2 11 1400 227 9 3.78 2.38
## 2 2013 1 1 4 20 1416 227 16 3.78 4.23
## 3 2013 1 1 2 33 1089 160 31 2.67 11.6
## 4 2013 1 1 -1 -18 1576 183 -17 3.05 -5.57
## 5 2013 1 1 -6 -25 762 116 -19 1.93 -9.83
## 6 2013 1 1 -4 12 719 150 16 2.5 6.4
## 7 2013 1 1 -5 19 1065 158 24 2.63 9.11
## 8 2013 1 1 -3 -14 229 53 -11 0.883 -12.5
## 9 2013 1 1 -3 -8 944 140 -5 2.33 -2.14
## 10 2013 1 1 -2 8 733 138 10 2.3 4.35
## # … with 336,766 more rows#only want to keep the new variables:
transmute(flights,
gain=arr_delay-dep_delay,
hours=air_time/60,
gain_per_hour=gain/hours)## # A tibble: 336,776 x 3
## gain hours gain_per_hour
## <dbl> <dbl> <dbl>
## 1 9 3.78 2.38
## 2 16 3.78 4.23
## 3 31 2.67 11.6
## 4 -17 3.05 -5.57
## 5 -19 1.93 -9.83
## 6 16 2.5 6.4
## 7 24 2.63 9.11
## 8 -11 0.883 -12.5
## 9 -5 2.33 -2.14
## 10 10 2.3 4.35
## # … with 336,766 more rows#creation functions
transmute(flights,
dep_time,
hour=dep_time %/% 60,
minute=dep_time %% 60)## # A tibble: 336,776 x 3
## dep_time hour minute
## <int> <dbl> <dbl>
## 1 517 8 37
## 2 533 8 53
## 3 542 9 2
## 4 544 9 4
## 5 554 9 14
## 6 554 9 14
## 7 555 9 15
## 8 557 9 17
## 9 557 9 17
## 10 558 9 18
## # … with 336,766 more rows4.5 lag, lead, and rank
Note that rank function in R speaks to positions rather than values. Be careful to use rank.
(x<-1:10)## [1] 1 2 3 4 5 6 7 8 9 10lag(x)## [1] NA 1 2 3 4 5 6 7 8 9lead(x)## [1] 2 3 4 5 6 7 8 9 10 NAcumsum(x)## [1] 1 3 6 10 15 21 28 36 45 55cummean(x)## [1] 1.0 1.5 2.0 2.5 3.0 3.5 4.0 4.5 5.0 5.5#ranking
(y<-c(1,2,2,NA,3,4))## [1] 1 2 2 NA 3 4min_rank(y)## [1] 1 2 2 NA 4 5min_rank(desc(y))## [1] 5 3 3 NA 2 1row_number(y)## [1] 1 2 3 NA 4 5dense_rank(y)## [1] 1 2 2 NA 3 4percent_rank(y)## [1] 0.00 0.25 0.25 NA 0.75 1.00cume_dist(y)## [1] 0.2 0.6 0.6 NA 0.8 1.04.6 summarize / summarise
#grouped summaries with summarize()
summarize(flights, delay=mean(dep_delay, na.rm = T))
## # A tibble: 1 x 1
## delay
## <dbl>
## 1 12.6summarise(flights, delay=mean(dep_delay, na.rm = T))## # A tibble: 1 x 1
## delay
## <dbl>
## 1 12.6head(by_day <- group_by(flights, year, month, day), 6)## # A tibble: 6 x 19
## # Groups: year, month, day [1]
## year month day dep_time sched_dep_time dep_delay arr_time sched_arr_time arr_delay carrier flight tailnum origin
## <int> <int> <int> <int> <int> <dbl> <int> <int> <dbl> <chr> <int> <chr> <chr>
## 1 2013 1 1 517 515 2 830 819 11 UA 1545 N14228 EWR
## 2 2013 1 1 533 529 4 850 830 20 UA 1714 N24211 LGA
## 3 2013 1 1 542 540 2 923 850 33 AA 1141 N619AA JFK
## 4 2013 1 1 544 545 -1 1004 1022 -18 B6 725 N804JB JFK
## 5 2013 1 1 554 600 -6 812 837 -25 DL 461 N668DN LGA
## 6 2013 1 1 554 558 -4 740 728 12 UA 1696 N39463 EWR
## # … with 6 more variables: dest <chr>, air_time <dbl>, distance <dbl>, hour <dbl>, minute <dbl>, time_hour <dttm>head(summarize(by_day, delay=mean(dep_delay, na.rm = T)), 6)## # A tibble: 6 x 4
## # Groups: year, month [1]
## year month day delay
## <int> <int> <int> <dbl>
## 1 2013 1 1 11.5
## 2 2013 1 2 13.9
## 3 2013 1 3 11.0
## 4 2013 1 4 8.95
## 5 2013 1 5 5.73
## 6 2013 1 6 7.154.7 pipe sign %>%
We will see that the n() function is embedded in "dplyr" library, in stead of "plyr.
#combining multiple operations
(by_dest <- group_by(flights, dest))
## # A tibble: 336,776 x 19
## # Groups: dest [105]
## year month day dep_time sched_dep_time dep_delay arr_time sched_arr_time arr_delay carrier flight tailnum origin
## <int> <int> <int> <int> <int> <dbl> <int> <int> <dbl> <chr> <int> <chr> <chr>
## 1 2013 1 1 517 515 2 830 819 11 UA 1545 N14228 EWR
## 2 2013 1 1 533 529 4 850 830 20 UA 1714 N24211 LGA
## 3 2013 1 1 542 540 2 923 850 33 AA 1141 N619AA JFK
## 4 2013 1 1 544 545 -1 1004 1022 -18 B6 725 N804JB JFK
## 5 2013 1 1 554 600 -6 812 837 -25 DL 461 N668DN LGA
## 6 2013 1 1 554 558 -4 740 728 12 UA 1696 N39463 EWR
## 7 2013 1 1 555 600 -5 913 854 19 B6 507 N516JB EWR
## 8 2013 1 1 557 600 -3 709 723 -14 EV 5708 N829AS LGA
## 9 2013 1 1 557 600 -3 838 846 -8 B6 79 N593JB JFK
## 10 2013 1 1 558 600 -2 753 745 8 AA 301 N3ALAA LGA
## # … with 336,766 more rows, and 6 more variables: dest <chr>, air_time <dbl>, distance <dbl>, hour <dbl>, minute <dbl>,
## # time_hour <dttm>select(by_dest, dest, everything())## # A tibble: 336,776 x 19
## # Groups: dest [105]
## dest year month day dep_time sched_dep_time dep_delay arr_time sched_arr_time arr_delay carrier flight tailnum
## <chr> <int> <int> <int> <int> <int> <dbl> <int> <int> <dbl> <chr> <int> <chr>
## 1 IAH 2013 1 1 517 515 2 830 819 11 UA 1545 N14228
## 2 IAH 2013 1 1 533 529 4 850 830 20 UA 1714 N24211
## 3 MIA 2013 1 1 542 540 2 923 850 33 AA 1141 N619AA
## 4 BQN 2013 1 1 544 545 -1 1004 1022 -18 B6 725 N804JB
## 5 ATL 2013 1 1 554 600 -6 812 837 -25 DL 461 N668DN
## 6 ORD 2013 1 1 554 558 -4 740 728 12 UA 1696 N39463
## 7 FLL 2013 1 1 555 600 -5 913 854 19 B6 507 N516JB
## 8 IAD 2013 1 1 557 600 -3 709 723 -14 EV 5708 N829AS
## 9 MCO 2013 1 1 557 600 -3 838 846 -8 B6 79 N593JB
## 10 ORD 2013 1 1 558 600 -2 753 745 8 AA 301 N3ALAA
## # … with 336,766 more rows, and 6 more variables: origin <chr>, air_time <dbl>, distance <dbl>, hour <dbl>, minute <dbl>,
## # time_hour <dttm>(delay <- dplyr::summarize(by_dest,
count=n(),
dist=mean(distance, na.rm=T),
delay=mean(arr_delay, na.rm = T)))## # A tibble: 105 x 4
## dest count dist delay
## * <chr> <int> <dbl> <dbl>
## 1 ABQ 254 1826 4.38
## 2 ACK 265 199 4.85
## 3 ALB 439 143 14.4
## 4 ANC 8 3370 -2.5
## 5 ATL 17215 757. 11.3
## 6 AUS 2439 1514. 6.02
## 7 AVL 275 584. 8.00
## 8 BDL 443 116 7.05
## 9 BGR 375 378 8.03
## 10 BHM 297 866. 16.9
## # … with 95 more rows(delay <- filter(delay, count>20, dest!="HNL"))## # A tibble: 96 x 4
## dest count dist delay
## <chr> <int> <dbl> <dbl>
## 1 ABQ 254 1826 4.38
## 2 ACK 265 199 4.85
## 3 ALB 439 143 14.4
## 4 ATL 17215 757. 11.3
## 5 AUS 2439 1514. 6.02
## 6 AVL 275 584. 8.00
## 7 BDL 443 116 7.05
## 8 BGR 375 378 8.03
## 9 BHM 297 866. 16.9
## 10 BNA 6333 758. 11.8
## # … with 86 more rowsggplot(delay, aes(dist, delay))+
geom_point(aes(size=count), alpha=1/3)+
geom_smooth(se=F, method = "lm") #default is method="loess"## `geom_smooth()` using formula 'y ~ x'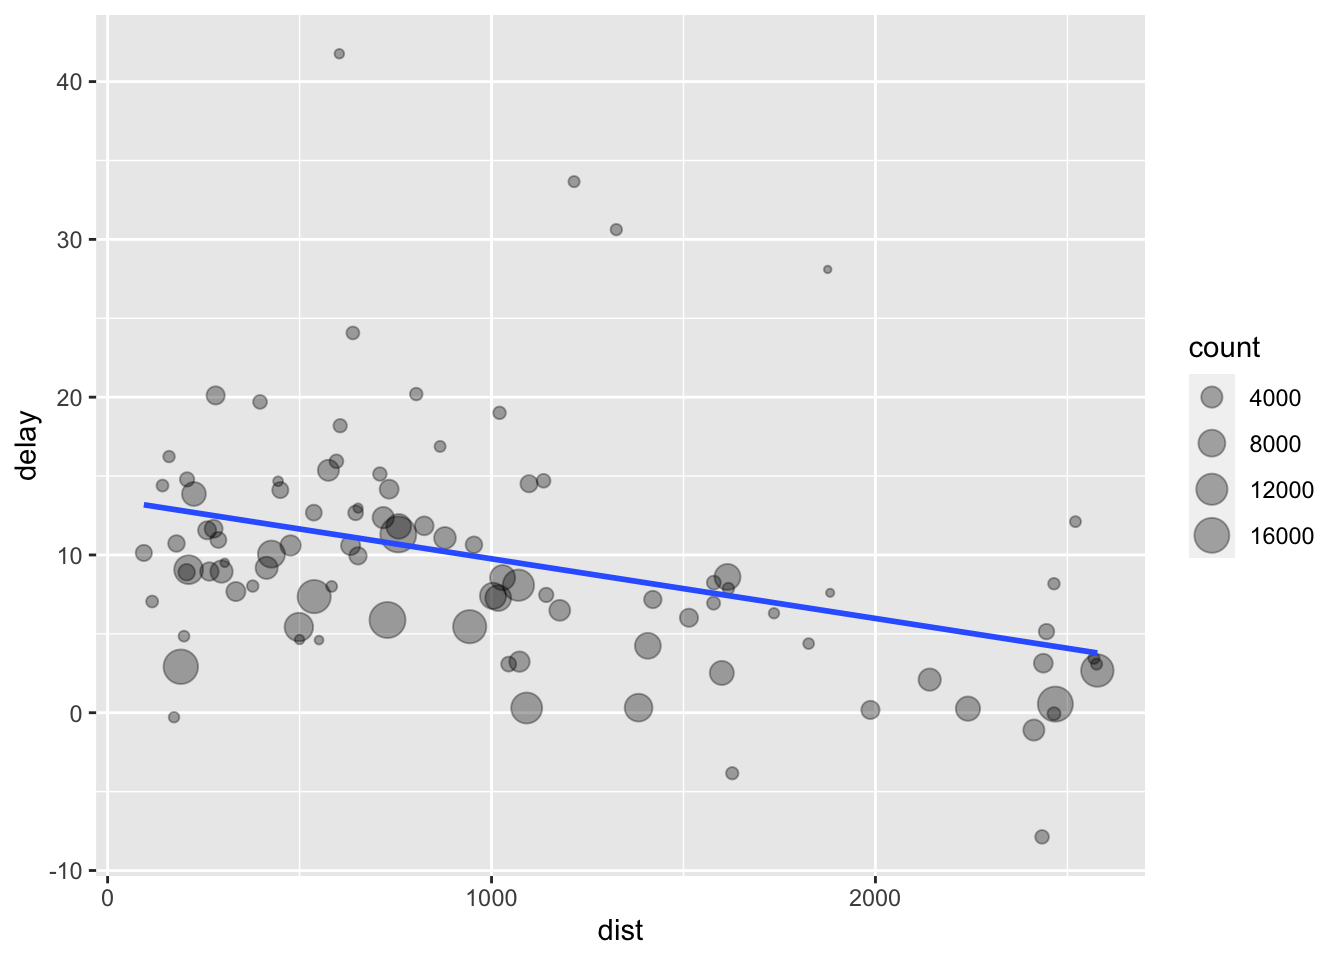
(delays <- flights %>%
  group_by(dest) %>%
  dplyr::summarise(count=n(),
            dist=mean(distance, na.rm = T),
            delay=mean(arr_delay, na.rm = T)) %>%
  filter(count>20, dest !="HNL"))
## # A tibble: 96 x 4
## dest count dist delay
## <chr> <int> <dbl> <dbl>
## 1 ABQ 254 1826 4.38
## 2 ACK 265 199 4.85
## 3 ALB 439 143 14.4
## 4 ATL 17215 757. 11.3
## 5 AUS 2439 1514. 6.02
## 6 AVL 275 584. 8.00
## 7 BDL 443 116 7.05
## 8 BGR 375 378 8.03
## 9 BHM 297 866. 16.9
## 10 BNA 6333 758. 11.8
## # … with 86 more rows4.8 missing values
We need to take care of missing values before summarizing our data.
#missing values
(flights %>%
  group_by(year, month, day)%>%
  summarise(mean=mean(dep_delay)))
## # A tibble: 365 x 4
## # Groups: year, month [12]
## year month day mean
## <int> <int> <int> <dbl>
## 1 2013 1 1 NA
## 2 2013 1 2 NA
## 3 2013 1 3 NA
## 4 2013 1 4 NA
## 5 2013 1 5 NA
## 6 2013 1 6 NA
## 7 2013 1 7 NA
## 8 2013 1 8 NA
## 9 2013 1 9 NA
## 10 2013 1 10 NA
## # … with 355 more rows(flights %>%
group_by(year, month, day)%>%
summarise(mean=mean(dep_delay, na.rm = T)))## # A tibble: 365 x 4
## # Groups: year, month [12]
## year month day mean
## <int> <int> <int> <dbl>
## 1 2013 1 1 11.5
## 2 2013 1 2 13.9
## 3 2013 1 3 11.0
## 4 2013 1 4 8.95
## 5 2013 1 5 5.73
## 6 2013 1 6 7.15
## 7 2013 1 7 5.42
## 8 2013 1 8 2.55
## 9 2013 1 9 2.28
## 10 2013 1 10 2.84
## # … with 355 more rows(not_cancelled <- flights %>%
filter(!is.na(dep_delay), !is.na(arr_delay)))## # A tibble: 327,346 x 19
## year month day dep_time sched_dep_time dep_delay arr_time sched_arr_time arr_delay carrier flight tailnum origin
## <int> <int> <int> <int> <int> <dbl> <int> <int> <dbl> <chr> <int> <chr> <chr>
## 1 2013 1 1 517 515 2 830 819 11 UA 1545 N14228 EWR
## 2 2013 1 1 533 529 4 850 830 20 UA 1714 N24211 LGA
## 3 2013 1 1 542 540 2 923 850 33 AA 1141 N619AA JFK
## 4 2013 1 1 544 545 -1 1004 1022 -18 B6 725 N804JB JFK
## 5 2013 1 1 554 600 -6 812 837 -25 DL 461 N668DN LGA
## 6 2013 1 1 554 558 -4 740 728 12 UA 1696 N39463 EWR
## 7 2013 1 1 555 600 -5 913 854 19 B6 507 N516JB EWR
## 8 2013 1 1 557 600 -3 709 723 -14 EV 5708 N829AS LGA
## 9 2013 1 1 557 600 -3 838 846 -8 B6 79 N593JB JFK
## 10 2013 1 1 558 600 -2 753 745 8 AA 301 N3ALAA LGA
## # … with 327,336 more rows, and 6 more variables: dest <chr>, air_time <dbl>, distance <dbl>, hour <dbl>, minute <dbl>,
## # time_hour <dttm>(not_cancelled %>%
group_by(year, month, day)%>%
summarize(mean=mean(dep_delay)))## # A tibble: 365 x 4
## # Groups: year, month [12]
## year month day mean
## <int> <int> <int> <dbl>
## 1 2013 1 1 11.4
## 2 2013 1 2 13.7
## 3 2013 1 3 10.9
## 4 2013 1 4 8.97
## 5 2013 1 5 5.73
## 6 2013 1 6 7.15
## 7 2013 1 7 5.42
## 8 2013 1 8 2.56
## 9 2013 1 9 2.30
## 10 2013 1 10 2.84
## # … with 355 more rows4.9 visualize what we got
#counts
(delays <- not_cancelled%>%
  group_by(tailnum)%>%
  summarise(delay=mean(arr_delay)))
## # A tibble: 4,037 x 2
## tailnum delay
## * <chr> <dbl>
## 1 D942DN 31.5
## 2 N0EGMQ 9.98
## 3 N10156 12.7
## 4 N102UW 2.94
## 5 N103US -6.93
## 6 N104UW 1.80
## 7 N10575 20.7
## 8 N105UW -0.267
## 9 N107US -5.73
## 10 N108UW -1.25
## # … with 4,027 more rowsggplot(delays, aes(delay))+
geom_freqpoly(binwidth=10)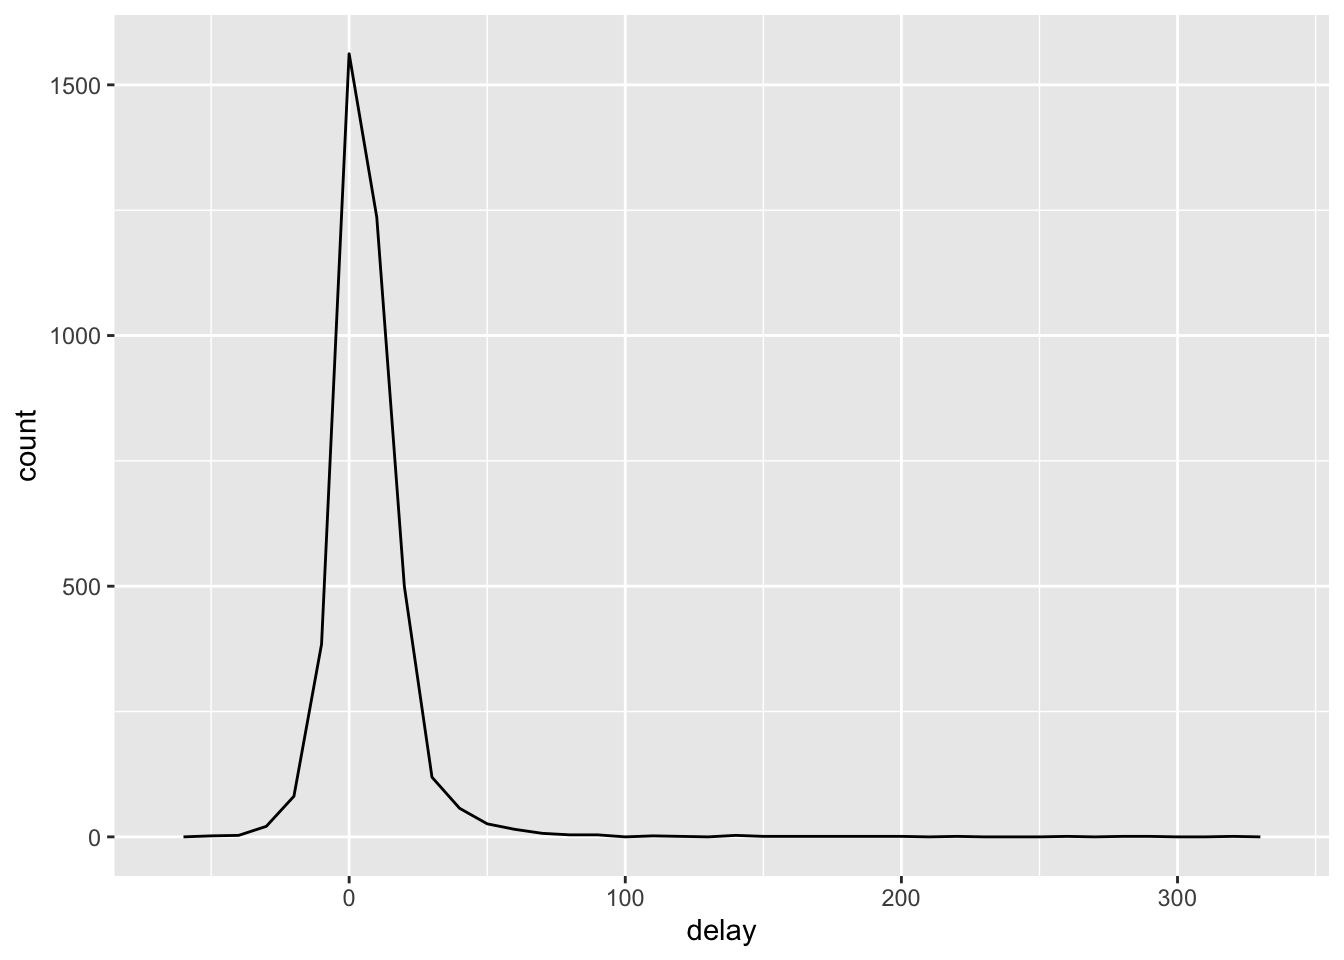
(delays <- not_cancelled%>%
  group_by(tailnum)%>%
  summarise(delay=mean(arr_delay, na.rm = T),
            n=n()))
## # A tibble: 4,037 x 3
## tailnum delay n
## * <chr> <dbl> <int>
## 1 D942DN 31.5 4
## 2 N0EGMQ 9.98 352
## 3 N10156 12.7 145
## 4 N102UW 2.94 48
## 5 N103US -6.93 46
## 6 N104UW 1.80 46
## 7 N10575 20.7 269
## 8 N105UW -0.267 45
## 9 N107US -5.73 41
## 10 N108UW -1.25 60
## # … with 4,027 more rowsggplot(delays, aes(n,delay))+
geom_point(alpha=1/10)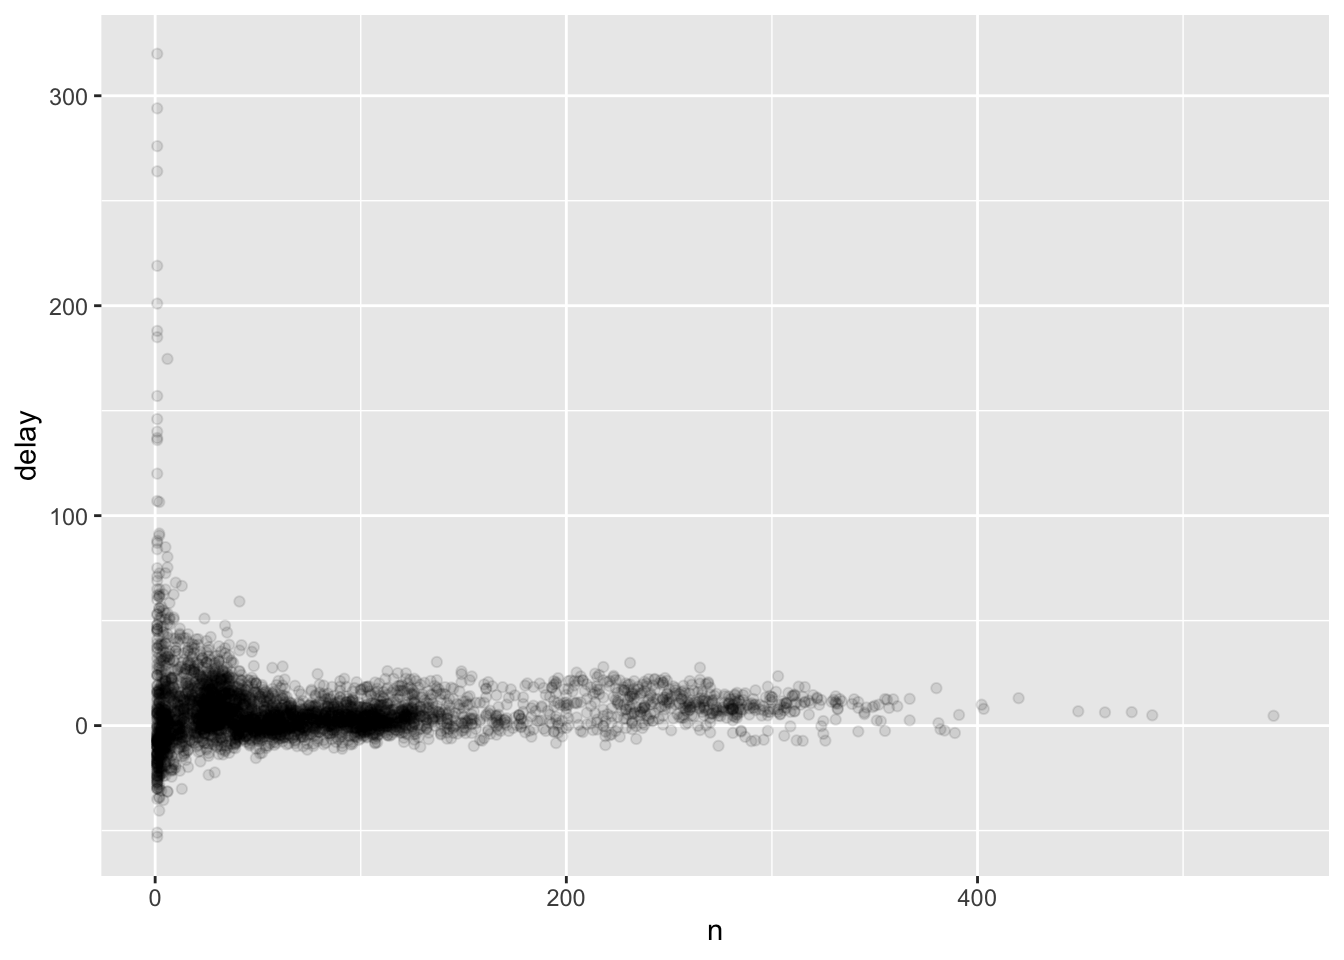
ggplot(data = delays, mapping = aes(x=n,y=delay))+
  geom_point(alpha=1/10)
#greater variation in the ave. delay when there are few flights

#sample size vs. variation
delays %>%
  filter(n>25) %>%
  ggplot(aes(n, delay))+
  geom_point(alpha=1/10)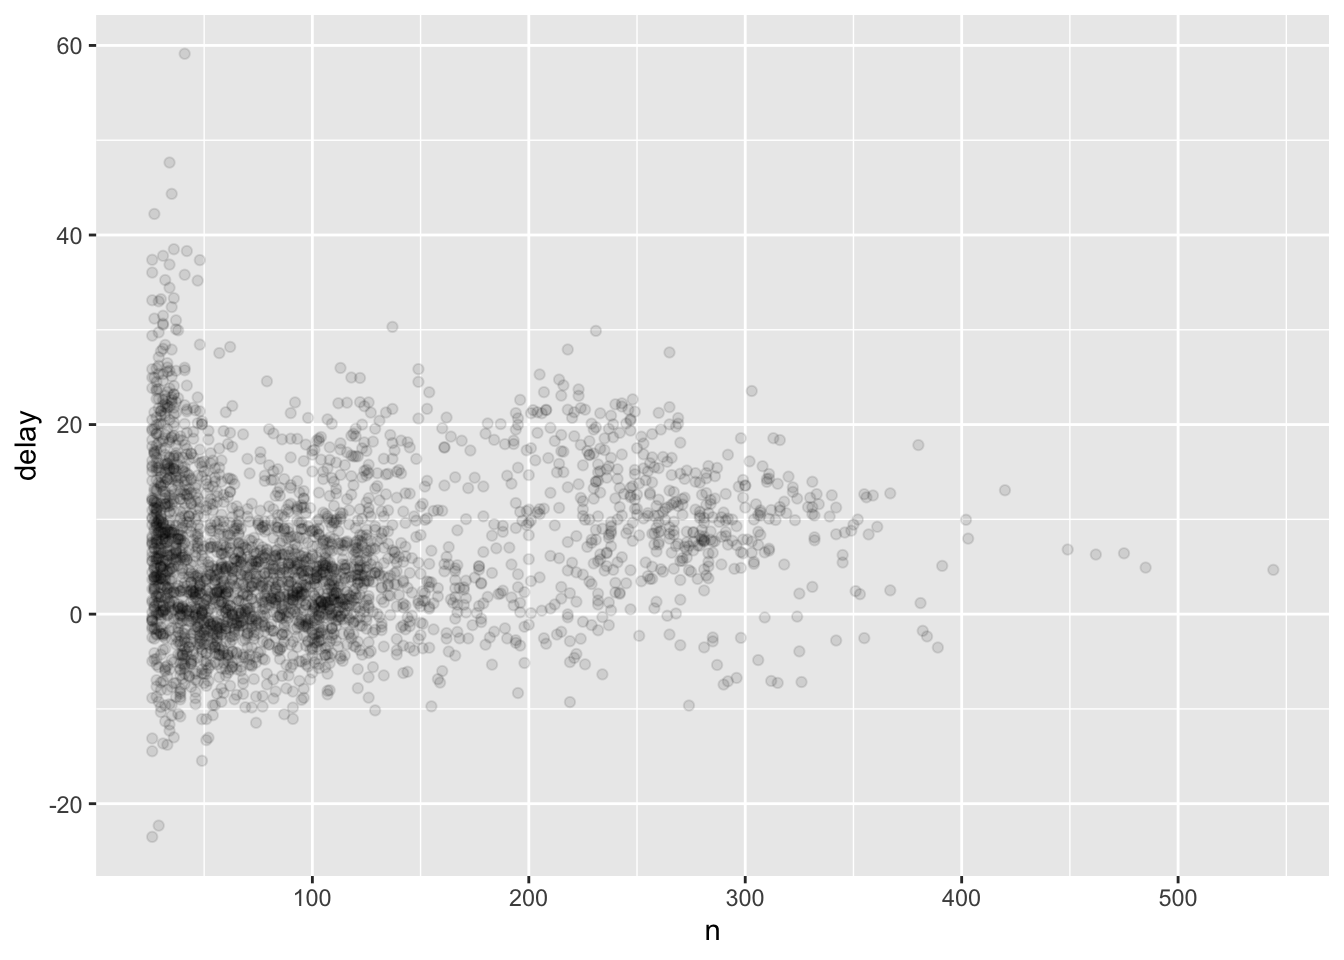
4.10 example
Need to install the "Lahman" package.
#the batter example
(batting <- as_tibble(Lahman::Batting))
## # A tibble: 107,429 x 22
## playerID yearID stint teamID lgID G AB R H X2B X3B HR RBI SB CS BB SO IBB HBP
## <chr> <int> <int> <fct> <fct> <int> <int> <int> <int> <int> <int> <int> <int> <int> <int> <int> <int> <int> <int>
## 1 abercda… 1871 1 TRO NA 1 4 0 0 0 0 0 0 0 0 0 0 NA NA
## 2 addybo01 1871 1 RC1 NA 25 118 30 32 6 0 0 13 8 1 4 0 NA NA
## 3 allisar… 1871 1 CL1 NA 29 137 28 40 4 5 0 19 3 1 2 5 NA NA
## 4 allisdo… 1871 1 WS3 NA 27 133 28 44 10 2 2 27 1 1 0 2 NA NA
## 5 ansonca… 1871 1 RC1 NA 25 120 29 39 11 3 0 16 6 2 2 1 NA NA
## 6 armstbo… 1871 1 FW1 NA 12 49 9 11 2 1 0 5 0 1 0 1 NA NA
## 7 barkeal… 1871 1 RC1 NA 1 4 0 1 0 0 0 2 0 0 1 0 NA NA
## 8 barnero… 1871 1 BS1 NA 31 157 66 63 10 9 0 34 11 6 13 1 NA NA
## 9 barrebi… 1871 1 FW1 NA 1 5 1 1 1 0 0 1 0 0 0 0 NA NA
## 10 barrofr… 1871 1 BS1 NA 18 86 13 13 2 1 0 11 1 0 0 0 NA NA
## # … with 107,419 more rows, and 3 more variables: SH <int>, SF <int>, GIDP <int>#ba: skill of the batter (batting average)
#ab: opportunites to hit the ball
(batters <- batting%>%
group_by(playerID)%>%
summarise(
ba=sum(H, na.rm = T)/sum(AB, na.rm = T),
ab=sum(AB, na.rm = T)
))## # A tibble: 19,689 x 3
## playerID ba ab
## * <chr> <dbl> <int>
## 1 aardsda01 0 4
## 2 aaronha01 0.305 12364
## 3 aaronto01 0.229 944
## 4 aasedo01 0 5
## 5 abadan01 0.0952 21
## 6 abadfe01 0.111 9
## 7 abadijo01 0.224 49
## 8 abbated01 0.254 3044
## 9 abbeybe01 0.169 225
## 10 abbeych01 0.281 1756
## # … with 19,679 more rows(check1 <- batting%>%
filter(playerID == "aaronto01")%>%
summarise(ba=sum(H, na.rm = T)/sum(AB, na.rm = T),
ab=sum(AB, na.rm = T)))## # A tibble: 1 x 2
## ba ab
## <dbl> <int>
## 1 0.229 944batters%>%
filter(ab>100)%>%
ggplot(aes(x=ab, y=ba))+
geom_point()+
geom_smooth(se=F)## `geom_smooth()` using method = 'gam' and formula 'y ~ s(x, bs = "cs")'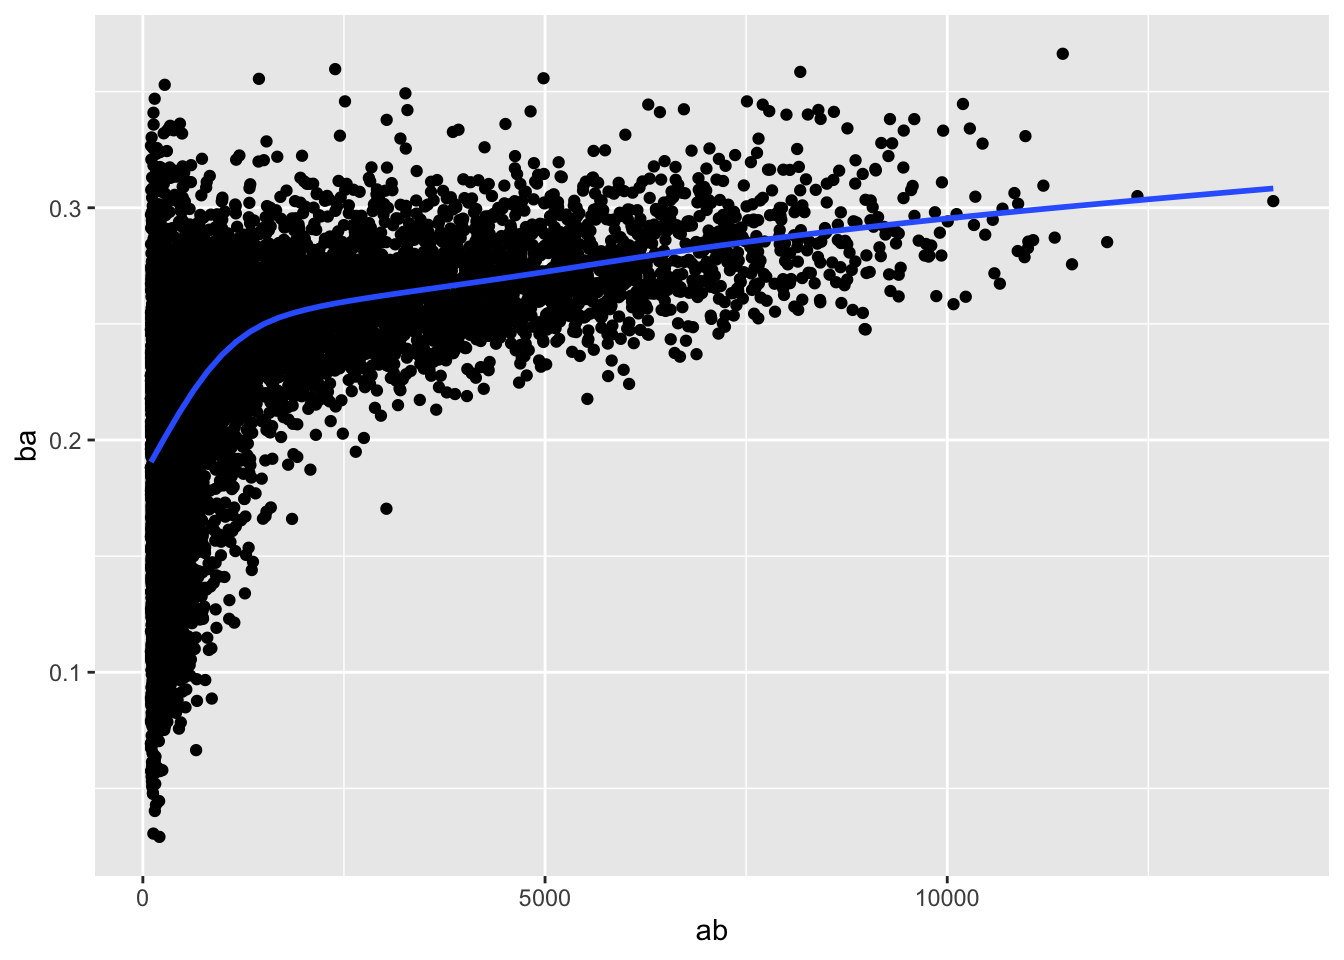
#people with the best batting averages are lucky
batters %>%
  arrange(desc(ba))
## # A tibble: 19,689 x 3
## playerID ba ab
## <chr> <dbl> <int>
## 1 abramge01 1 1
## 2 alanirj01 1 1
## 3 alberan01 1 1
## 4 banisje01 1 1
## 5 bartocl01 1 1
## 6 bassdo01 1 1
## 7 birasst01 1 2
## 8 bruneju01 1 1
## 9 burnscb01 1 1
## 10 cammaer01 1 1
## # … with 19,679 more rows#summary functions:
not_cancelled %>%
group_by(year, month, day)%>%
summarise(
#average delay:
avg_delay1 = mean(arr_delay),
#average positive delay:
avg_delay2 = mean(arr_delay[arr_delay>0])
)## # A tibble: 365 x 5
## # Groups: year, month [12]
## year month day avg_delay1 avg_delay2
## <int> <int> <int> <dbl> <dbl>
## 1 2013 1 1 12.7 32.5
## 2 2013 1 2 12.7 32.0
## 3 2013 1 3 5.73 27.7
## 4 2013 1 4 -1.93 28.3
## 5 2013 1 5 -1.53 22.6
## 6 2013 1 6 4.24 24.4
## 7 2013 1 7 -4.95 27.8
## 8 2013 1 8 -3.23 20.8
## 9 2013 1 9 -0.264 25.6
## 10 2013 1 10 -5.90 27.3
## # … with 355 more rowsnot_cancelled %>%
group_by(dest)%>%
summarise(distance_sd=sd(distance))%>%
arrange(desc(distance_sd))## # A tibble: 104 x 2
## dest distance_sd
## <chr> <dbl>
## 1 EGE 10.5
## 2 SAN 10.4
## 3 SFO 10.2
## 4 HNL 10.0
## 5 SEA 9.98
## 6 LAS 9.91
## 7 PDX 9.87
## 8 PHX 9.86
## 9 LAX 9.66
## 10 IND 9.46
## # … with 94 more rows#when do the first and last flights leave each day?
not_cancelled%>%
group_by(year, month, day)%>%
summarise(
first=min(dep_time),
last=max(dep_time)
)## # A tibble: 365 x 5
## # Groups: year, month [12]
## year month day first last
## <int> <int> <int> <int> <int>
## 1 2013 1 1 517 2356
## 2 2013 1 2 42 2354
## 3 2013 1 3 32 2349
## 4 2013 1 4 25 2358
## 5 2013 1 5 14 2357
## 6 2013 1 6 16 2355
## 7 2013 1 7 49 2359
## 8 2013 1 8 454 2351
## 9 2013 1 9 2 2252
## 10 2013 1 10 3 2320
## # … with 355 more rowsnot_cancelled%>%
group_by(year, month, day)%>%
summarise(
first=first(dep_time),
last=last(dep_time)
)## # A tibble: 365 x 5
## # Groups: year, month [12]
## year month day first last
## <int> <int> <int> <int> <int>
## 1 2013 1 1 517 2356
## 2 2013 1 2 42 2354
## 3 2013 1 3 32 2349
## 4 2013 1 4 25 2358
## 5 2013 1 5 14 2357
## 6 2013 1 6 16 2355
## 7 2013 1 7 49 2359
## 8 2013 1 8 454 2351
## 9 2013 1 9 2 2252
## 10 2013 1 10 3 2320
## # … with 355 more rowsnot_cancelled%>%
group_by(year, month, day)%>%
mutate(r=min_rank(desc(dep_time)))%>%
filter(r%in%range(r))%>%
select(r, everything())## # A tibble: 770 x 20
## # Groups: year, month, day [365]
## r year month day dep_time sched_dep_time dep_delay arr_time sched_arr_time arr_delay carrier flight tailnum
## <int> <int> <int> <int> <int> <int> <dbl> <int> <int> <dbl> <chr> <int> <chr>
## 1 831 2013 1 1 517 515 2 830 819 11 UA 1545 N14228
## 2 1 2013 1 1 2356 2359 -3 425 437 -12 B6 727 N588JB
## 3 928 2013 1 2 42 2359 43 518 442 36 B6 707 N580JB
## 4 1 2013 1 2 2354 2359 -5 413 437 -24 B6 727 N789JB
## 5 900 2013 1 3 32 2359 33 504 442 22 B6 707 N763JB
## 6 1 2013 1 3 2349 2359 -10 434 445 -11 B6 739 N729JB
## 7 908 2013 1 4 25 2359 26 505 442 23 B6 707 N554JB
## 8 1 2013 1 4 2358 2359 -1 429 437 -8 B6 727 N599JB
## 9 1 2013 1 4 2358 2359 -1 436 445 -9 B6 739 N821JB
## 10 717 2013 1 5 14 2359 15 503 445 18 B6 739 N592JB
## # … with 760 more rows, and 7 more variables: origin <chr>, dest <chr>, air_time <dbl>, distance <dbl>, hour <dbl>,
## # minute <dbl>, time_hour <dttm>#count unique values
not_cancelled%>%
group_by(dest)%>%
summarise(carriers=n_distinct(carrier))%>%
arrange(desc(carriers))## # A tibble: 104 x 2
## dest carriers
## <chr> <int>
## 1 ATL 7
## 2 BOS 7
## 3 CLT 7
## 4 ORD 7
## 5 TPA 7
## 6 AUS 6
## 7 DCA 6
## 8 DTW 6
## 9 IAD 6
## 10 MSP 6
## # … with 94 more rows#sort(c(2,3,1,4), decreasing = T)
not_cancelled%>%
count(dest)## # A tibble: 104 x 2
## dest n
## * <chr> <int>
## 1 ABQ 254
## 2 ACK 264
## 3 ALB 418
## 4 ANC 8
## 5 ATL 16837
## 6 AUS 2411
## 7 AVL 261
## 8 BDL 412
## 9 BGR 358
## 10 BHM 269
## # … with 94 more rows#smart use of sum and mean
not_cancelled%>%
count(tailnum, wt=distance)## # A tibble: 4,037 x 2
## tailnum n
## * <chr> <dbl>
## 1 D942DN 3418
## 2 N0EGMQ 239143
## 3 N10156 109664
## 4 N102UW 25722
## 5 N103US 24619
## 6 N104UW 24616
## 7 N10575 139903
## 8 N105UW 23618
## 9 N107US 21677
## 10 N108UW 32070
## # … with 4,027 more rows#how many flights left before 5am
not_cancelled %>%
group_by(year, month, day)%>%
summarise(n_early=sum(dep_time<500))## # A tibble: 365 x 4
## # Groups: year, month [12]
## year month day n_early
## <int> <int> <int> <int>
## 1 2013 1 1 0
## 2 2013 1 2 3
## 3 2013 1 3 4
## 4 2013 1 4 3
## 5 2013 1 5 3
## 6 2013 1 6 2
## 7 2013 1 7 2
## 8 2013 1 8 1
## 9 2013 1 9 3
## 10 2013 1 10 3
## # … with 355 more rows#what proportion of flights are delayed by more than an hour?
not_cancelled%>%
group_by(year, month, day)%>%
summarise(hour_perc=mean(arr_delay>60))## # A tibble: 365 x 4
## # Groups: year, month [12]
## year month day hour_perc
## <int> <int> <int> <dbl>
## 1 2013 1 1 0.0722
## 2 2013 1 2 0.0851
## 3 2013 1 3 0.0567
## 4 2013 1 4 0.0396
## 5 2013 1 5 0.0349
## 6 2013 1 6 0.0470
## 7 2013 1 7 0.0333
## 8 2013 1 8 0.0213
## 9 2013 1 9 0.0202
## 10 2013 1 10 0.0183
## # … with 355 more rows#how many flights per day
daily<-group_by(flights, year, month, day)
(per_day <- summarise(daily, flights=n()))## # A tibble: 365 x 4
## # Groups: year, month [12]
## year month day flights
## <int> <int> <int> <int>
## 1 2013 1 1 842
## 2 2013 1 2 943
## 3 2013 1 3 914
## 4 2013 1 4 915
## 5 2013 1 5 720
## 6 2013 1 6 832
## 7 2013 1 7 933
## 8 2013 1 8 899
## 9 2013 1 9 902
## 10 2013 1 10 932
## # … with 355 more rows#be careful when progressively rolling up summaries
group_by(flights, year, month, day)%>%
summarise(flights=n())%>%
summarise(flights=sum(flights))%>%
summarise(flights=sum(flights))## # A tibble: 1 x 2
## year flights
## * <int> <int>
## 1 2013 336776daily%>%
ungroup()%>%
summarise(flights=n())## # A tibble: 1 x 1
## flights
## <int>
## 1 336776#find the worst members of each group
flights_sml%>%
group_by(year, month, day)%>%
filter(rank(desc(arr_delay))<10)## # A tibble: 3,306 x 7
## # Groups: year, month, day [365]
## year month day dep_delay arr_delay distance air_time
## <int> <int> <int> <dbl> <dbl> <dbl> <dbl>
## 1 2013 1 1 853 851 184 41
## 2 2013 1 1 290 338 1134 213
## 3 2013 1 1 260 263 266 46
## 4 2013 1 1 157 174 213 60
## 5 2013 1 1 216 222 708 121
## 6 2013 1 1 255 250 589 115
## 7 2013 1 1 285 246 1085 146
## 8 2013 1 1 192 191 199 44
## 9 2013 1 1 379 456 1092 222
## 10 2013 1 2 224 207 550 94
## # … with 3,296 more rows#find all groups begger than a shreshold
(popular_dests <- flights%>%
group_by(dest)%>%
filter(n()>365))## # A tibble: 332,577 x 19
## # Groups: dest [77]
## year month day dep_time sched_dep_time dep_delay arr_time sched_arr_time arr_delay carrier flight tailnum origin
## <int> <int> <int> <int> <int> <dbl> <int> <int> <dbl> <chr> <int> <chr> <chr>
## 1 2013 1 1 517 515 2 830 819 11 UA 1545 N14228 EWR
## 2 2013 1 1 533 529 4 850 830 20 UA 1714 N24211 LGA
## 3 2013 1 1 542 540 2 923 850 33 AA 1141 N619AA JFK
## 4 2013 1 1 544 545 -1 1004 1022 -18 B6 725 N804JB JFK
## 5 2013 1 1 554 600 -6 812 837 -25 DL 461 N668DN LGA
## 6 2013 1 1 554 558 -4 740 728 12 UA 1696 N39463 EWR
## 7 2013 1 1 555 600 -5 913 854 19 B6 507 N516JB EWR
## 8 2013 1 1 557 600 -3 709 723 -14 EV 5708 N829AS LGA
## 9 2013 1 1 557 600 -3 838 846 -8 B6 79 N593JB JFK
## 10 2013 1 1 558 600 -2 753 745 8 AA 301 N3ALAA LGA
## # … with 332,567 more rows, and 6 more variables: dest <chr>, air_time <dbl>, distance <dbl>, hour <dbl>, minute <dbl>,
## # time_hour <dttm>#standardize to compute per group metrics
popular_dests%>%
filter(arr_delay>0)%>%
mutate(prop_delay=arr_delay/sum(arr_delay))%>%
select(year:day, dest, arr_delay, prop_delay)## # A tibble: 131,106 x 6
## # Groups: dest [77]
## year month day dest arr_delay prop_delay
## <int> <int> <int> <chr> <dbl> <dbl>
## 1 2013 1 1 IAH 11 0.000111
## 2 2013 1 1 IAH 20 0.000201
## 3 2013 1 1 MIA 33 0.000235
## 4 2013 1 1 ORD 12 0.0000424
## 5 2013 1 1 FLL 19 0.0000938
## 6 2013 1 1 ORD 8 0.0000283
## 7 2013 1 1 LAX 7 0.0000344
## 8 2013 1 1 DFW 31 0.000282
## 9 2013 1 1 ATL 12 0.0000400
## 10 2013 1 1 DTW 16 0.000116
## # … with 131,096 more rows