Statistical Background For TS Analysis & Forecasting
## Time Series:
## Start = 1821
## End = 1934
## Frequency = 1
##   [1]  269  321  585  871 1475 2821 3928 5943 4950 2577  523   98  184  279
##  [15]  409 2285 2685 3409 1824  409  151   45   68  213  546 1033 2129 2536
##  [29]  957  361  377  225  360  731 1638 2725 2871 2119  684  299  236  245
##  [43]  552 1623 3311 6721 4254  687  255  473  358  784 1594 1676 2251 1426
##  [57]  756  299  201  229  469  736 2042 2811 4431 2511  389   73   39   49
##  [71]   59  188  377 1292 4031 3495  587  105  153  387  758 1307 3465 6991
##  [85] 6313 3794 1836  345  382  808 1388 2713 3800 3091 2985 3790  674   81
##  [99]   80  108  229  399 1132 2432 3574 2935 1537  529  485  662 1000 1590
## [113] 2657 3396
## Time Series:
## Start = 1821
## End = 1934
## Frequency = 1
##   [1] 1821 1822 1823 1824 1825 1826 1827 1828 1829 1830 1831 1832 1833 1834
##  [15] 1835 1836 1837 1838 1839 1840 1841 1842 1843 1844 1845 1846 1847 1848
##  [29] 1849 1850 1851 1852 1853 1854 1855 1856 1857 1858 1859 1860 1861 1862
##  [43] 1863 1864 1865 1866 1867 1868 1869 1870 1871 1872 1873 1874 1875 1876
##  [57] 1877 1878 1879 1880 1881 1882 1883 1884 1885 1886 1887 1888 1889 1890
##  [71] 1891 1892 1893 1894 1895 1896 1897 1898 1899 1900 1901 1902 1903 1904
##  [85] 1905 1906 1907 1908 1909 1910 1911 1912 1913 1914 1915 1916 1917 1918
##  [99] 1919 1920 1921 1922 1923 1924 1925 1926 1927 1928 1929 1930 1931 1932
## [113] 1933 1934
## [1] 114
## Time Series:
## Start = 1929
## End = 1934
## Frequency = 1
## [1]  485  662 1000 1590 2657 3396
## [1] 1538.018
## [1] 771


##   [1]   39   45   49   59   68   73   80   81   98  105  108  151  153  184
##  [15]  188  201  213  225  229  229  236  245  255  269  279  299  299  321
##  [29]  345  358  360  361  377  377  382  387  389  399  409  409  469  473
##  [43]  485  523  529  546  552  585  587  662  674  684  687  731  736  756
##  [57]  758  784  808  871  957 1000 1033 1132 1292 1307 1388 1426 1475 1537
##  [71] 1590 1594 1623 1638 1676 1824 1836 2042 2119 2129 2251 2285 2432 2511
##  [85] 2536 2577 2657 2685 2713 2725 2811 2821 2871 2935 2985 3091 3311 3396
##  [99] 3409 3465 3495 3574 3790 3794 3800 3928 4031 4254 4431 4950 5943 6313
## [113] 6721 6991
## [1] 758 784
##      0%     25%     50%     75%    100%
##   39.00  348.25  771.00 2566.75 6991.00
##     0%    10%    20%    30%    40%    50%    60%    70%    80%    90%
##   39.0  146.7  259.2  380.5  546.6  771.0 1470.1 2165.6 2818.0 3790.4
##   100%
## 6991.0


## Warning in plot.window(xlim, ylim, log, ...): "plot.conf" is not a
## graphical parameter
## Warning in title(main = main, xlab = xlab, ylab = ylab, ...): "plot.conf"
## is not a graphical parameter
## Warning in axis(1, ...): "plot.conf" is not a graphical parameter
## Warning in axis(2, ...): "plot.conf" is not a graphical parameter
## Warning in box(...): "plot.conf" is not a graphical parameter
lines(naivem$mean, col=123, lwd = 2)
lines(driftm$mean, col=22, lwd = 2)
legend("topleft",lty=1,col=c(4,123,22),
       legend=c("Mean method","Naive method","Drift Method"))

##                         ME     RMSE       MAE       MPE     MAPE      MASE
## Training set  1.407307e-17 1.003956 0.8164571  77.65393 133.4892 0.7702074
## Test set     -2.459828e-01 1.138760 0.9627571 100.70356 102.7884 0.9082199
##                   ACF1 Theil's U
## Training set 0.1293488        NA
## Test set     0.2415939  0.981051
##                         ME     RMSE      MAE        MPE     MAPE     MASE
## Training set -0.0002083116 1.323311 1.060048 -152.73569 730.9655 1.000000
## Test set      0.8731935861 1.413766 1.162537   86.29346 307.9891 1.096683
##                    ACF1 Theil's U
## Training set -0.4953144        NA
## Test set      0.2415939  2.031079
##                         ME     RMSE      MAE        MPE     MAPE      MASE
## Training set -1.957854e-17 1.323311 1.060041 -152.64988 730.8626 0.9999931
## Test set      8.763183e-01 1.415768 1.163981   85.96496 308.7329 1.0980447
##                    ACF1 Theil's U
## Training set -0.4953144        NA
## Test set      0.2418493   2.03317
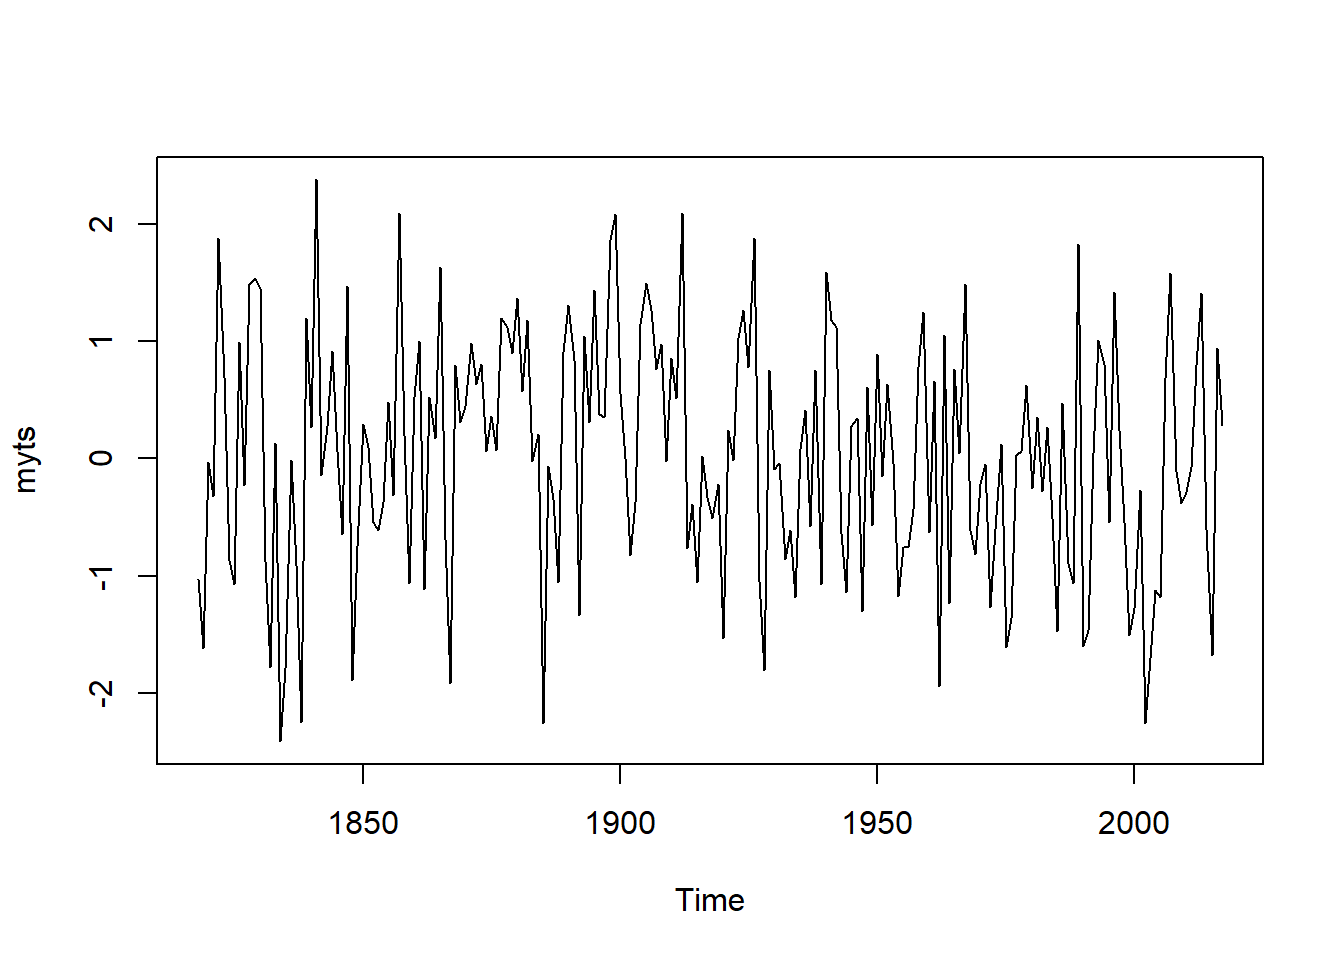
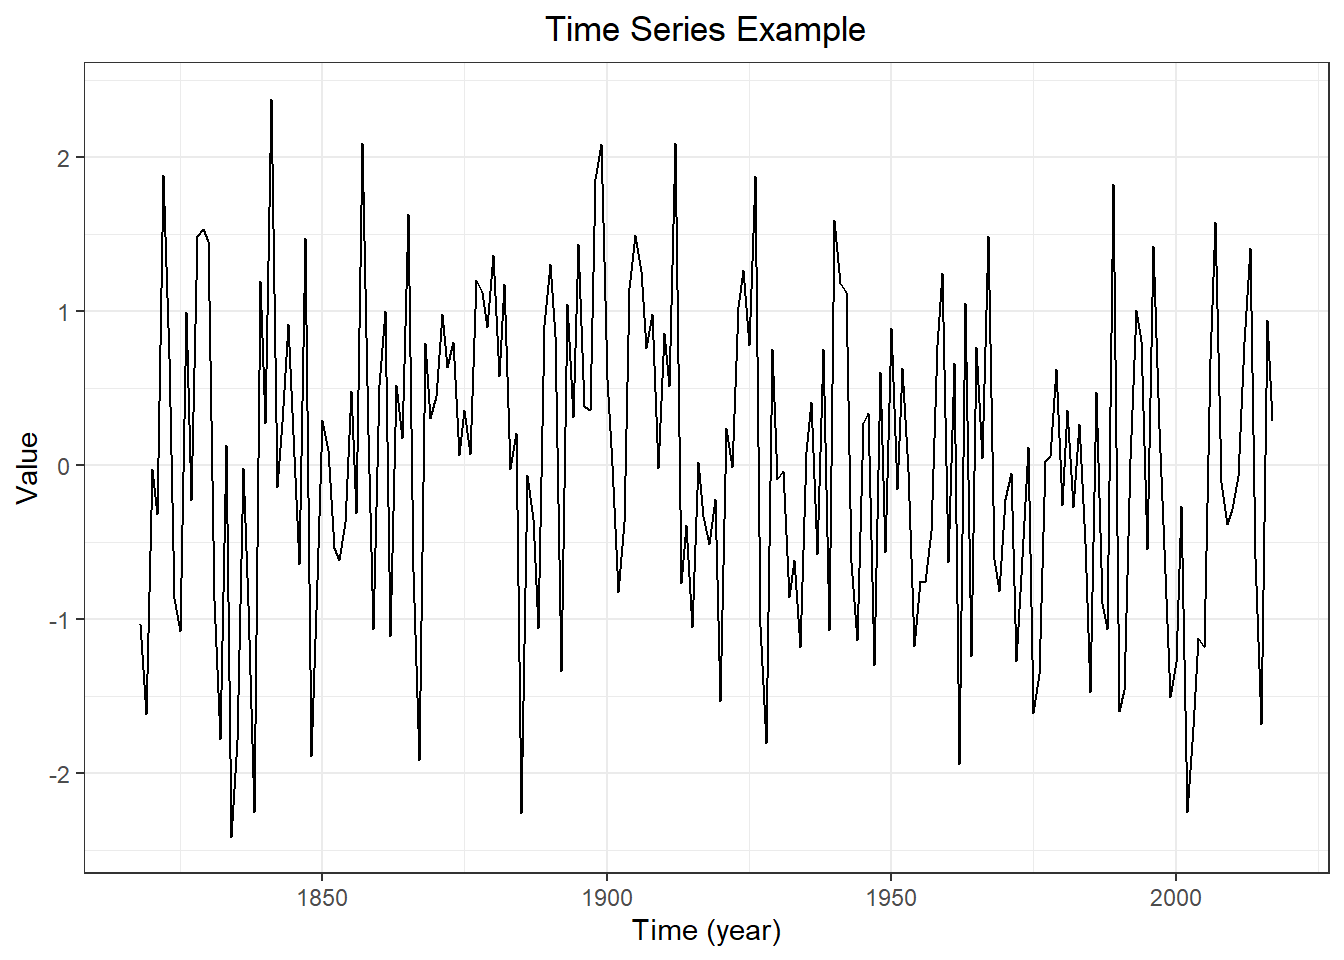
## [1] 1.053807
## [1] -5.95498e-18
## [1] NA
## [1] 1.798592
## [1] 0.006605028
## [1] 1.798592
## [1] -4.502054e-17
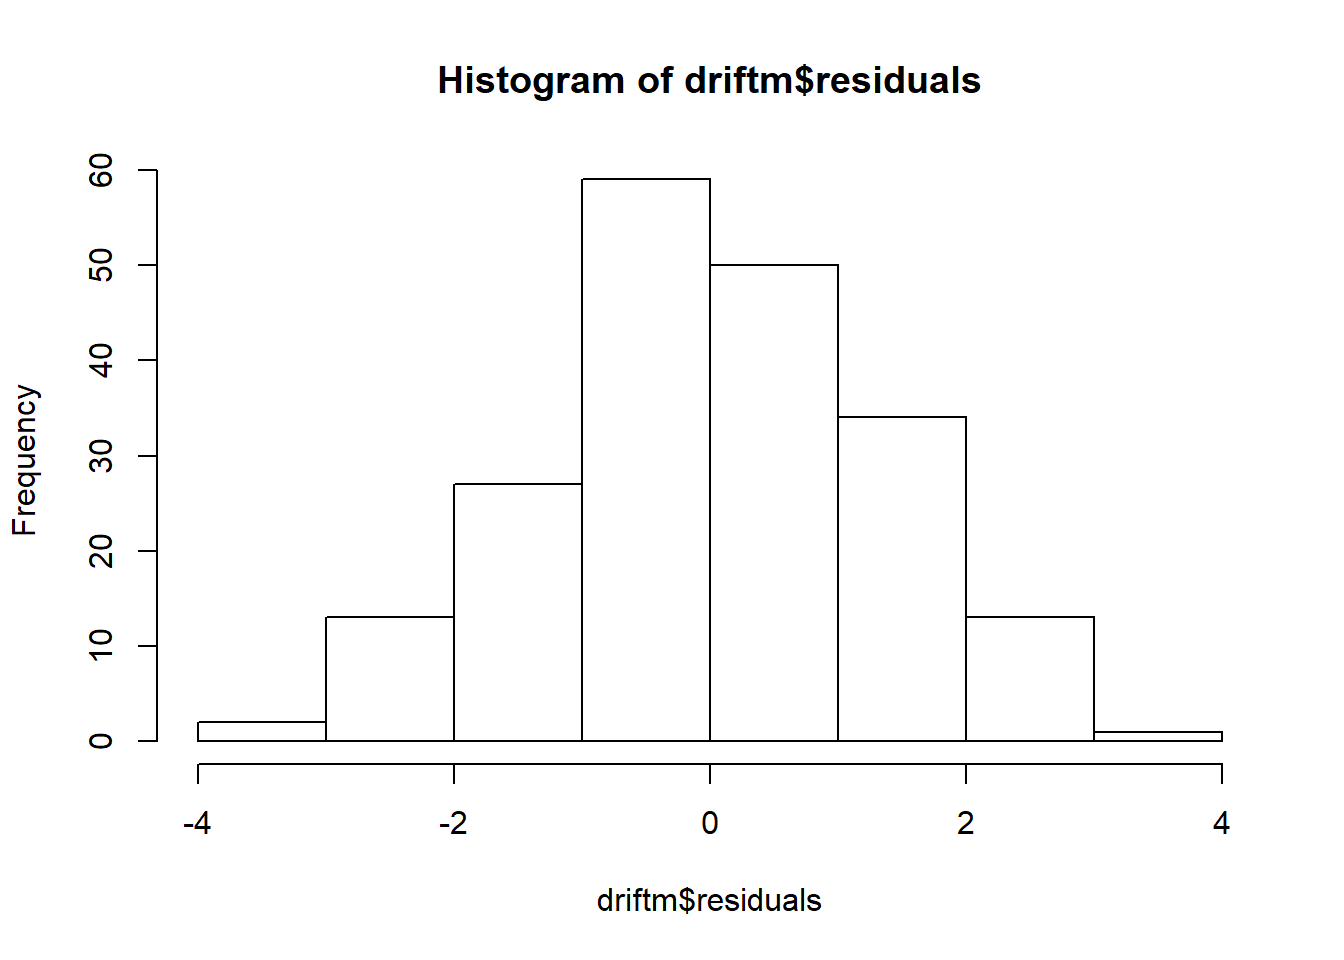
## Don't know how to automatically pick scale for object of type ts. Defaulting to continuous.
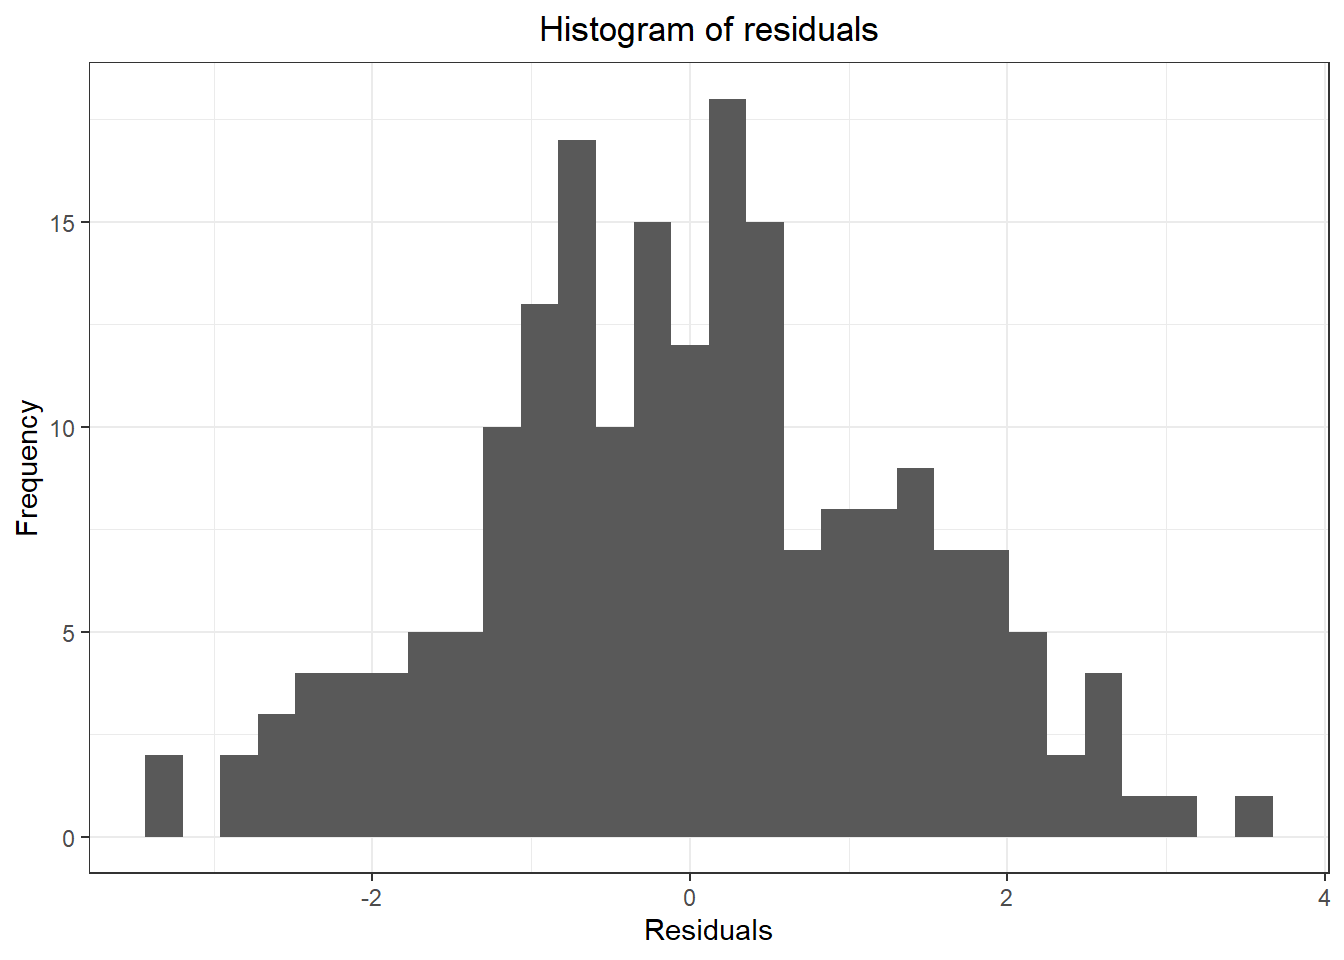
## `stat_bin()` using `bins = 30`. Pick better value with `binwidth`.
## Warning: Removed 1 rows containing non-finite values (stat_bin).
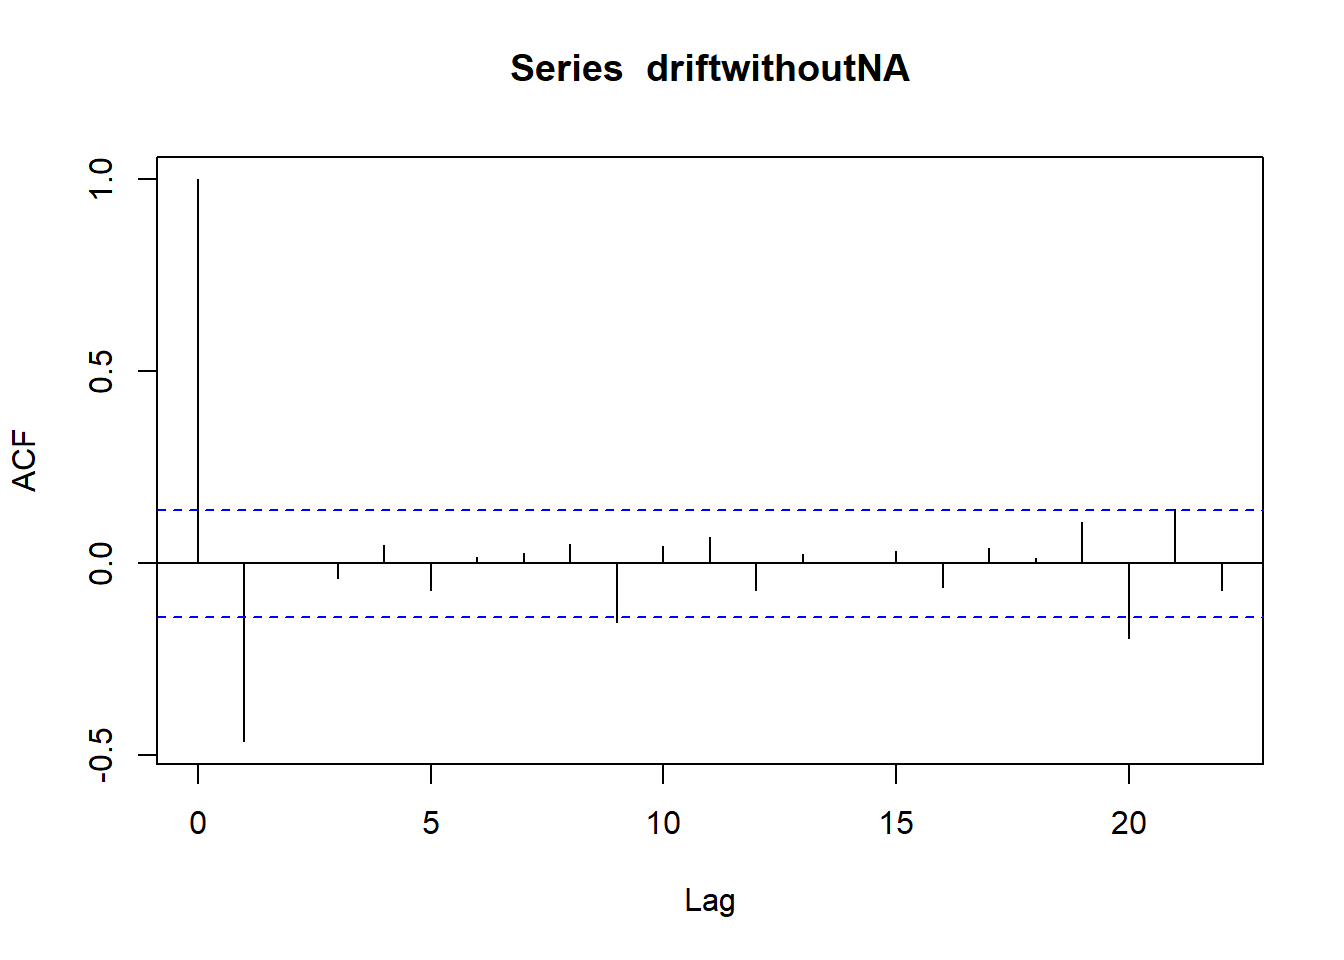
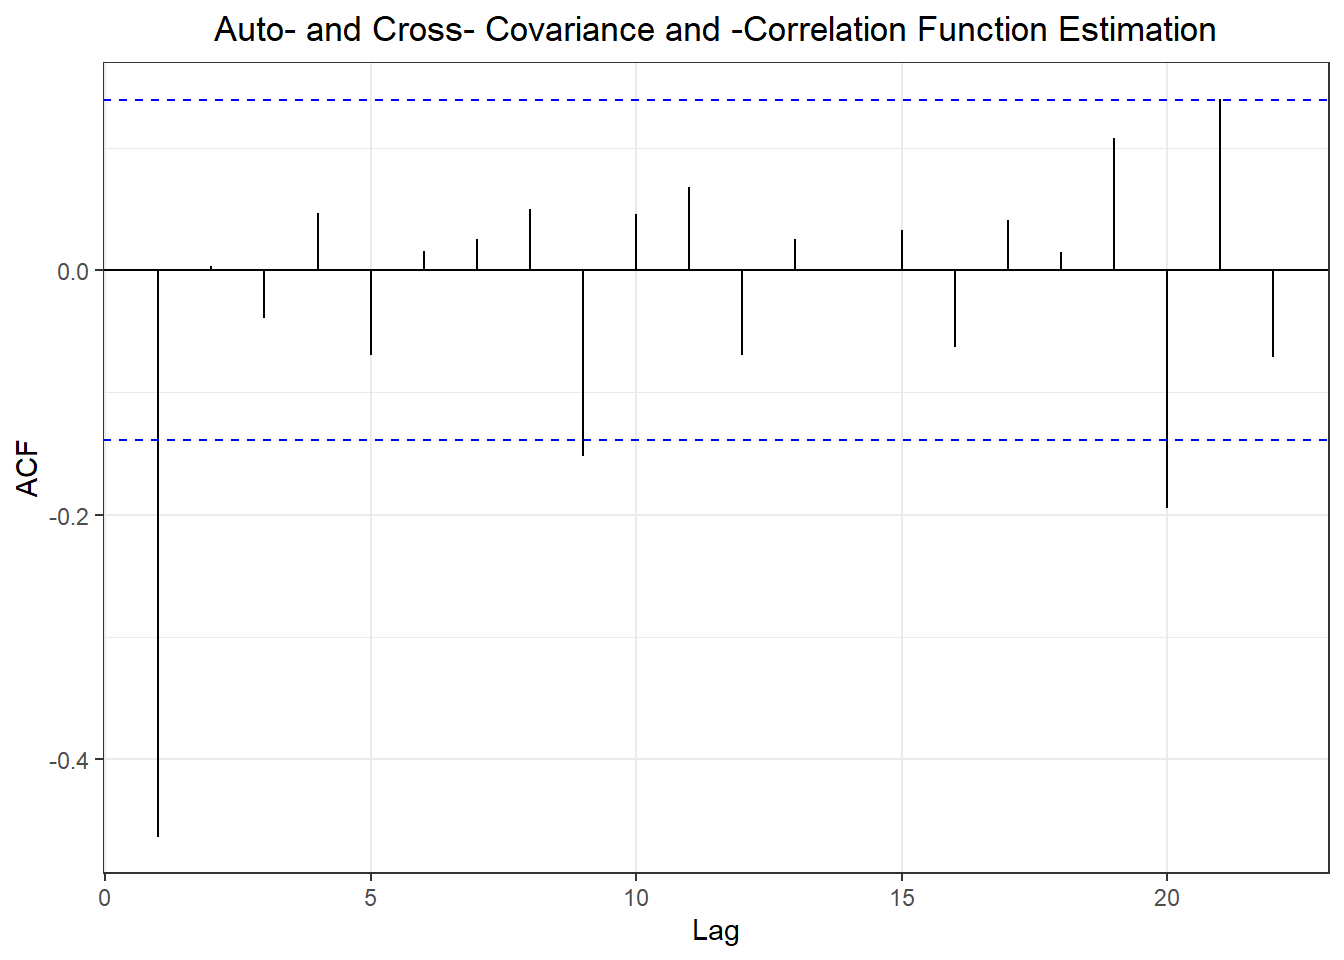
## Warning in adf.test(x): p-value smaller than printed p-value
##
##  Augmented Dickey-Fuller Test
##
## data:  x
## Dickey-Fuller = -10.647, Lag order = 9, p-value = 0.01
## alternative hypothesis: stationary
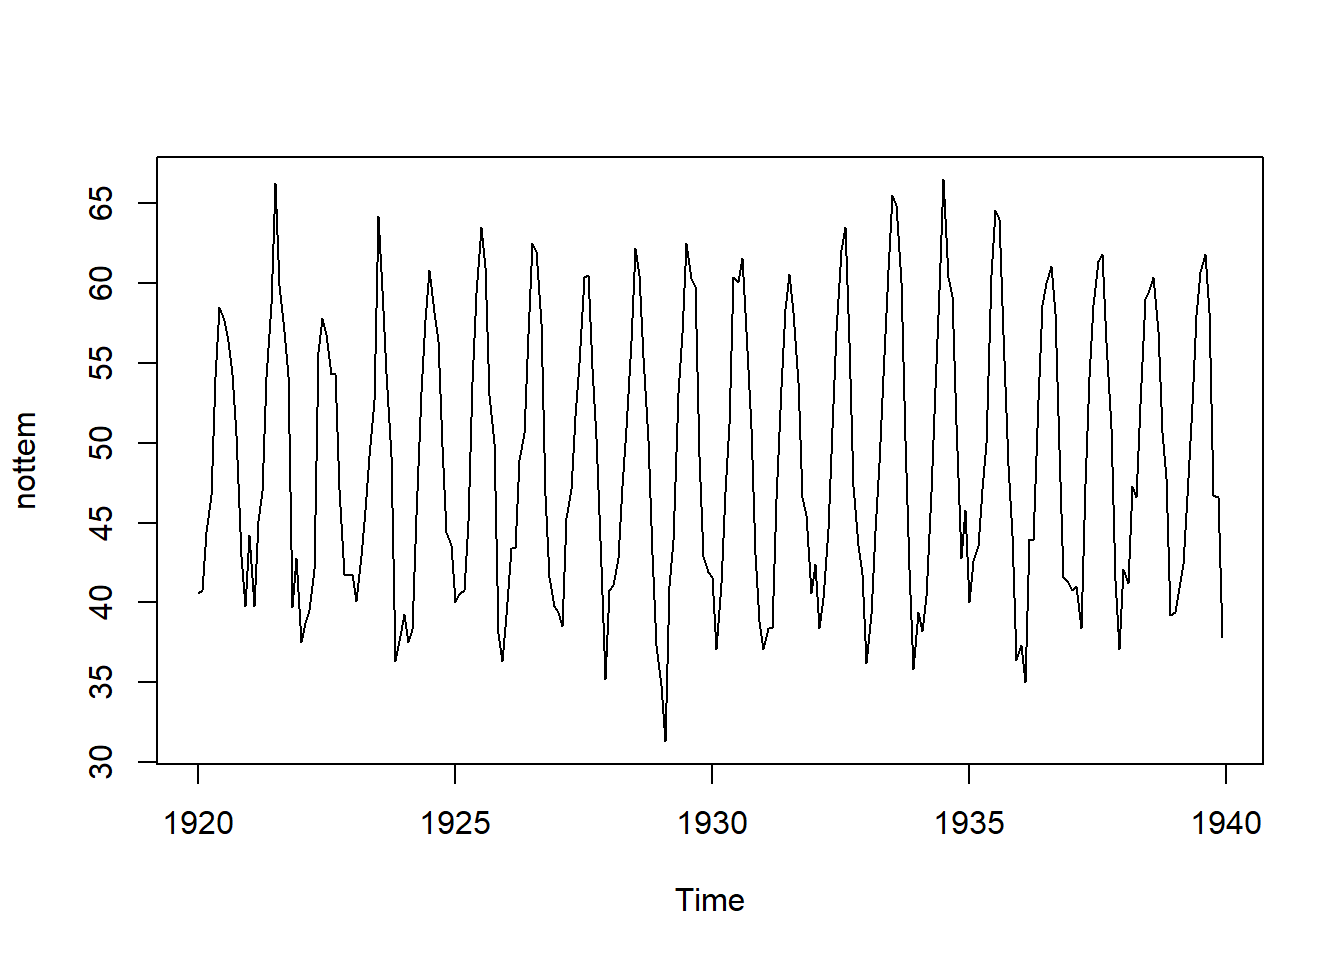
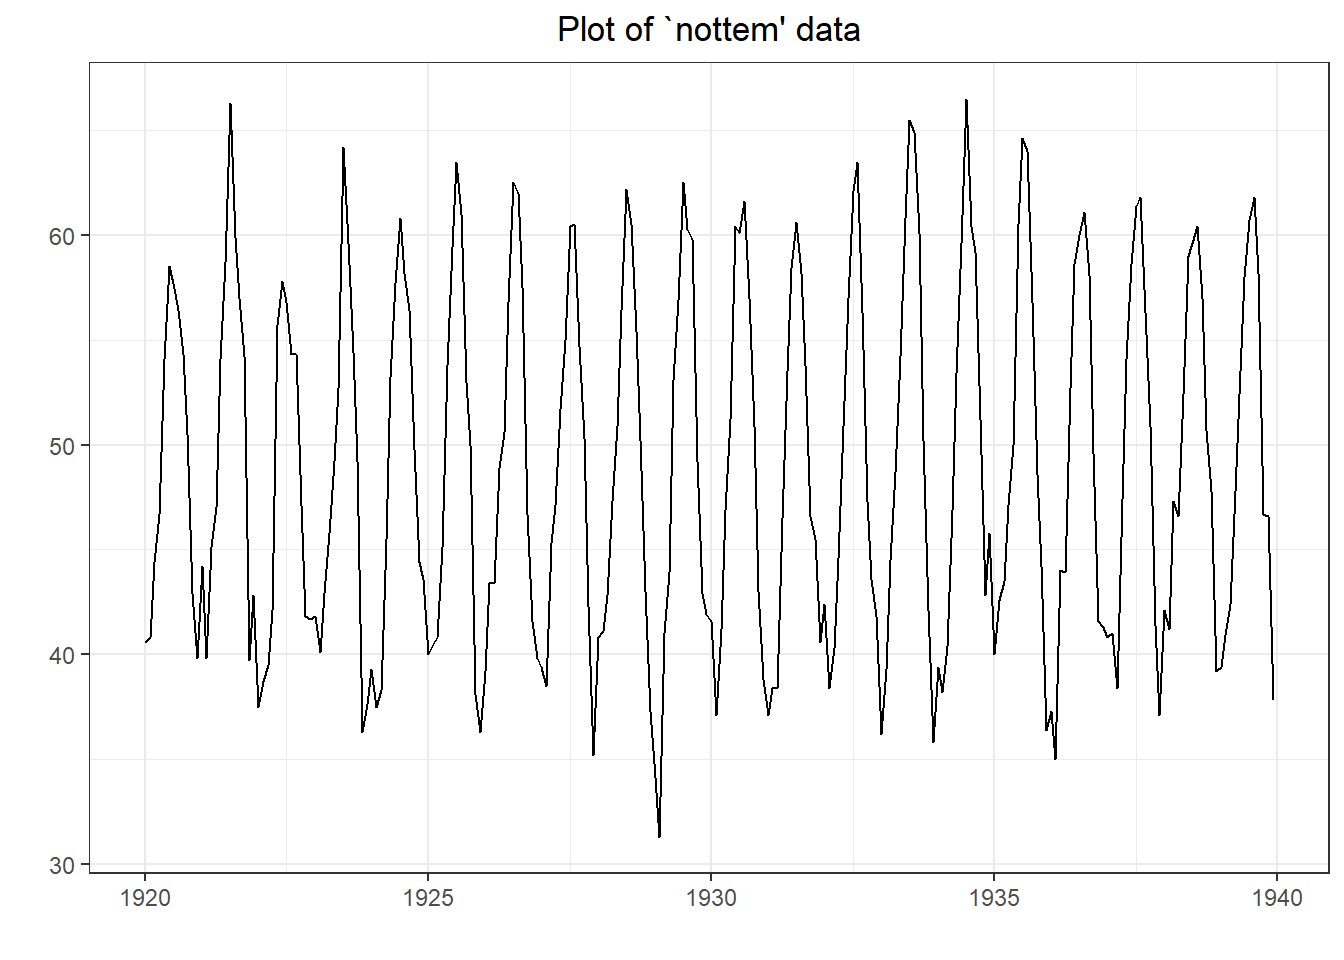
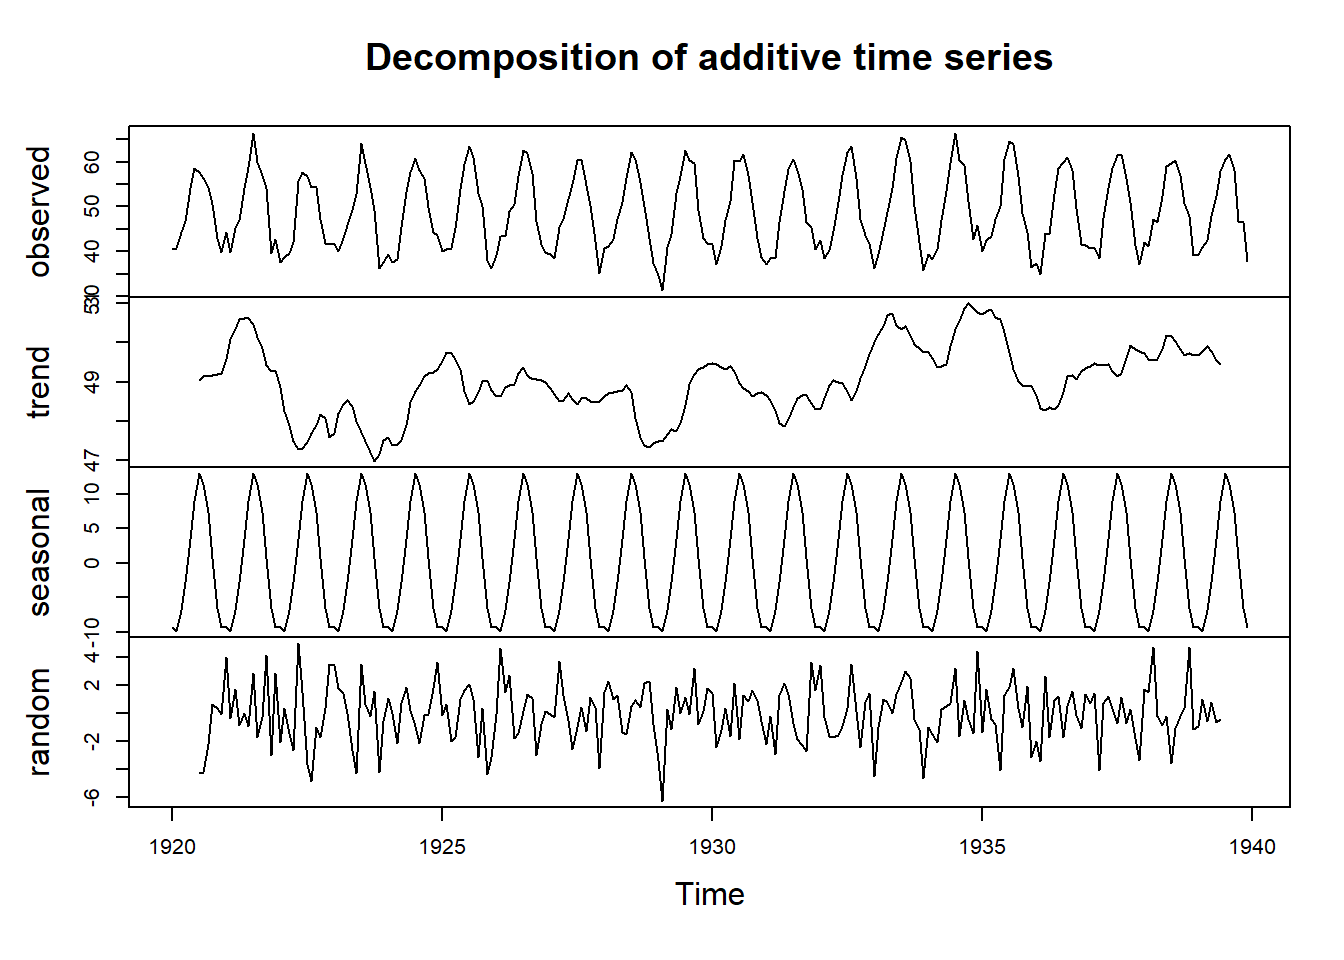
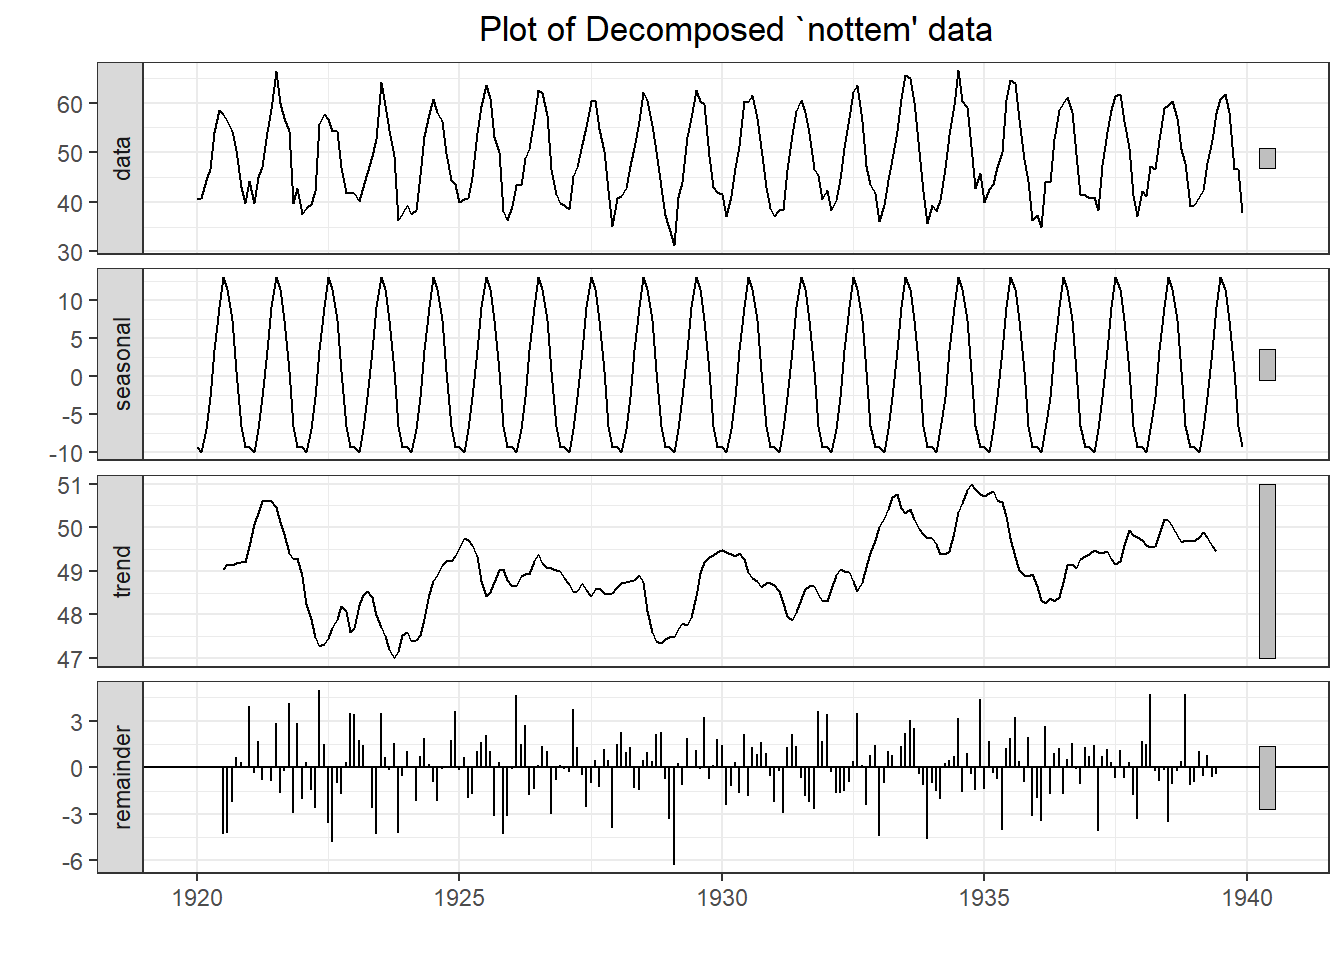
## Warning in adf.test(nottem): p-value smaller than printed p-value
##
##  Augmented Dickey-Fuller Test
##
## data:  nottem
## Dickey-Fuller = -12.998, Lag order = 6, p-value = 0.01
## alternative hypothesis: stationary
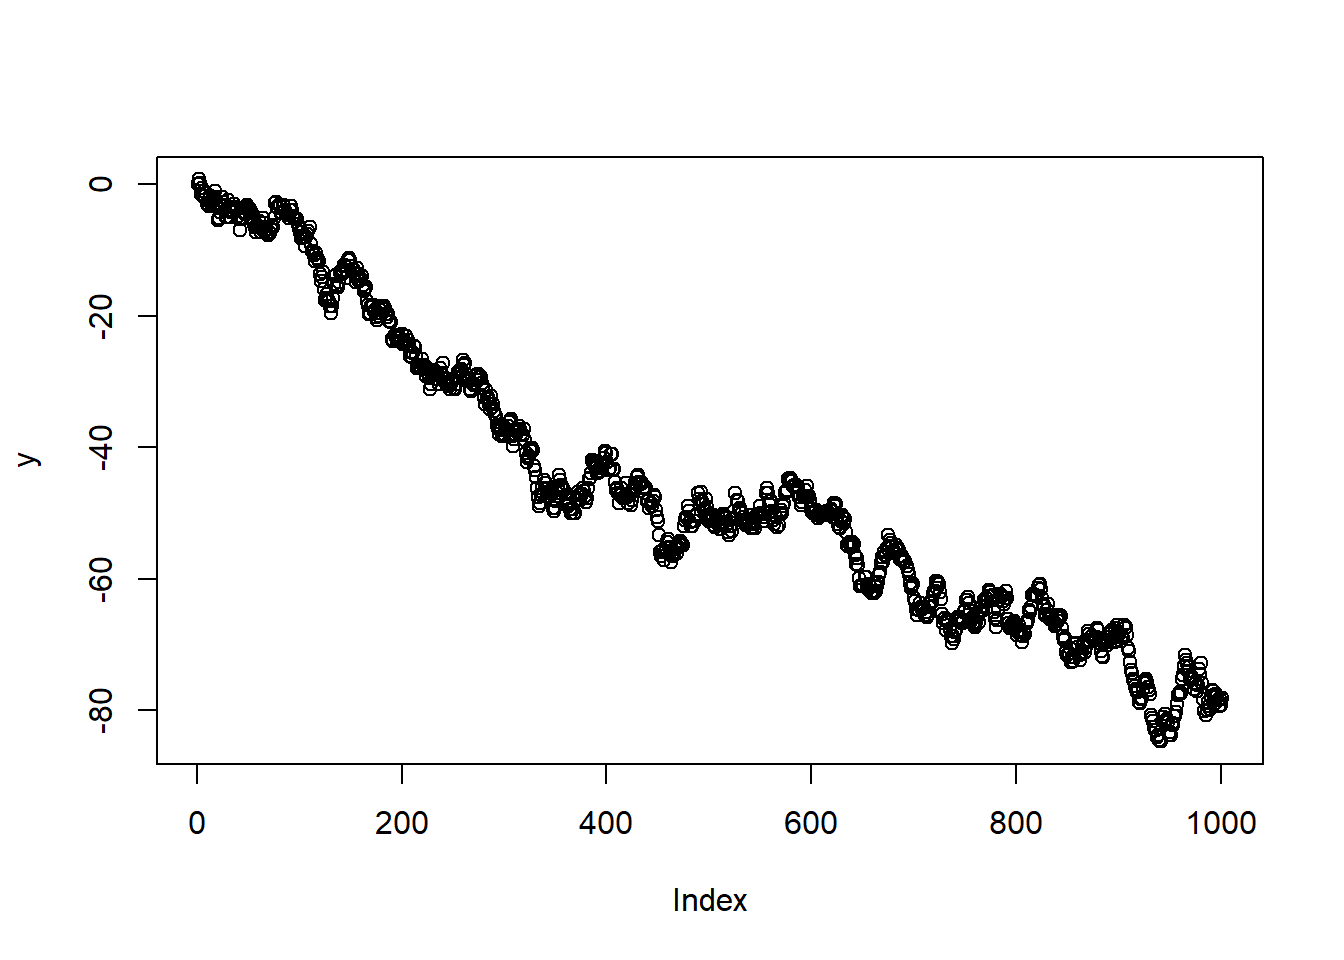
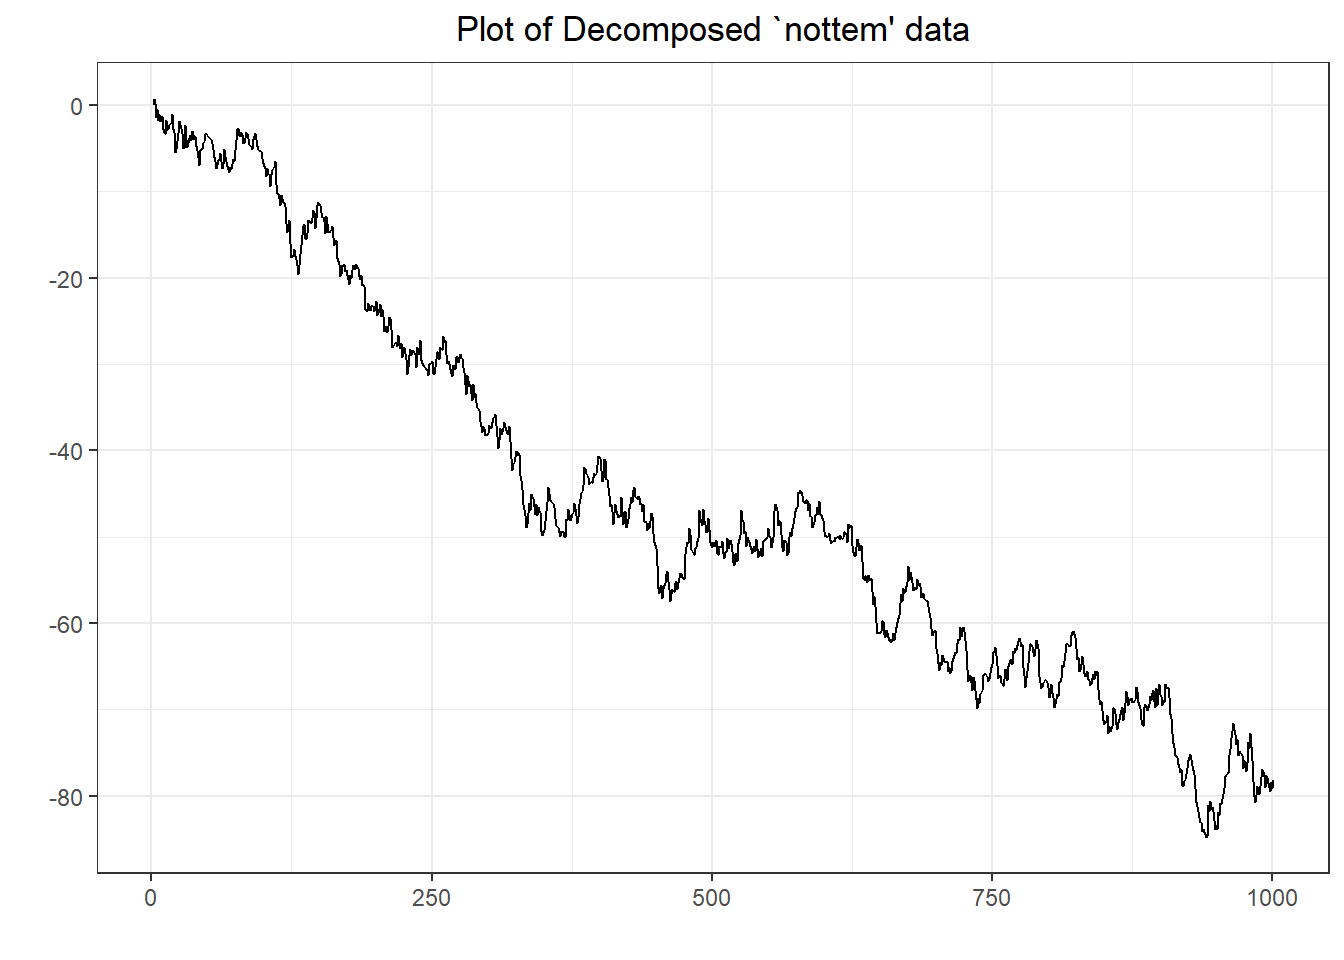
##
##  Augmented Dickey-Fuller Test
##
## data:  y
## Dickey-Fuller = -2.6432, Lag order = 9, p-value = 0.3061
## alternative hypothesis: stationary
## [1] 114
## Time Series:
## Start = 1821
## End = 1826
## Frequency = 1
## [1]  269  321  585  871 1475 2821
## [1] 321 585 871 1475 2821 3928
## [1] 269 321 585 871 1475 2821
##
##  Durbin-Watson test
##
## data:  lynx[-114] ~ lynx[-1]
## DW = 1.1296, p-value = 1.148e-06
## alternative hypothesis: true autocorrelation is greater than 0
##
##  Durbin-Watson test
##
## data:  x[-700] ~ x[-1]
## DW = 1.996, p-value = 0.4789
## alternative hypothesis: true autocorrelation is greater than 0
## [1] 240
##
##  Durbin-Watson test
##
## data:  nottem[-240] ~ nottem[-1]
## DW = 1.0093, p-value = 5.097e-15
## alternative hypothesis: true autocorrelation is greater than 0
##
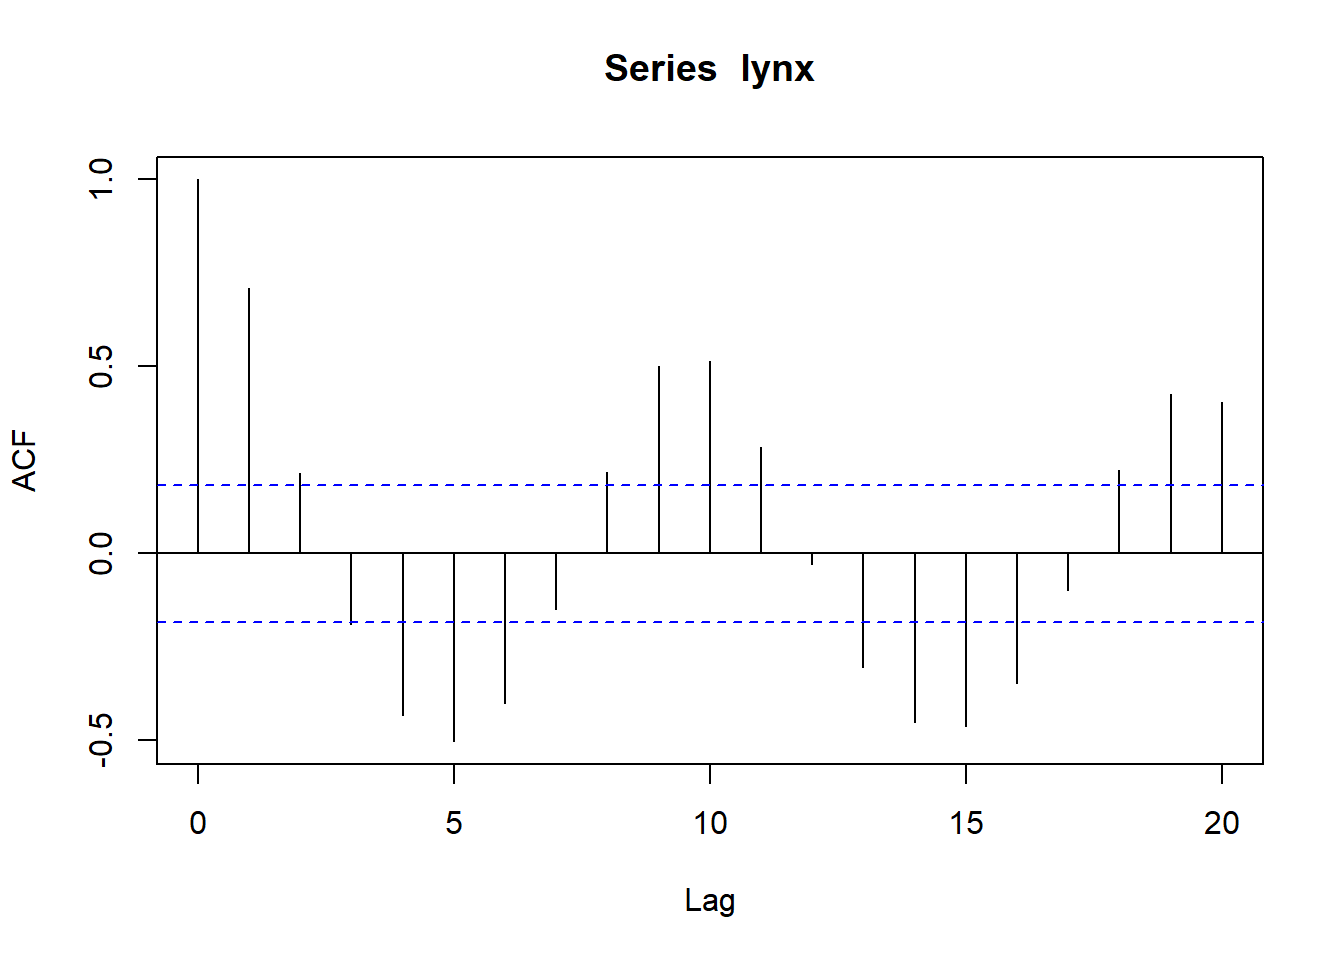
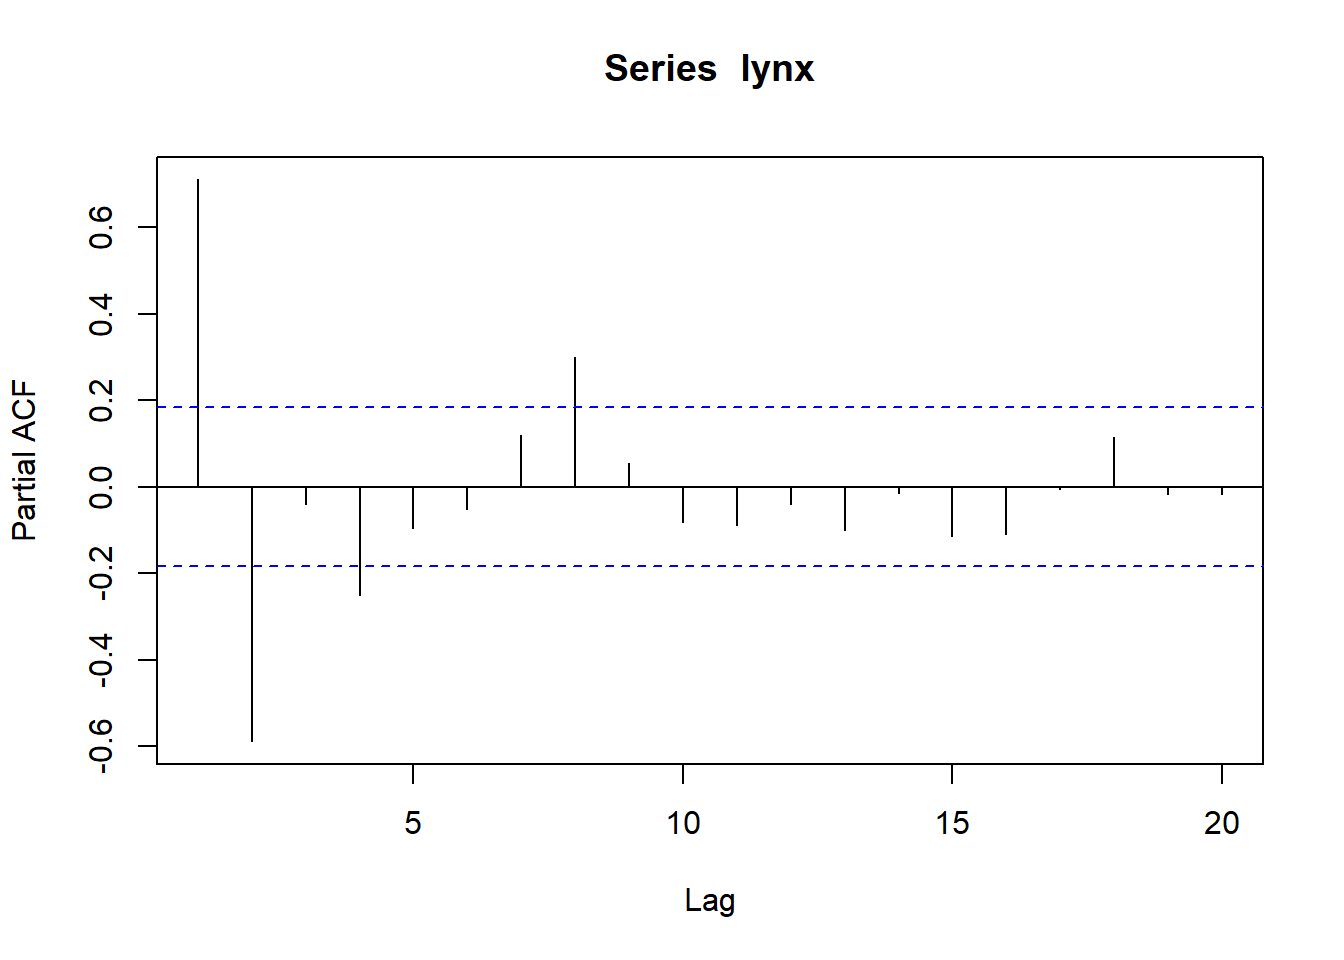
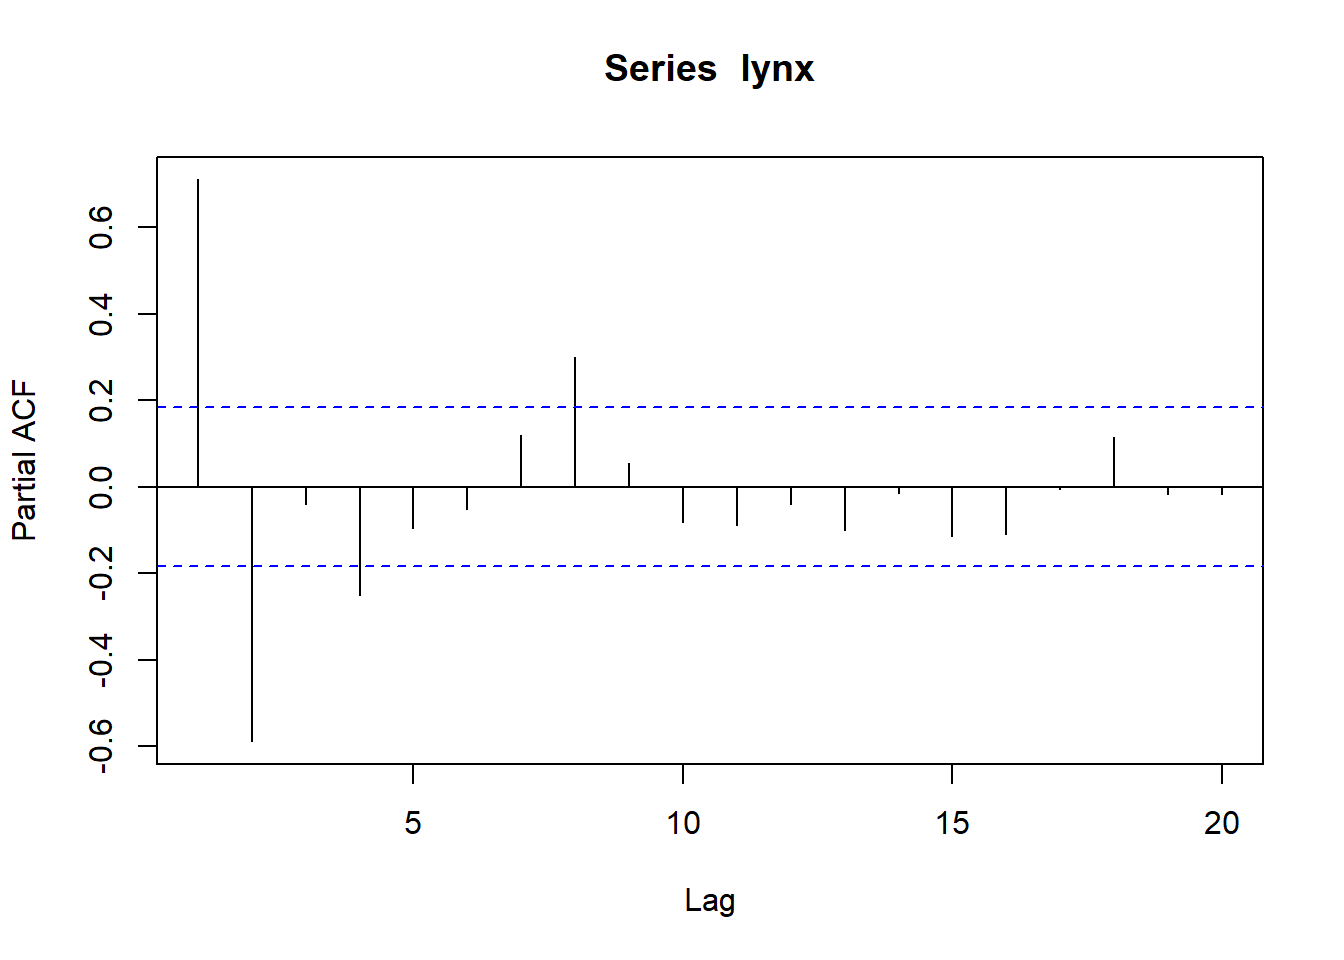
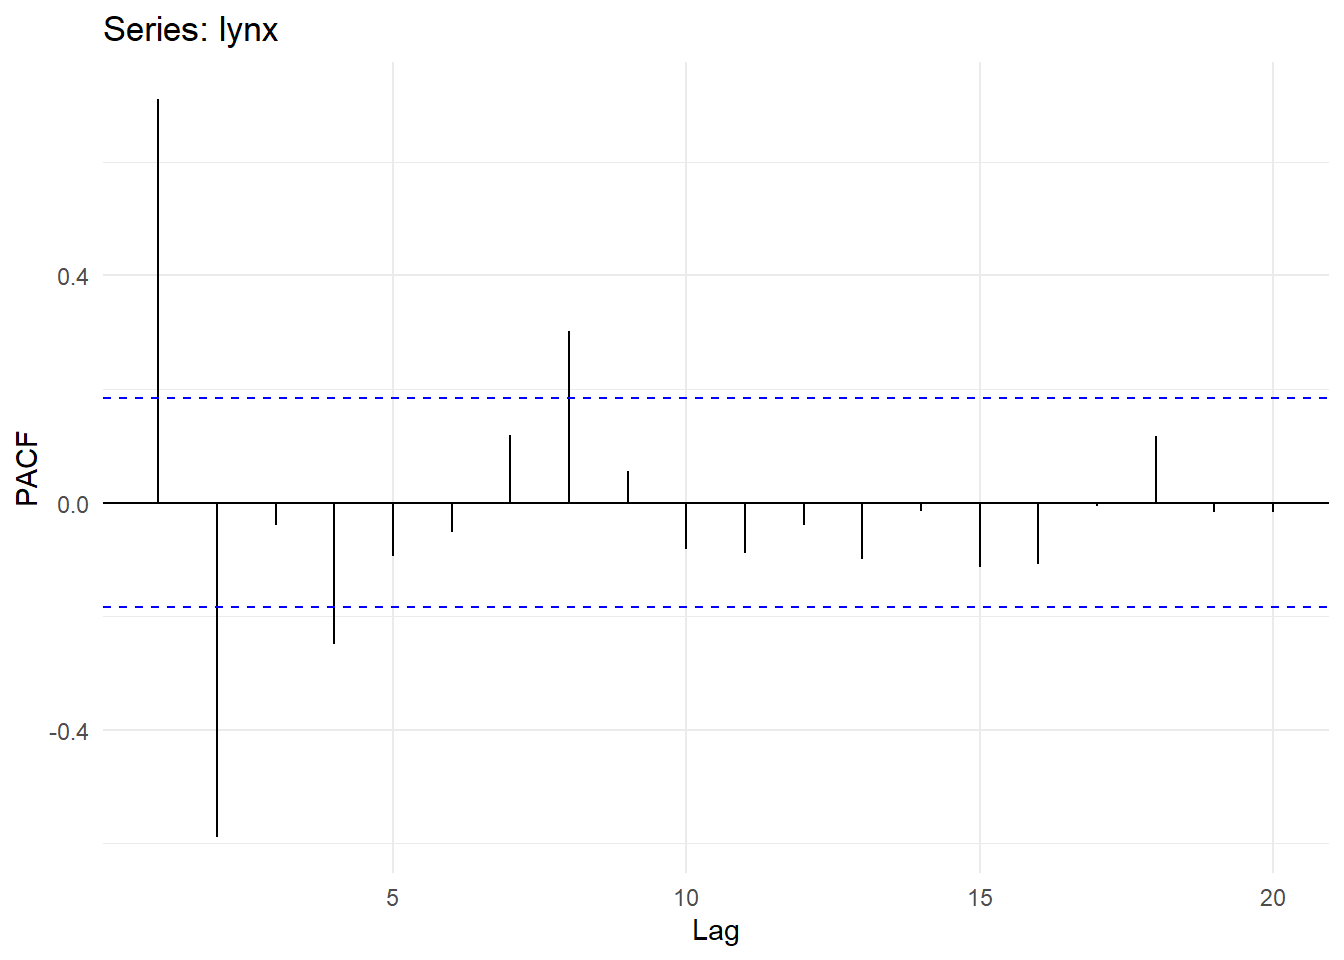
## Partial autocorrelations of series 'lynx', by lag
##
##      1      2      3      4      5      6      7      8      9     10
##  0.711 -0.588 -0.039 -0.250 -0.094 -0.052  0.119  0.301  0.055 -0.081
##     11     12     13     14     15     16     17     18     19     20
## -0.089 -0.040 -0.099 -0.014 -0.113 -0.108 -0.006  0.116 -0.016 -0.018
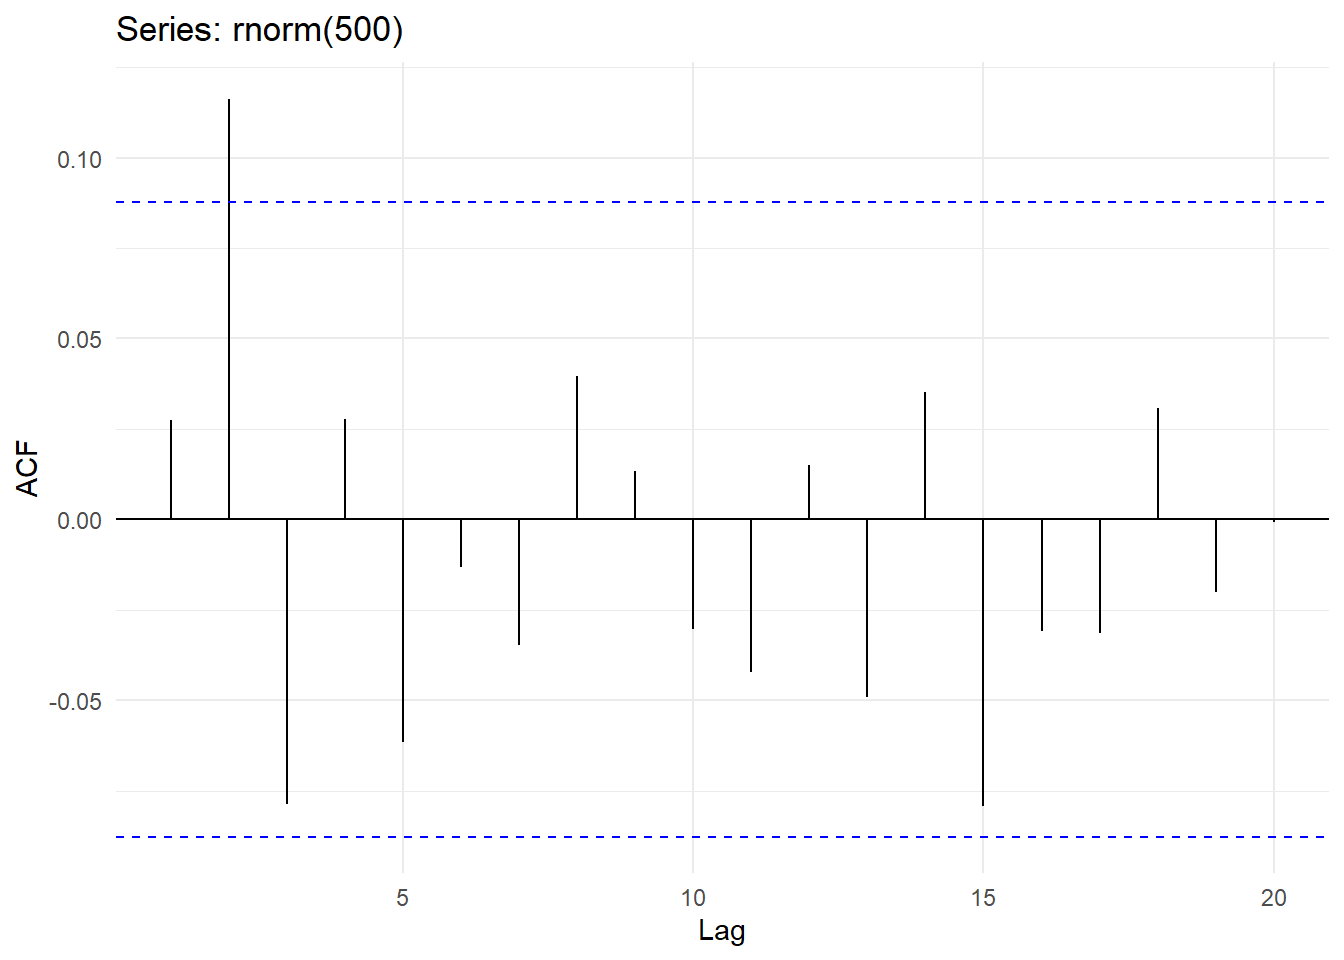
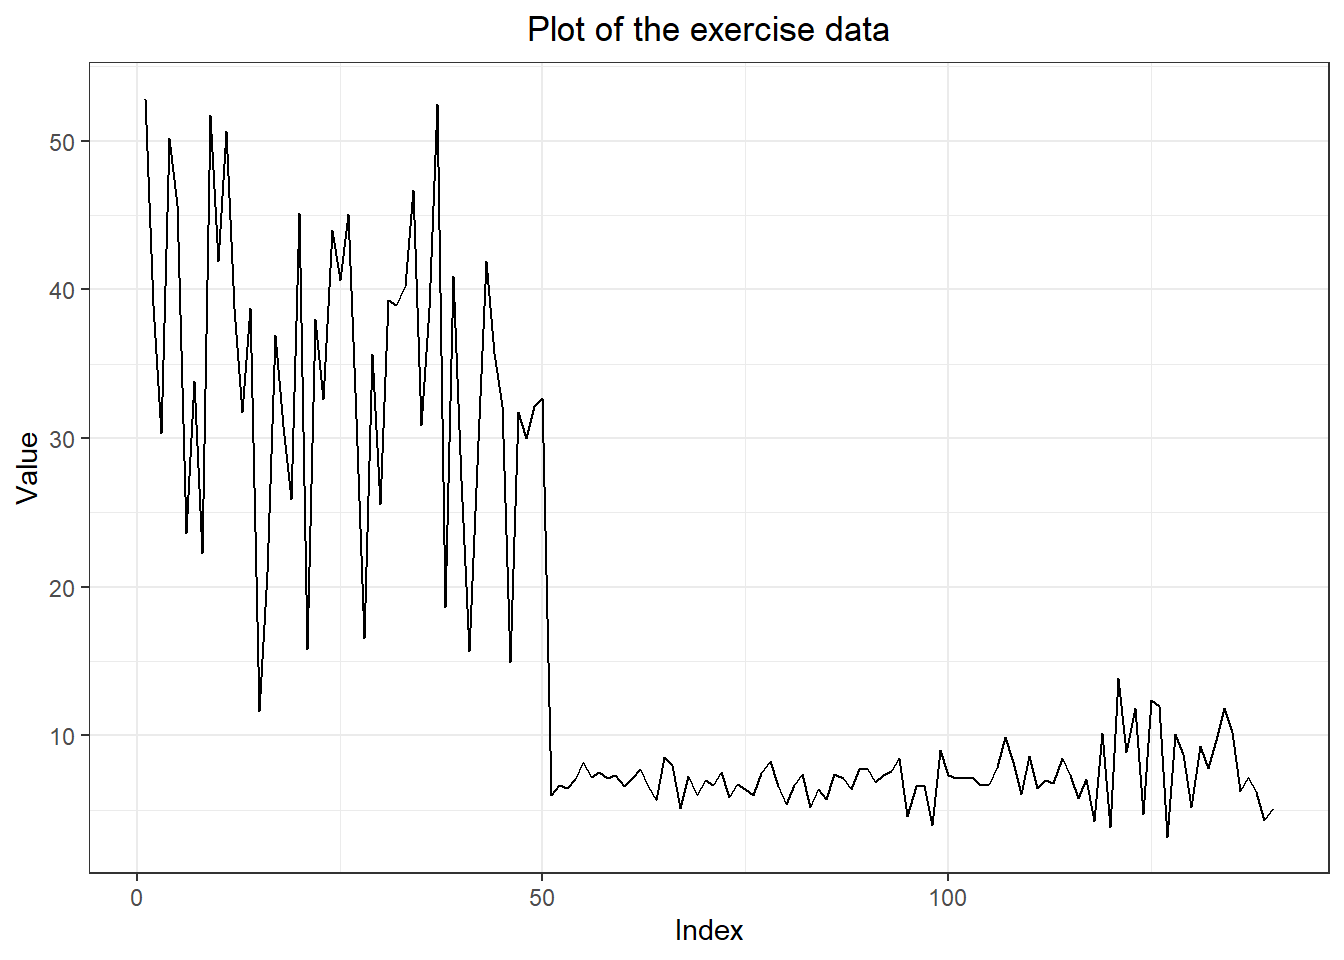
#2. three forecasting models
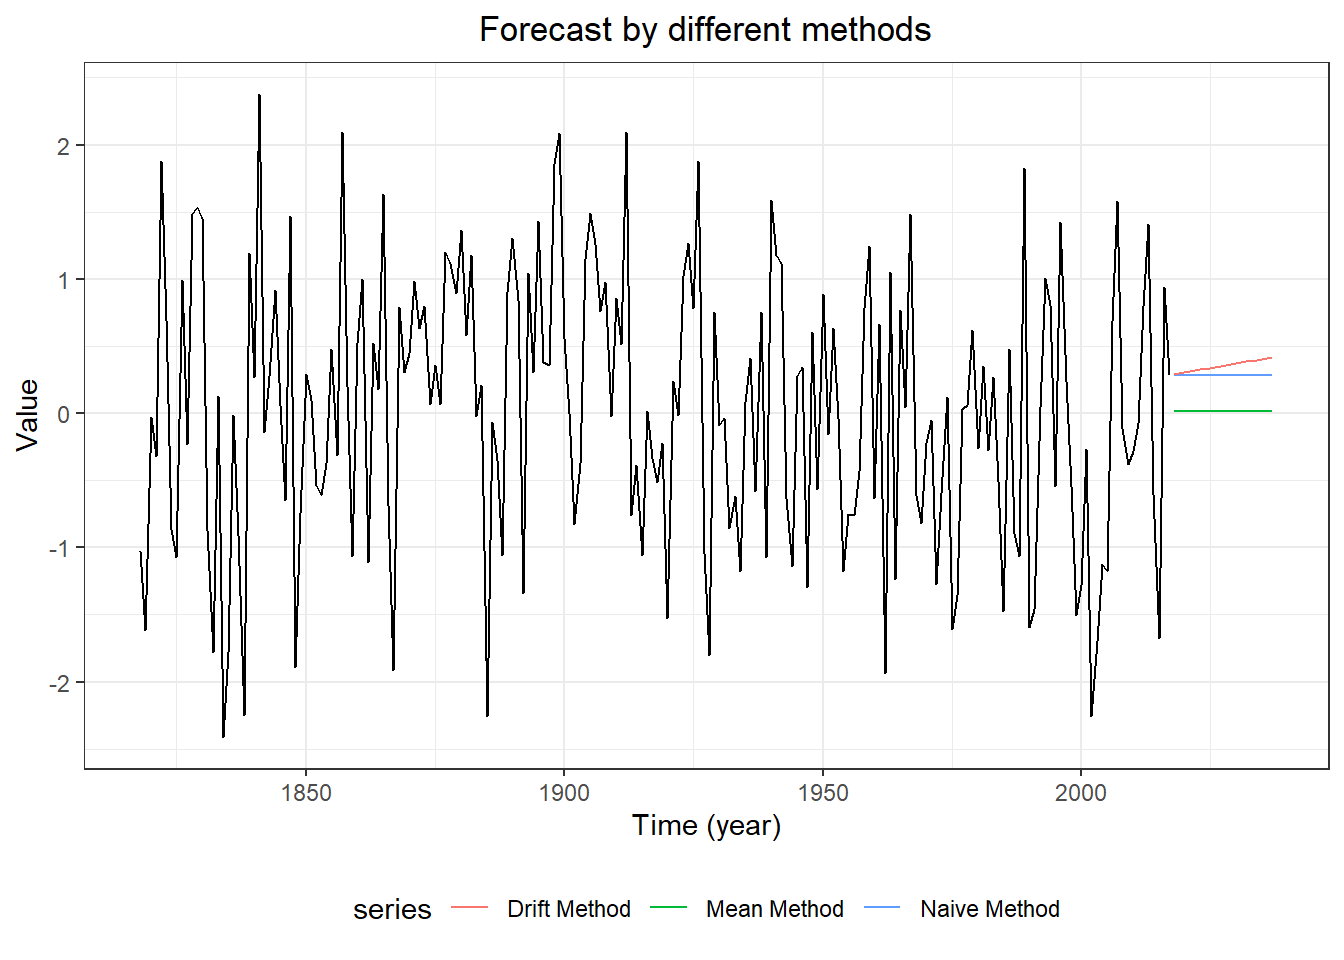
meanm <- meanf(myts, h = 10)
naivem <- naive(myts, h= 10)
driftm <- rwf(myts, h =10, drift = TRUE)

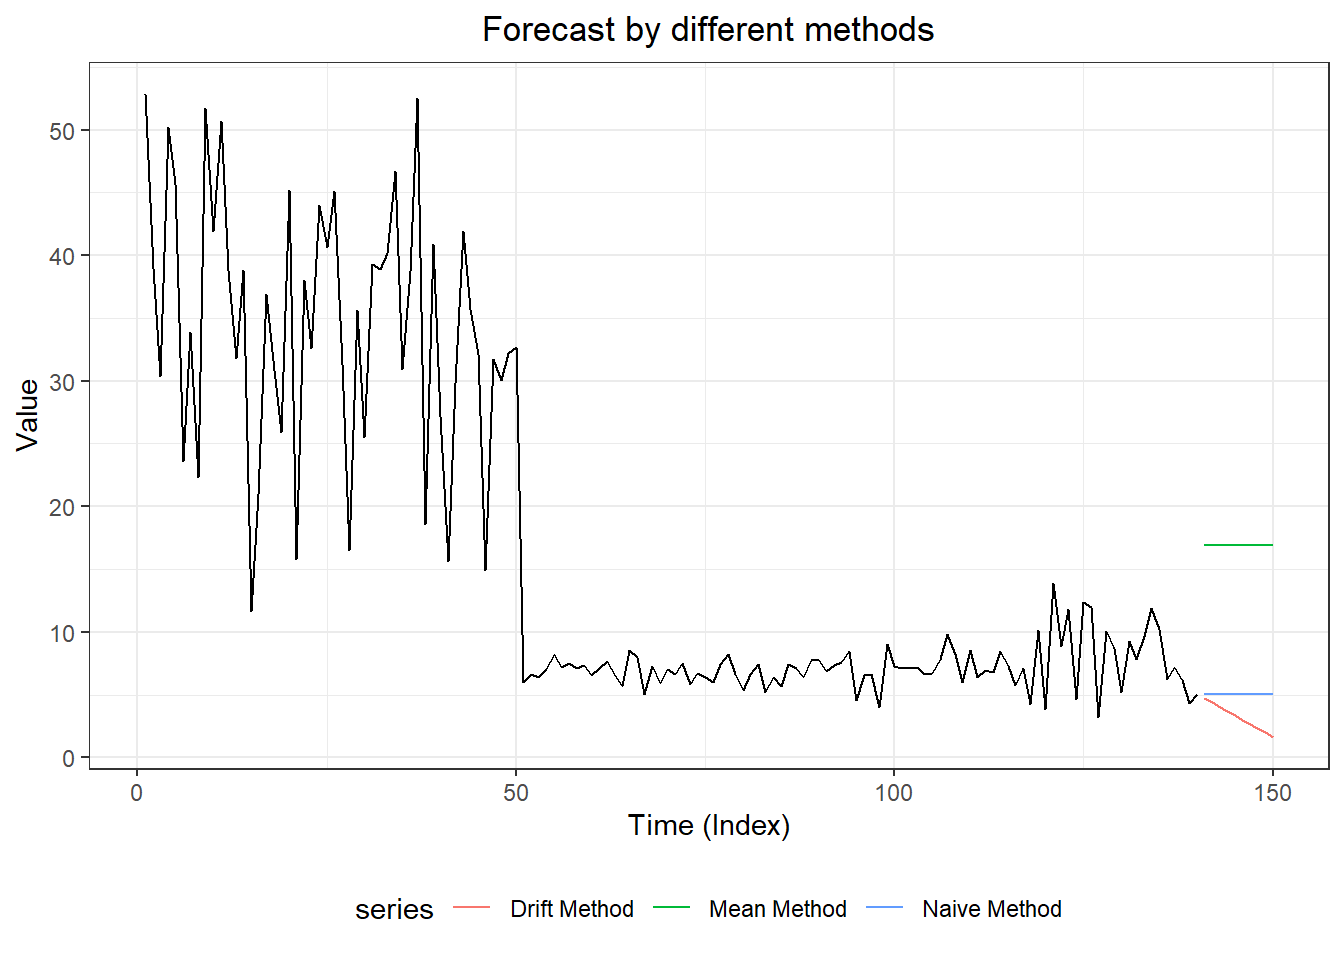
#3. plot forecasts from three forecasting models
forecast::autoplot(myts,
         PI = TRUE,
         flwd = 2) +
  autolayer(meanm$mean, series = "Mean Method", PI = TRUE) +
  autolayer(naivem$mean, series = "Naive Method", PI = TRUE) +
  autolayer(driftm$mean, series = "Drift Method", PI = TRUE) +
  ggtitle("Forecast by different methods") +
  xlab("Time (Index)") + ylab("Value") +
  theme_bw() +
  theme(plot.title = element_text(hjust = 0.5),
        legend.position = "bottom")
## Warning: Ignoring unknown parameters: PI, flwd
## Warning: Ignoring unknown parameters: PI

## Warning: Ignoring unknown parameters: PI

## Warning: Ignoring unknown parameters: PI
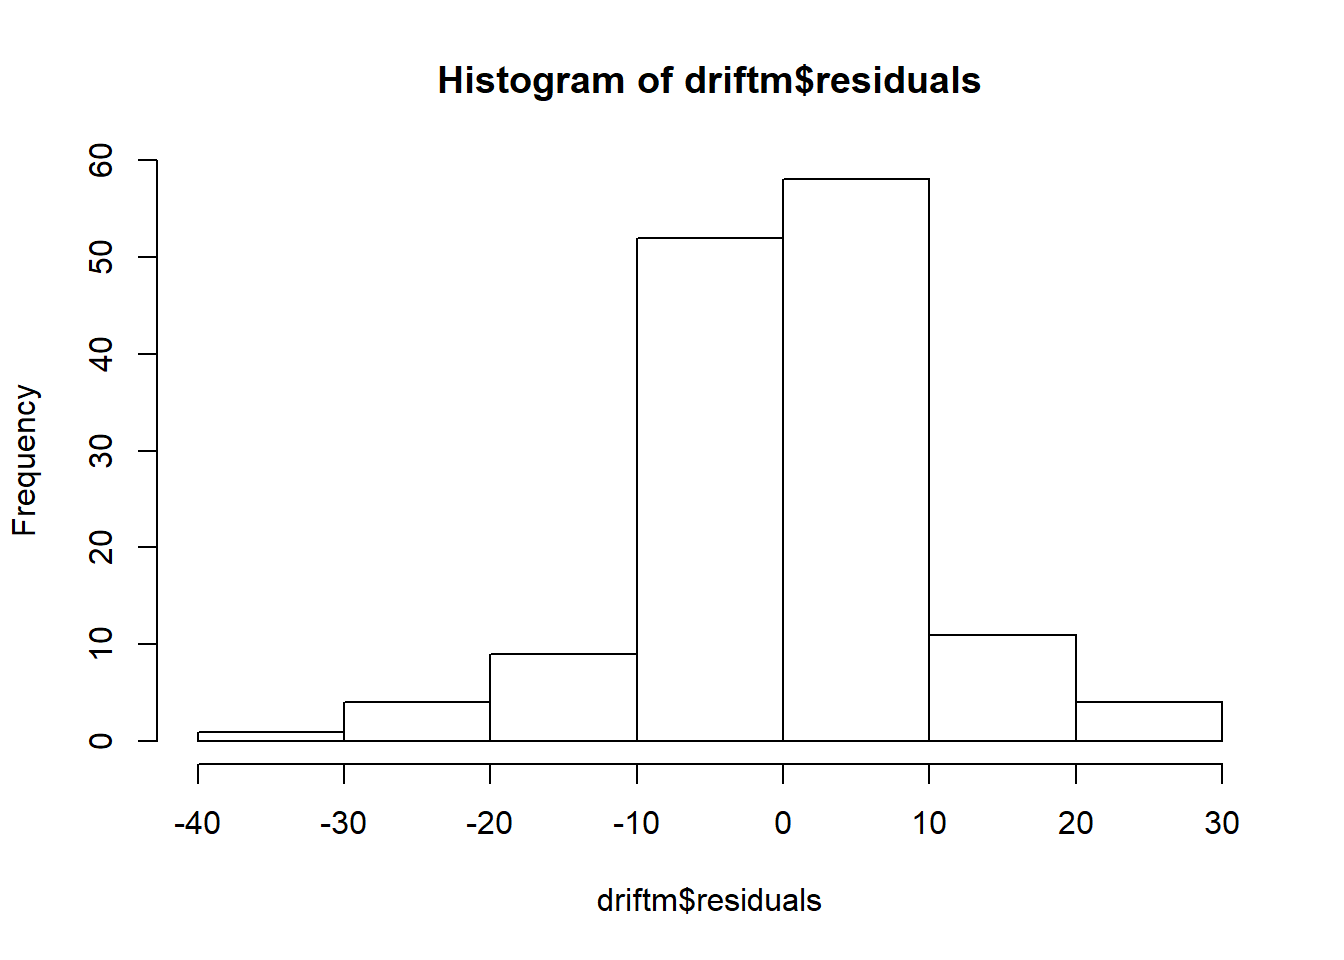
## [1] 211.0364
## [1] -1.591522e-15
## [1] NA
## [1] 84.53723
## [1] -0.3435748
## [1] 84.53723
## [1] 2.648343e-15
## Don't know how to automatically pick scale for object of type ts. Defaulting to continuous.
## `stat_bin()` using `bins = 30`. Pick better value with `binwidth`.
## Warning: Removed 1 rows containing non-finite values (stat_bin).
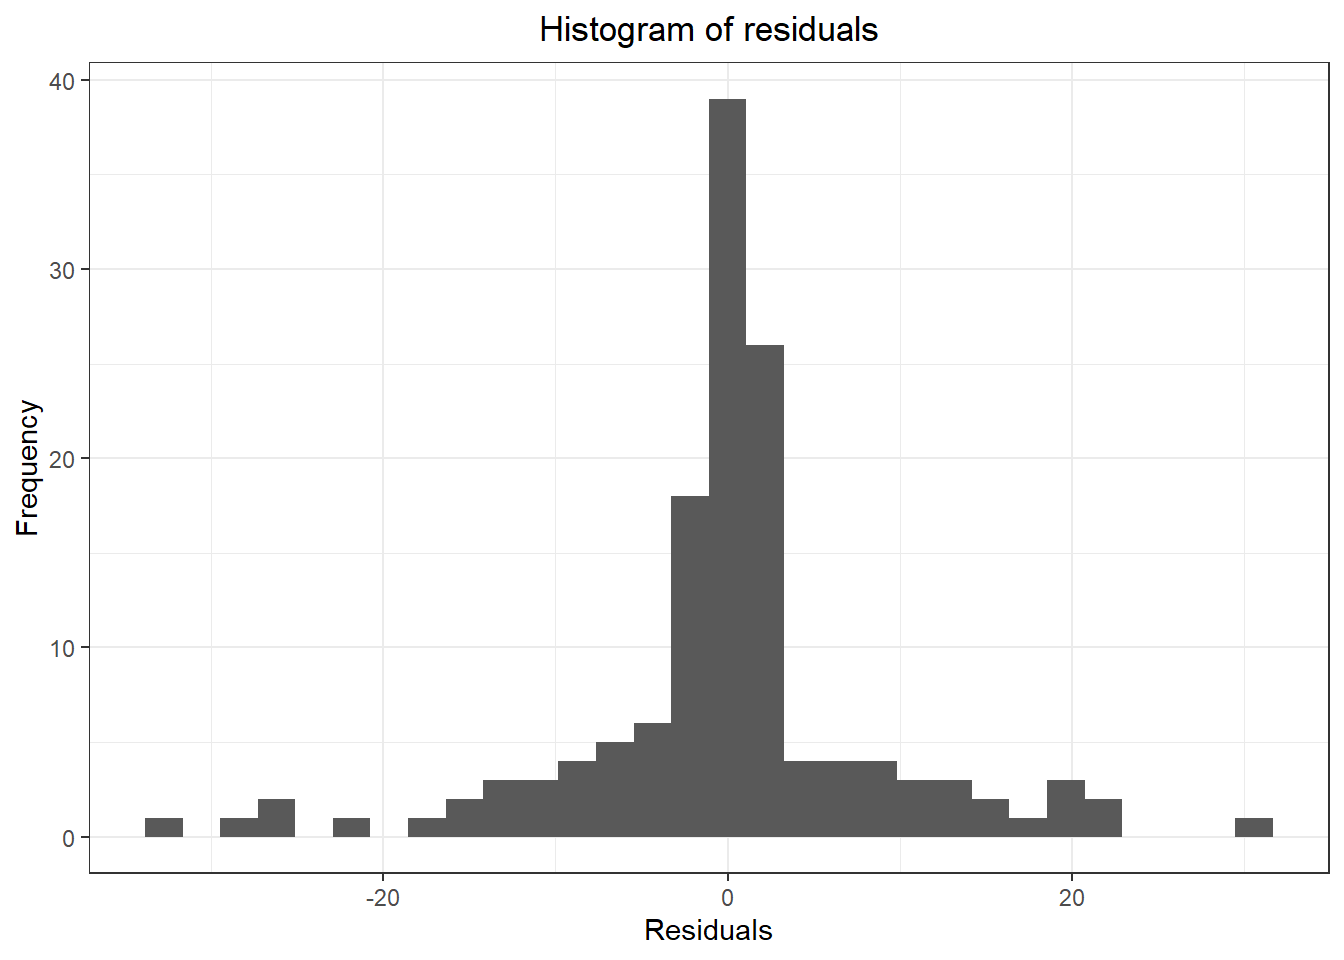
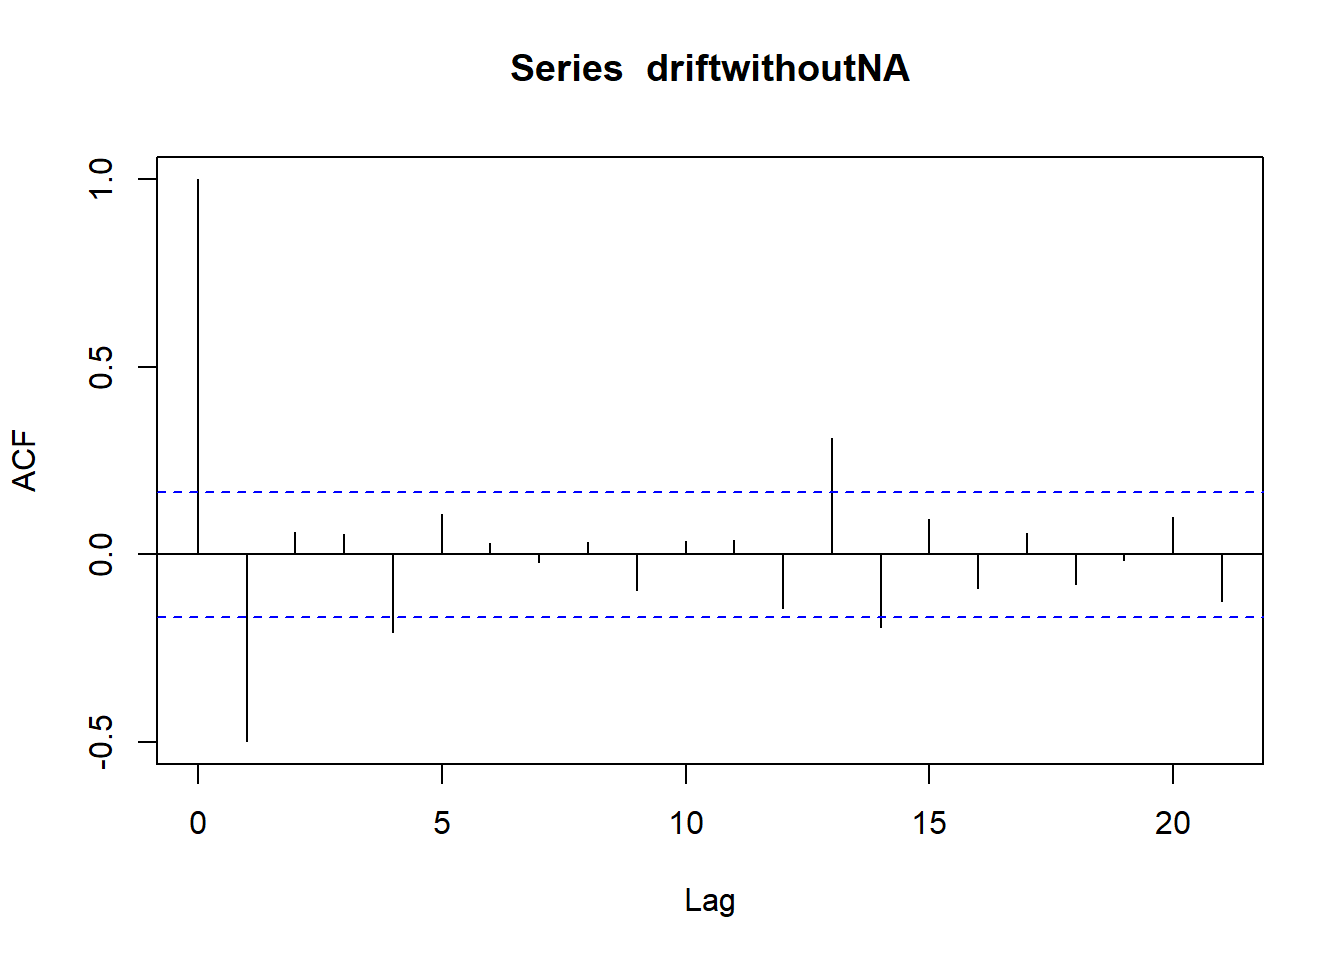
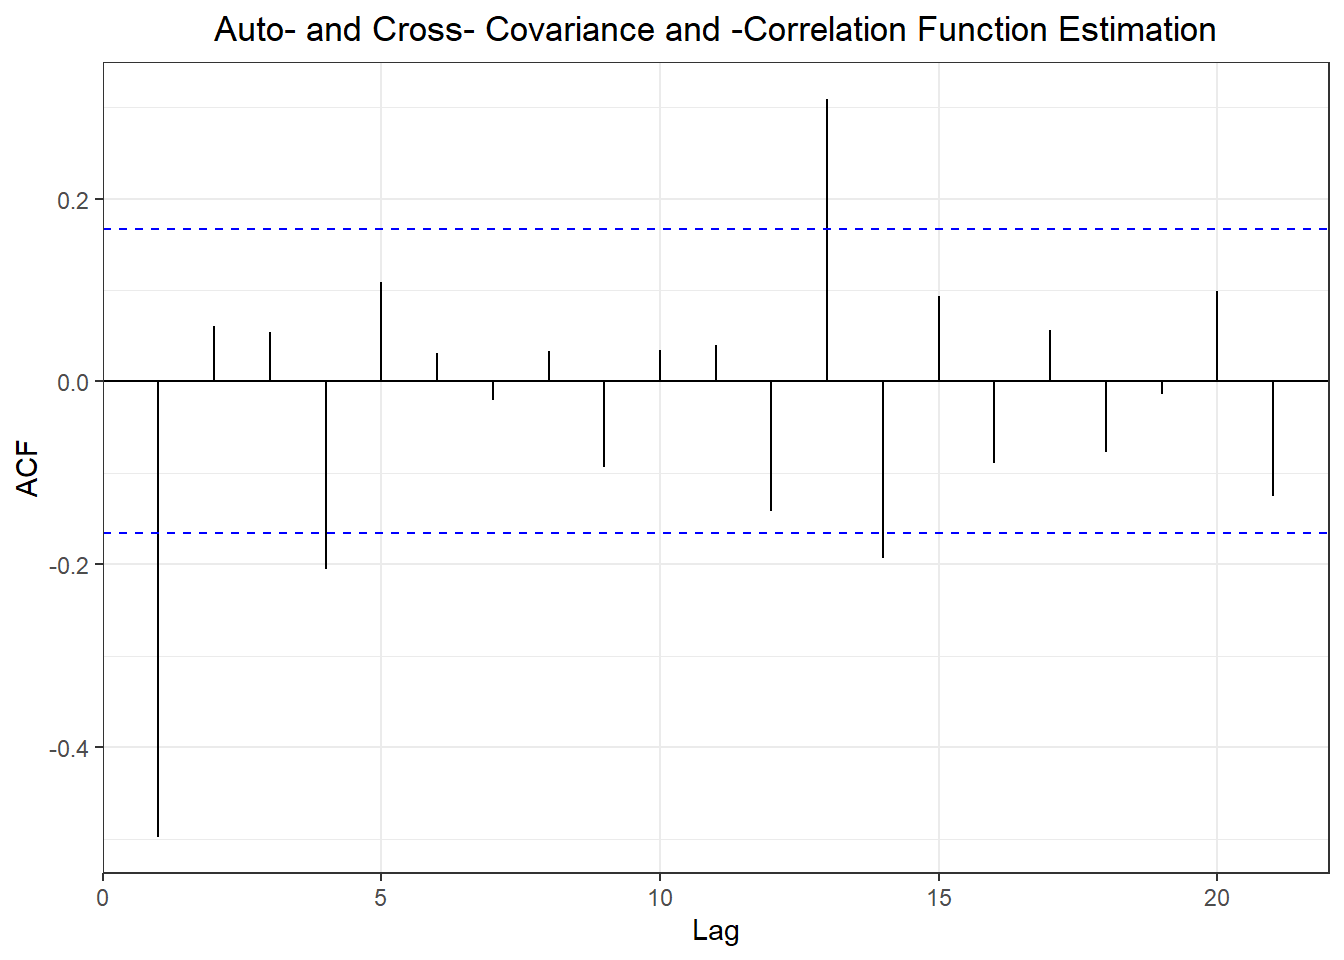
##                         ME     RMSE      MAE        MPE     MAPE     MASE
## Training set -6.408719e-16 15.31467 13.94736  -84.86989 120.4406 2.231924
## Test set     -1.125187e+01 11.61073 11.25187 -180.27778 180.2778 1.800578
##                    ACF1 Theil's U
## Training set  0.7632991        NA
## Test set     -0.1703445  2.002248
##                      ME      RMSE      MAE        MPE     MAPE      MASE
## Training set -0.4131666 10.024449 6.249032 -11.909758 33.36297 1.0000000
## Test set      0.9663084  3.022963 2.482045  -1.869095 33.51426 0.3971888
##                    ACF1 Theil's U
## Training set -0.4901263        NA
## Test set     -0.1703445 0.6497522
##                         ME      RMSE      MAE       MPE     MAPE     MASE
## Training set -1.624594e-17 10.015931 6.265918 -7.901602 33.29565 1.002702
## Test set      6.957224e+00  8.172915 6.974530 86.321252 86.72796 1.116098
##                    ACF1 Theil's U
## Training set -0.4901263        NA
## Test set      0.4327471   1.62159
##
##  Shapiro-Wilk normality test
##
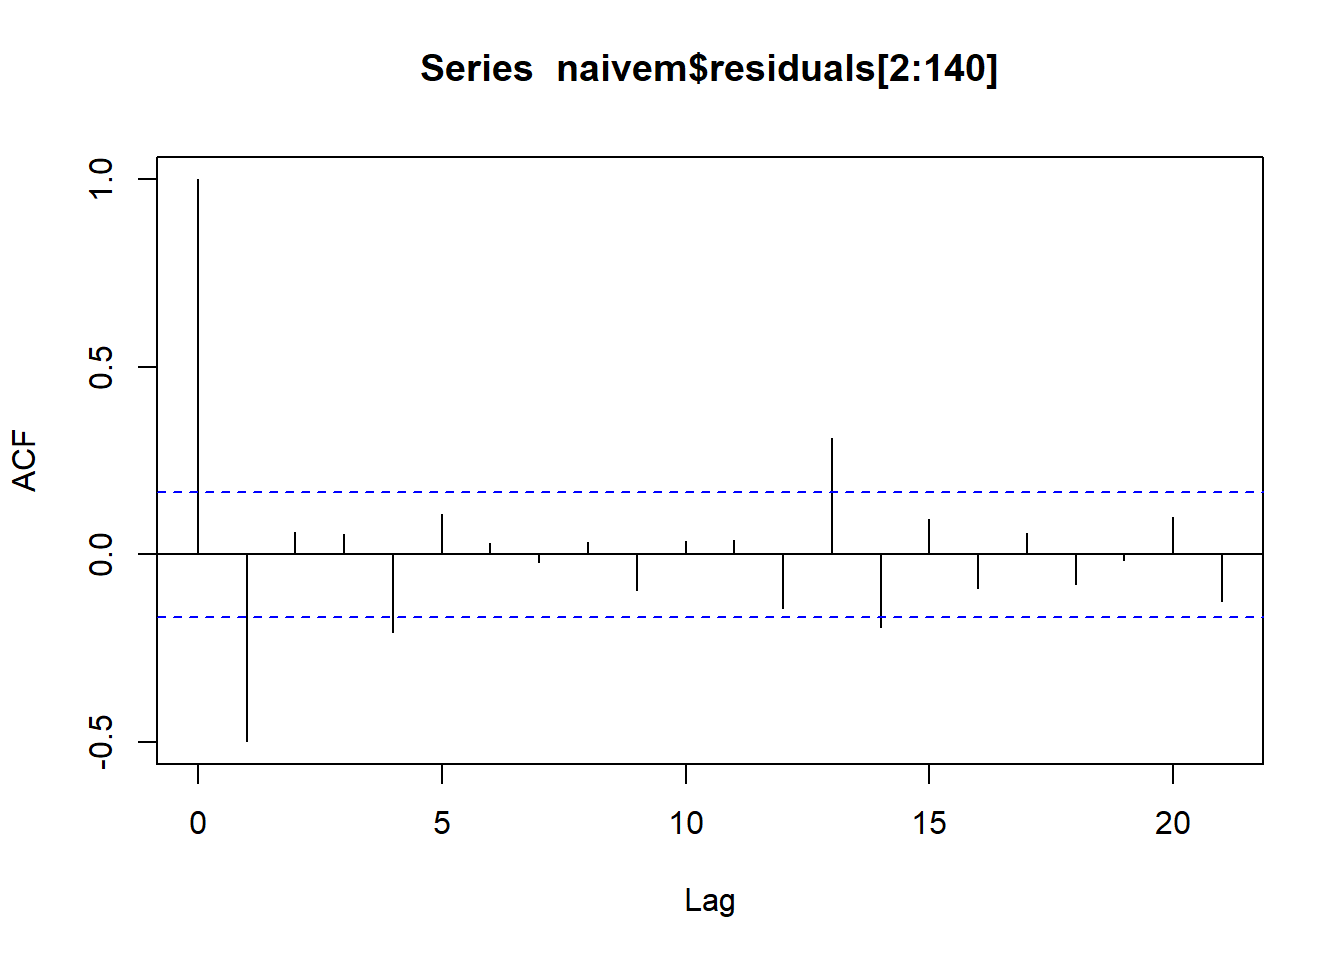
## data:  naivem$residuals
## W = 0.89587, p-value = 2.061e-08
 #2. three forecasting models
 meanm <- meanf(myts, h = 10)
 naivem <- naive(myts, h= 10)
 driftm <- rwf(myts, h =10, drift = TRUE)

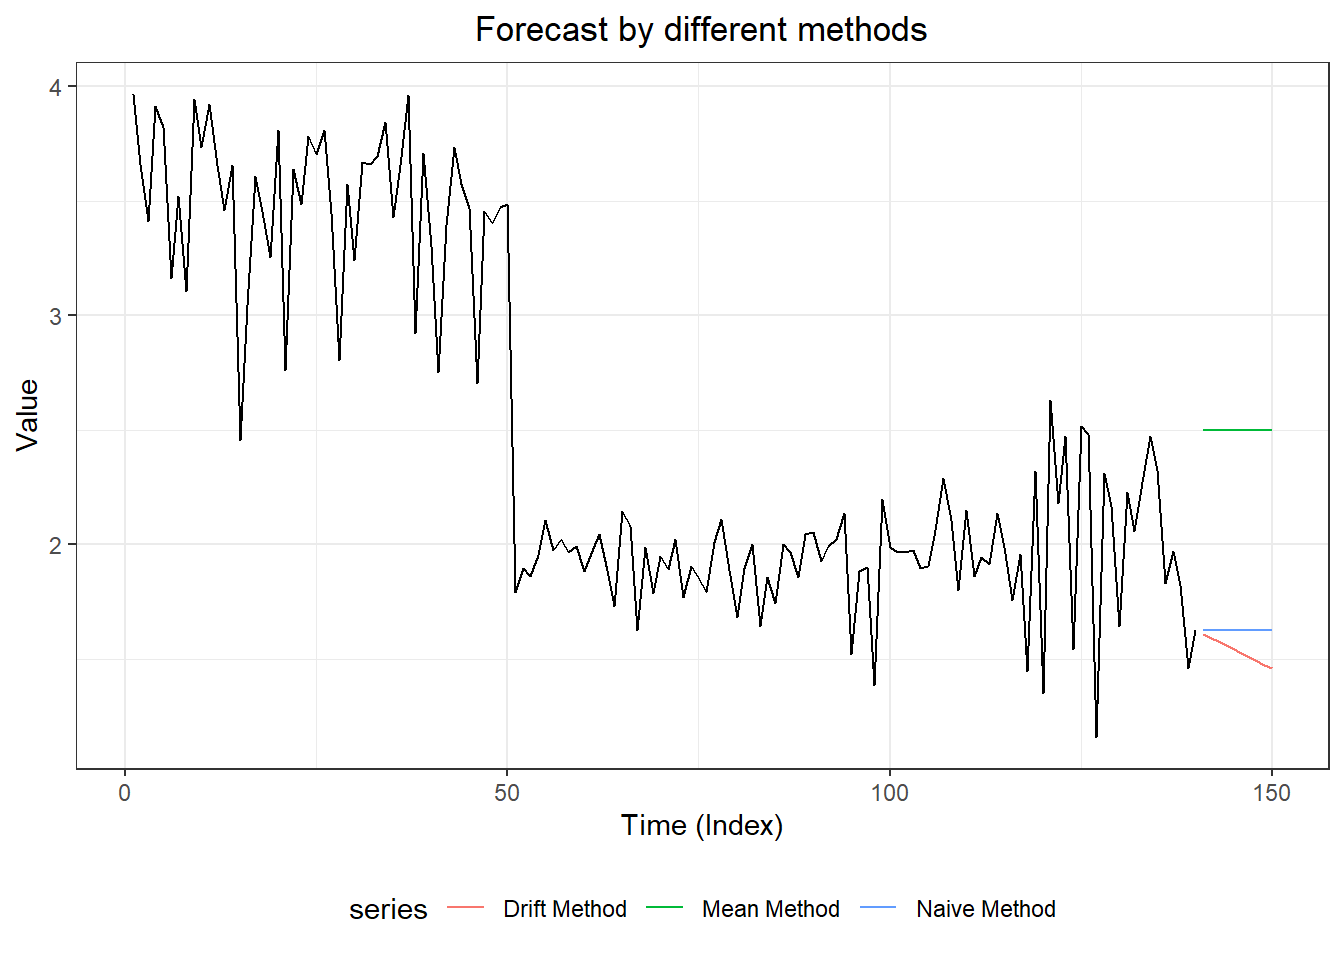
 #3. plot forecasts from three forecasting models
 forecast::autoplot(myts,
                    PI = TRUE,
                    flwd = 2) +
   autolayer(meanm$mean, series = "Mean Method", PI = TRUE) +
   autolayer(naivem$mean, series = "Naive Method", PI = TRUE) +
   autolayer(driftm$mean, series = "Drift Method", PI = TRUE) +
   ggtitle("Forecast by different methods") +
   xlab("Time (Index)") + ylab("Value") +
   theme_bw() +
   theme(plot.title = element_text(hjust = 0.5),
         legend.position = "bottom")
## Warning: Ignoring unknown parameters: PI, flwd

## Warning: Ignoring unknown parameters: PI

## Warning: Ignoring unknown parameters: PI

## Warning: Ignoring unknown parameters: PI
## [1] 0.6290444
## [1] 1.510731e-16
## [1] NA
## [1] 0.2067372
## [1] -0.01684688
## [1] 0.2067372
## [1] -4.472841e-17
## Don't know how to automatically pick scale for object of type ts. Defaulting to continuous.
## `stat_bin()` using `bins = 30`. Pick better value with `binwidth`.
## Warning: Removed 1 rows containing non-finite values (stat_bin).
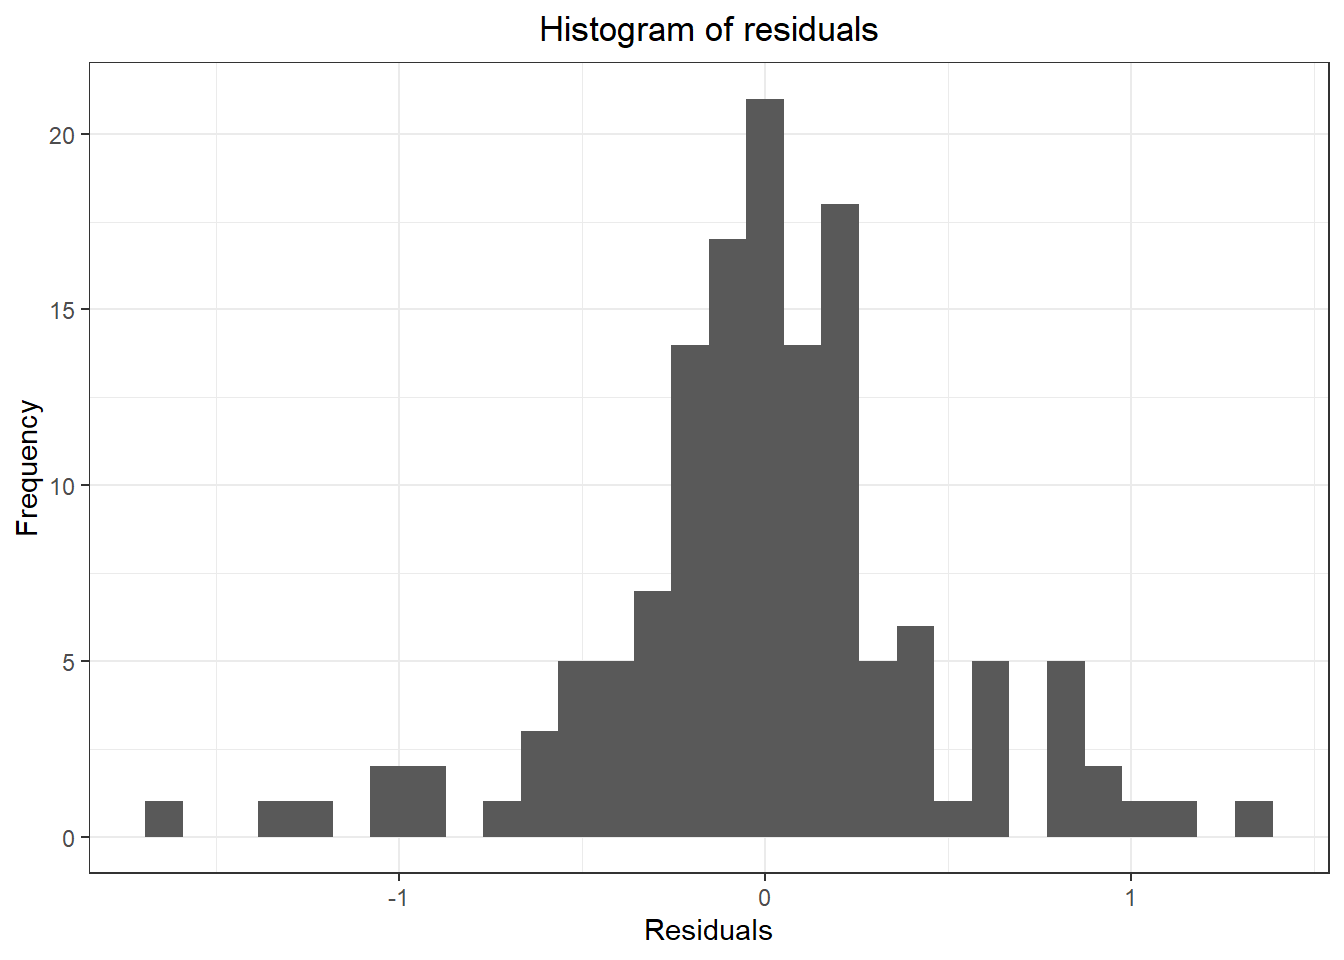
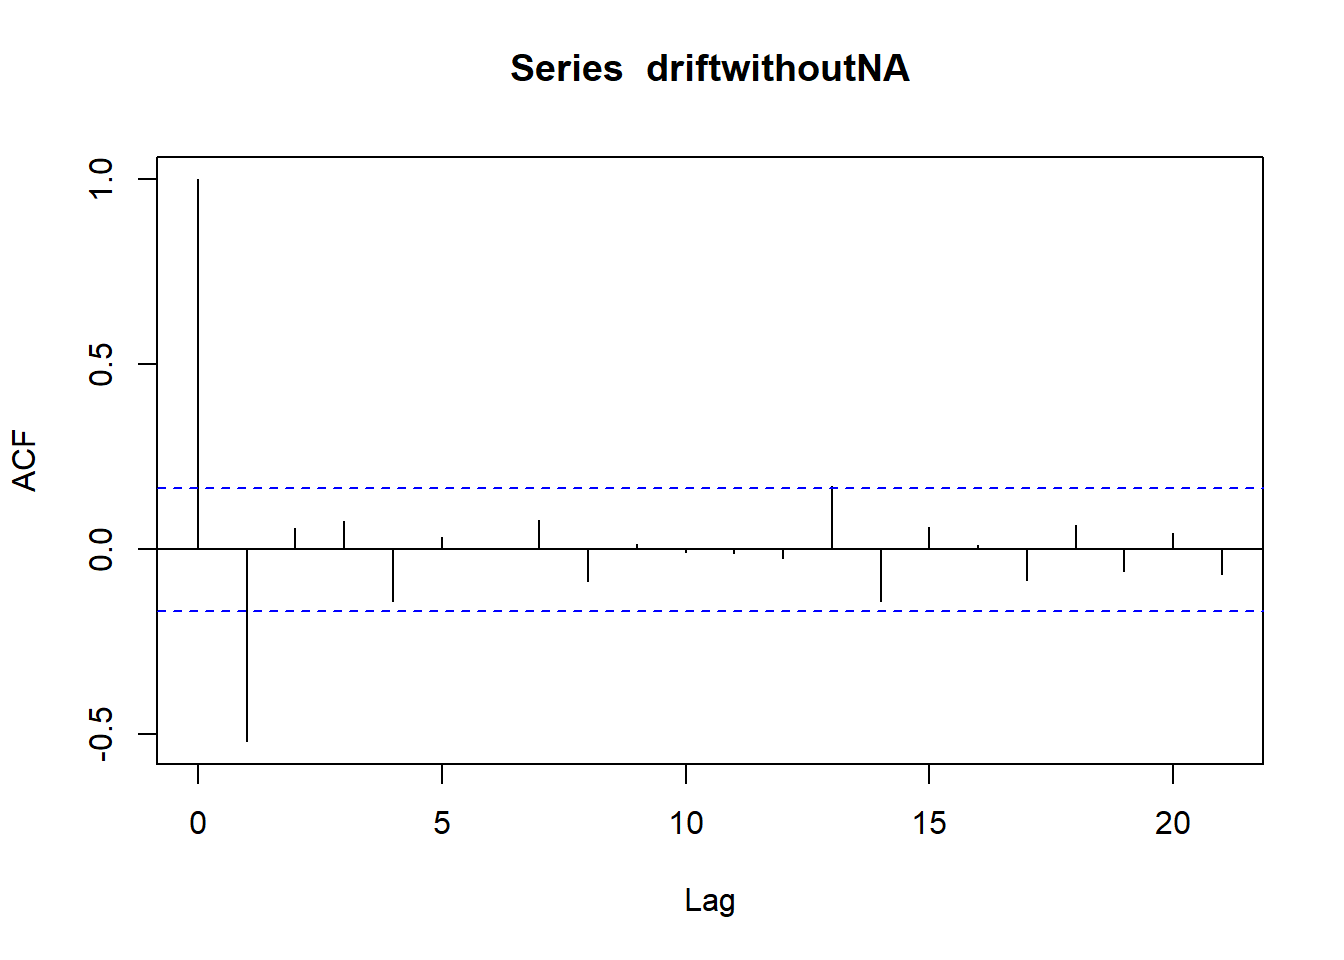
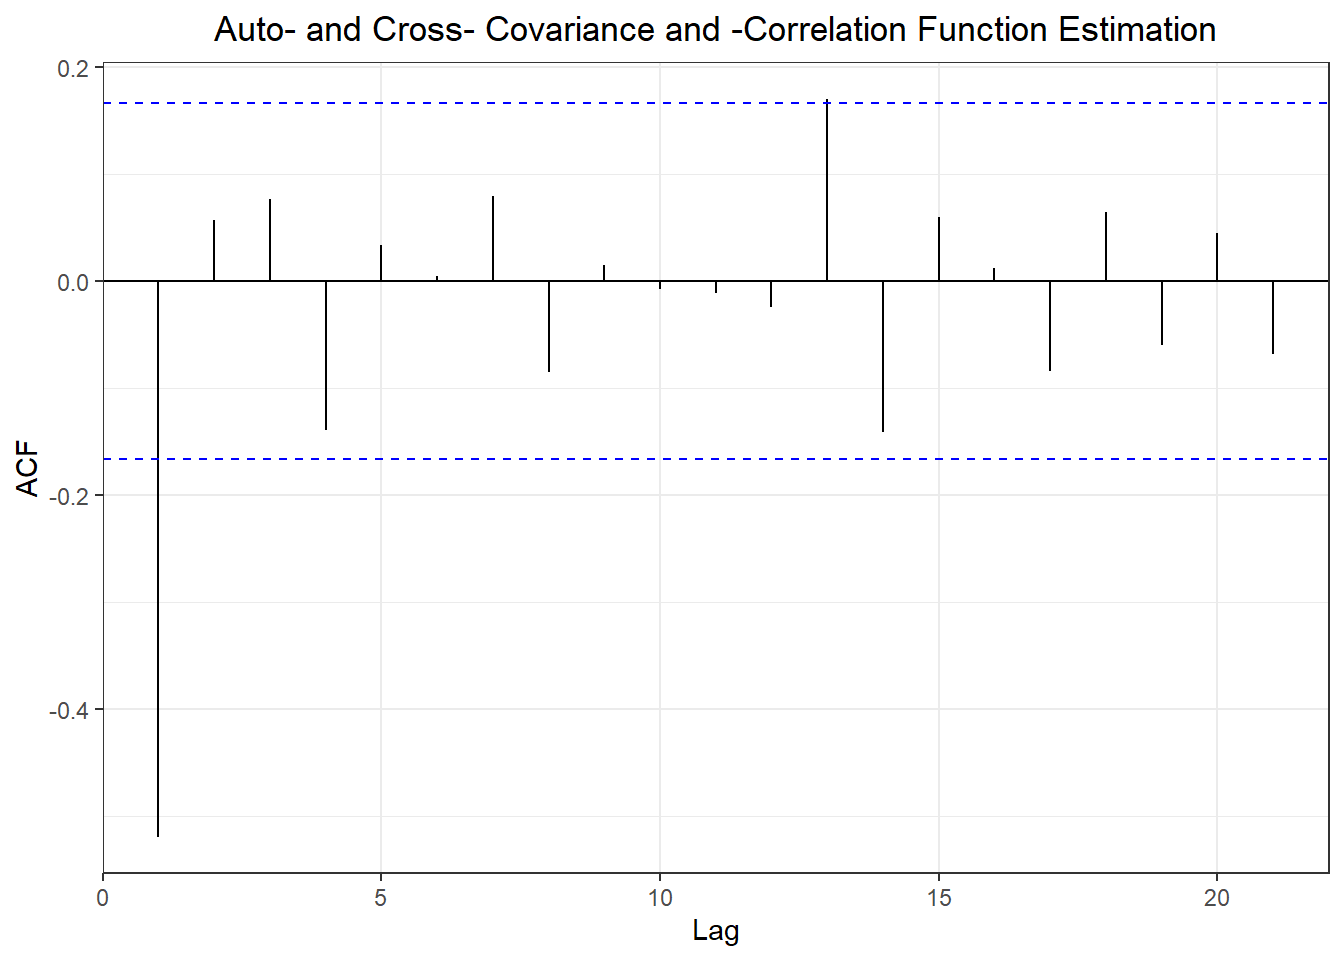
##                         ME      RMSE       MAE        MPE     MAPE
## Training set  1.846038e-16 0.8163346 0.7714004  -9.839234 31.23484
## Test set     -6.198835e-01 0.7307518 0.6204553 -36.737960 36.75971
##                  MASE       ACF1 Theil's U
## Training set 2.684607  0.8615304        NA
## Test set     2.159291 -0.2306541 0.9716032
##                       ME      RMSE       MAE       MPE     MAPE     MASE
## Training set -0.01824047 0.4071185 0.2873421 -1.870232 11.33626 1.000000
## Test set      0.05893104 0.3914276 0.3316489 -1.328849 17.76316 1.154196
##                    ACF1 Theil's U
## Training set -0.4450652        NA
## Test set     -0.2306541  0.577168
##                         ME      RMSE       MAE       MPE     MAPE     MASE
## Training set -9.802537e-17 0.4067096 0.2876207 -1.103181 11.31901 1.000970
## Test set      3.234179e-01 0.5206086 0.4411263 12.524858 21.27240 1.535196
##                    ACF1 Theil's U
## Training set -0.4450652        NA
## Test set     -0.1049056 0.7824451
##
##  Shapiro-Wilk normality test
##
## data:  naivem$residuals
## W = 0.961, p-value = 0.0005413
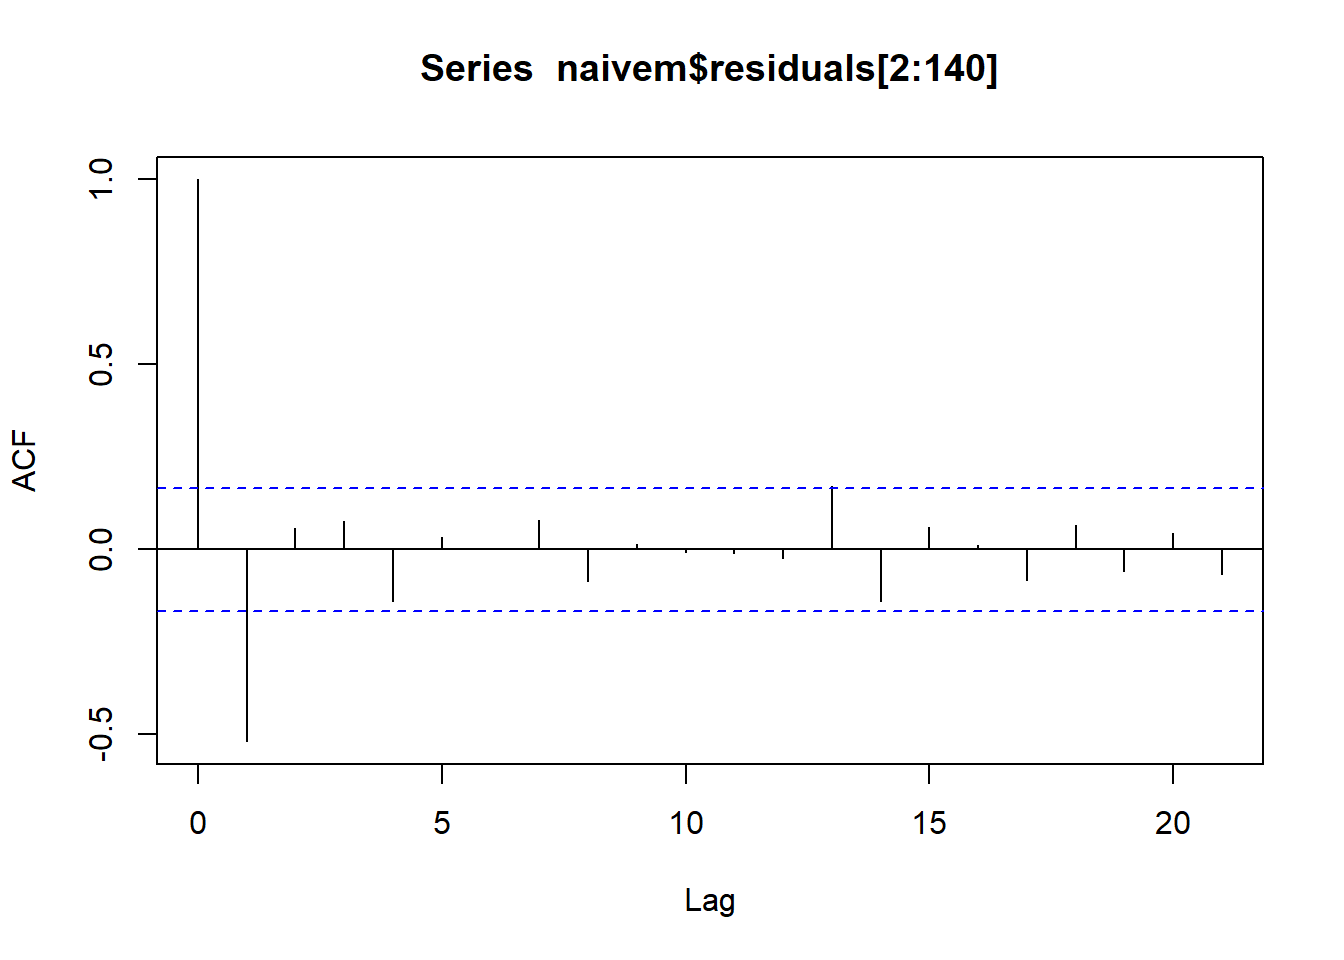
library(forecast)
meanm <- meanf(myts, h=10)
naivem <- naive(myts, h=10)
driftm <- rwf(myts, h=10, drift = T)

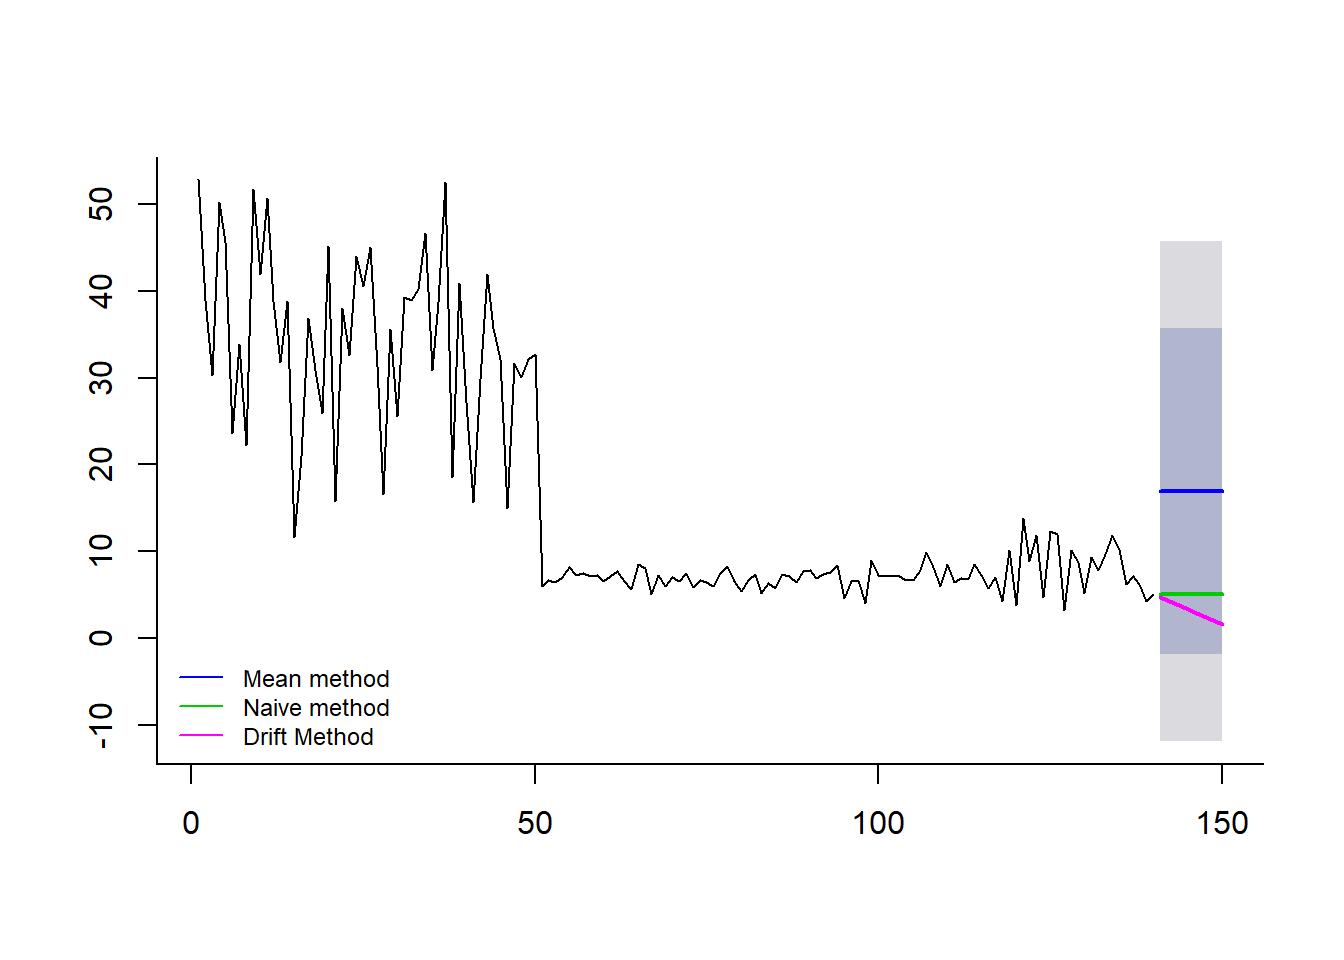
plot(meanm, main = "", bty = "l")
lines(naivem$mean, col=123, lwd = 2)
lines(driftm$mean, col=22, lwd = 2)
legend("bottomleft",lty=1,col=c(4,123,22), bty = "n", cex = 0.75,
       legend=c("Mean method","Naive method","Drift Method"))
## [1] 140
##                         ME     RMSE      MAE        MPE     MAPE     MASE
## Training set -6.408719e-16 15.31467 13.94736  -84.86989 120.4406 2.231924
## Test set     -1.125187e+01 11.61073 11.25187 -180.27778 180.2778 1.800578
##                    ACF1 Theil's U
## Training set  0.7632991        NA
## Test set     -0.1703445  2.002248
##                      ME      RMSE      MAE        MPE     MAPE      MASE
## Training set -0.4131666 10.024449 6.249032 -11.909758 33.36297 1.0000000
## Test set      0.9663084  3.022963 2.482045  -1.869095 33.51426 0.3971888
##                    ACF1 Theil's U
## Training set -0.4901263        NA
## Test set     -0.1703445 0.6497522
##                         ME      RMSE      MAE       MPE     MAPE     MASE
## Training set -1.624594e-17 10.015931 6.265918 -7.901602 33.29565 1.002702
## Test set      6.957224e+00  8.172915 6.974530 86.321252 86.72796 1.116098
##                    ACF1 Theil's U
## Training set -0.4901263        NA
## Test set      0.4327471   1.62159
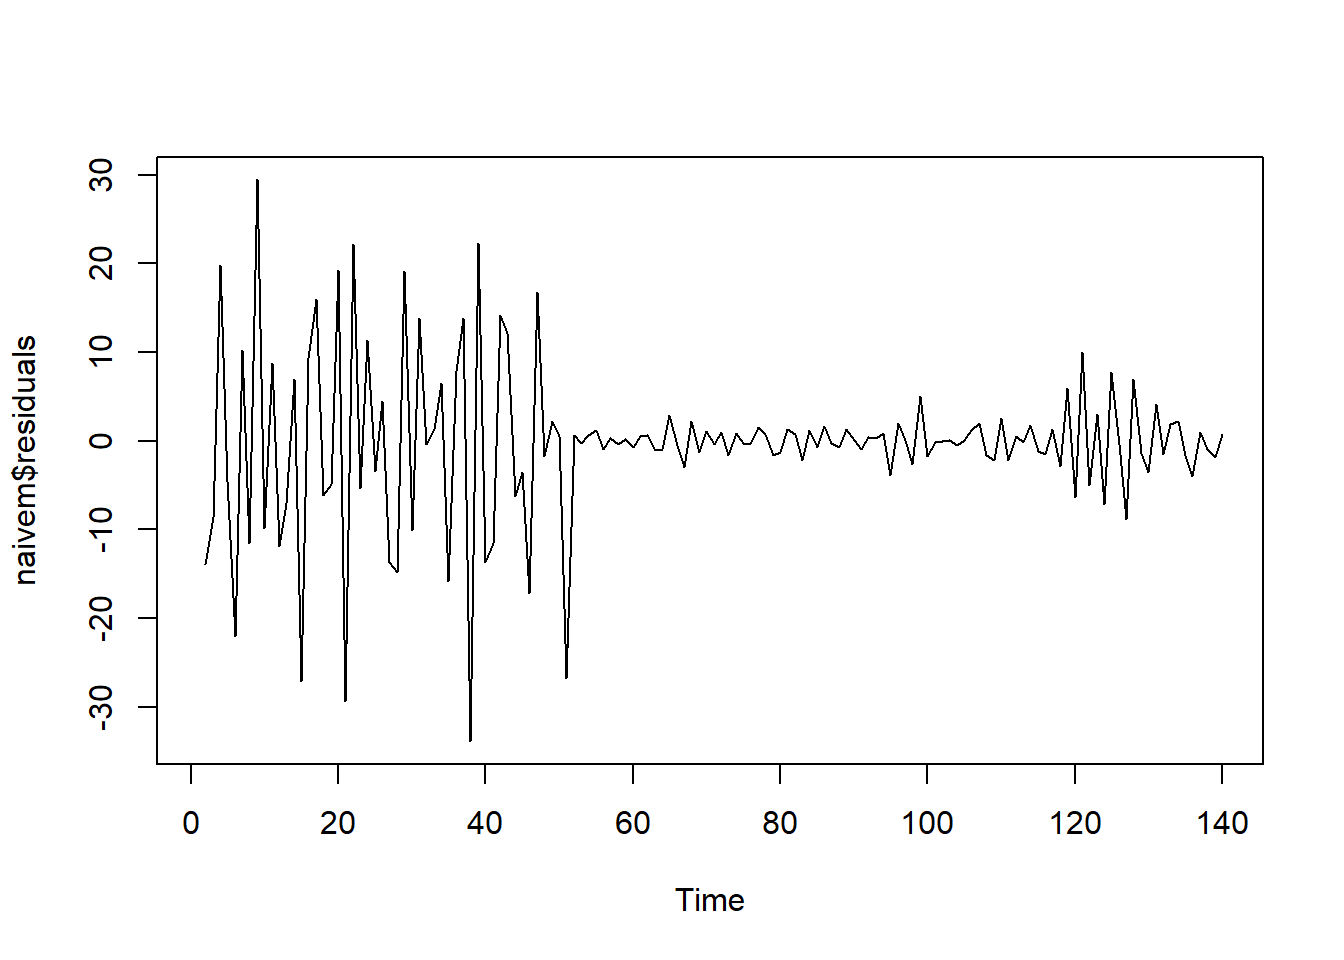
## [1] -0.3435748
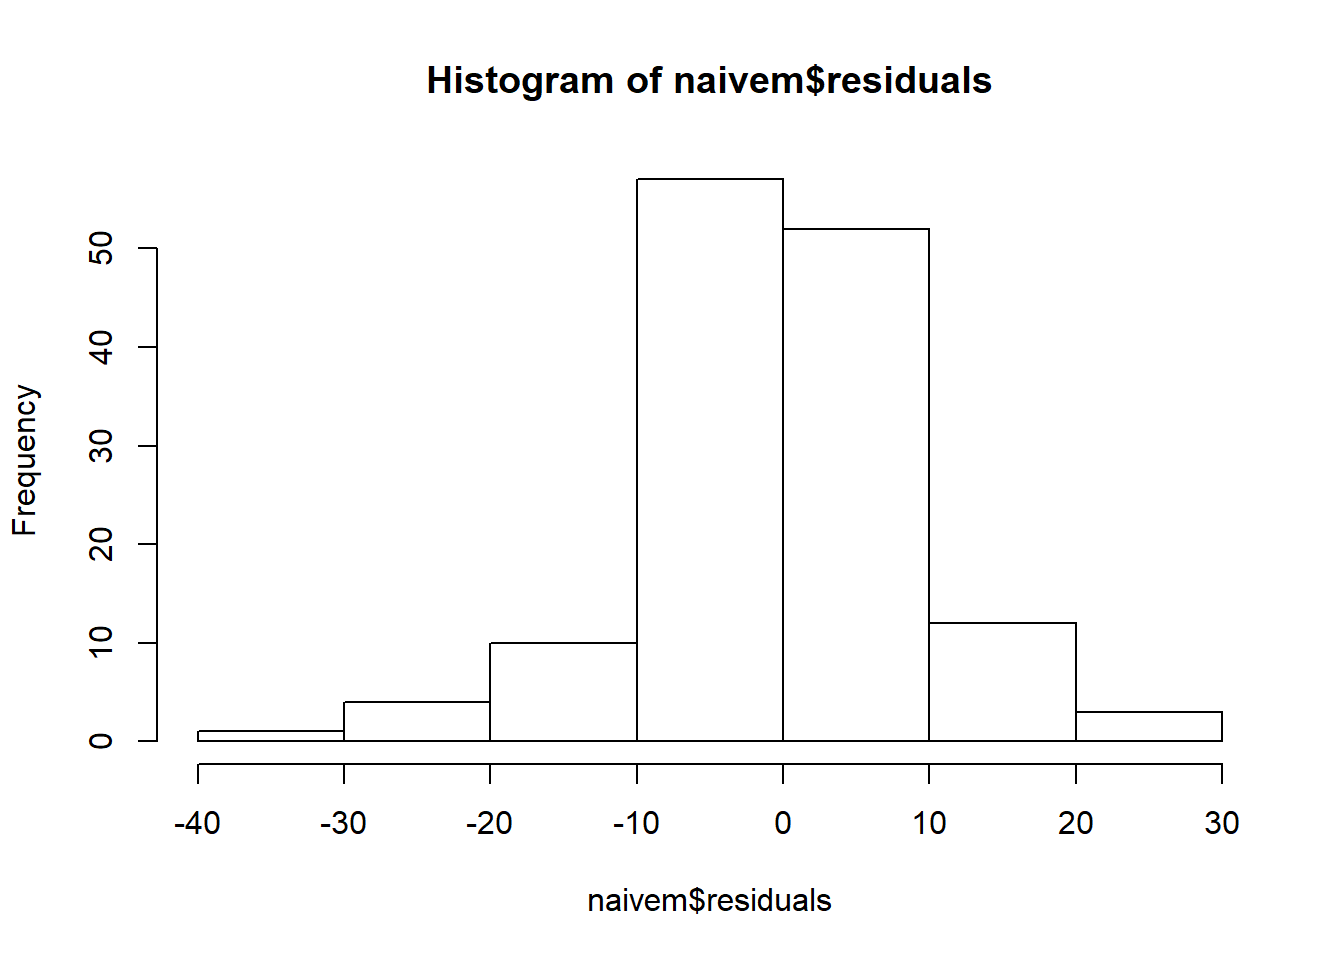
##
##  Shapiro-Wilk normality test
##
## data:  naivem$residuals
## W = 0.89587, p-value = 2.061e-08
