Chapter 9 Heatmaps
9.1 What are heatmaps?
Heatmaps are a type of maps that geographically visualize locations with patterns of higher than average occurrence of particular variables say crime, disease, service centres and et cetera.
9.2 Loading the heatmap plugin
Leaflet does not have a prepackaged tool for drawing heatmaps. Instead, we have to use an external plugin by the name of Leaflet.heat. The link to the zipfile is available here. Download and extract the folder to the same directory as your map.html.
Once you have extracted the zip file contents, open your map.html and add the following <script> tag within your <head> element.
<script src="Leaflet.heat-gh-pages\Leaflet.heat-gh-pages\dist\leaflet-heat.js"></script>Thereafter, we will have to think of a way of loading the GeoJson to a new JavaScript file called heatmap.js. This is where we shall write our heatmap code. You may think of using fetch or L.geoJson.ajax for this purpose but not so fast! The aforementioned methods failed in creating a heatmap. According to the documentation, heatmaps are created using L.heatLayer. Parsing fetch or L.geoJson.ajax into L.heatLayer to supposedly create a heatmap out of our GeoJSON points was not working. This is despite the two GeoJSON methods working well for various purposes in previous chapters. Thus, a new approach was needed.
After much internet searching, a code in Stack Overflow came to the rescue. However, it only works after inserting another Ajax plugin. Luckily no download is needed so insert this new <script> into your map.html.
<script src="https://ajax.googleapis.com/ajax/libs/jquery/2.1.4/jquery.min.js"></script>
9.3 Creating the Leaflet heatmap
Let’s call the usual suspects of adding a basemap.
var map = L.map('myMap').setView([0.3556, 37.5833], 6.5);
L.tileLayer('https://tile.openstreetmap.org/{z}/{x}/{y}.png', {
attribution: '© <a href="https://www.openstreetmap.org/copyright">OpenStreetMap</a> contributors'
}).addTo(map);
Thereafter, we add the following large code chunks.
var geoJsonUrl = "https://raw.githubusercontent.com/sammigachuhi/geojson_files/main/selected_hospitals.json"
var geojsonLayer = $.ajax({
url : geoJsonUrl,
dataType : 'json',
jsonpCallback: 'getJson',
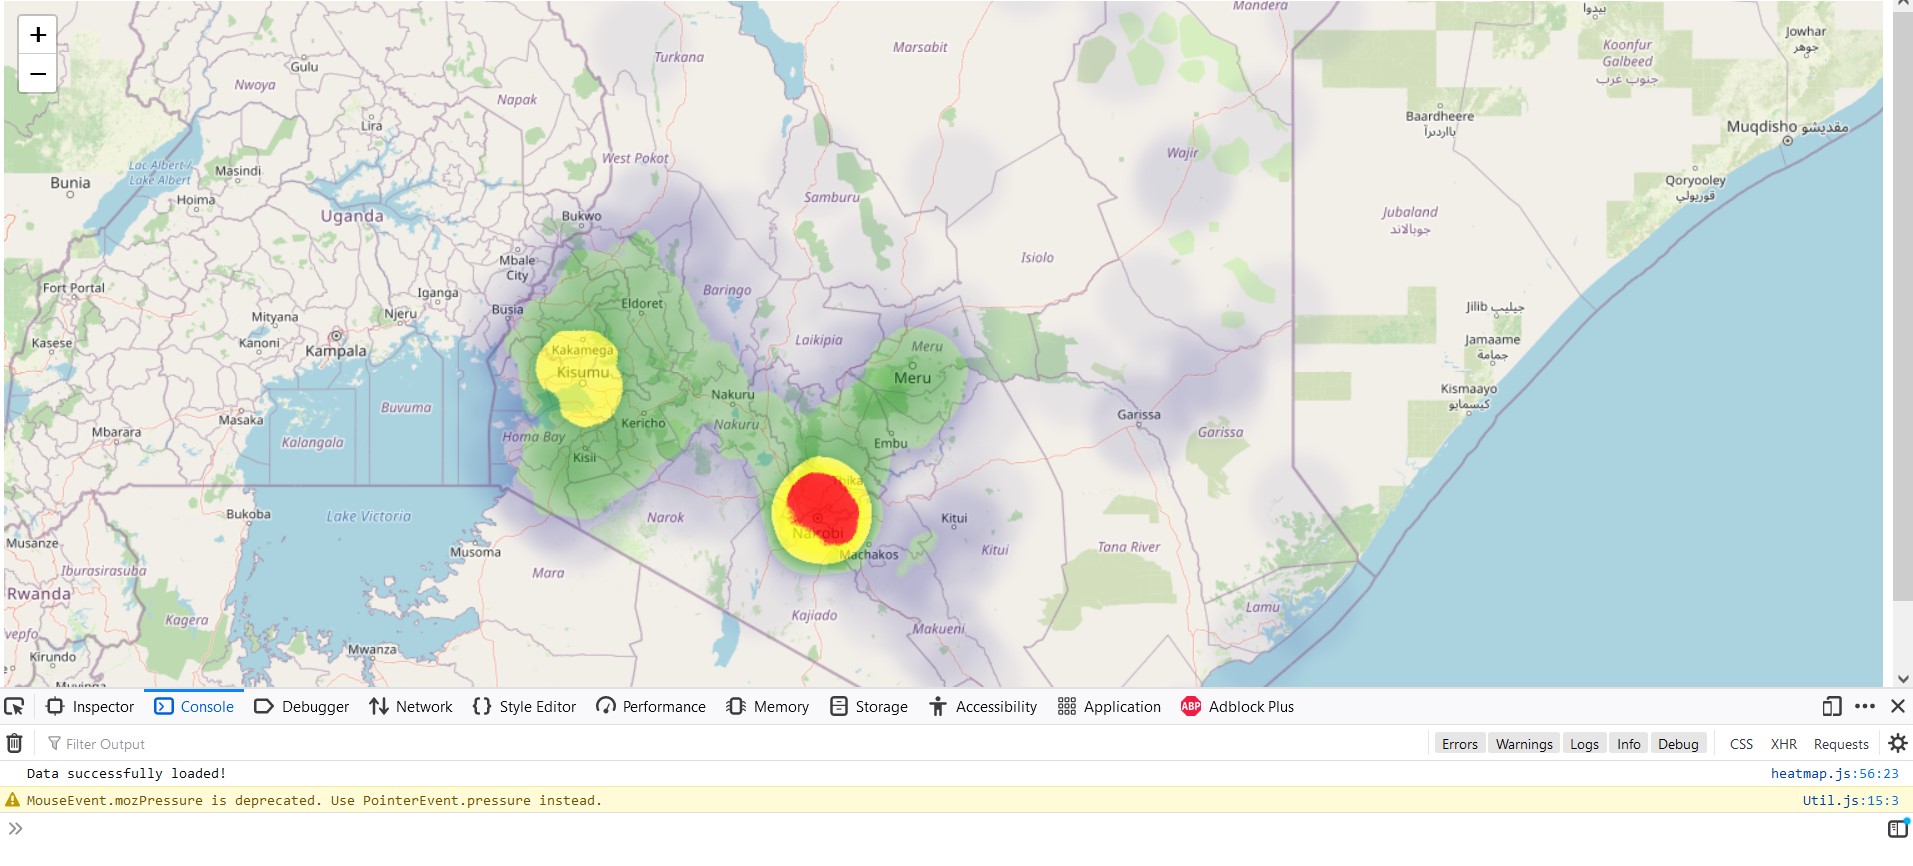
success : console.log("Data successfully loaded!"),
});
geoJson2heat = ((geojson) => {
return geojson.features.map(function(feature) {
return [parseFloat(feature.geometry.coordinates[1]),
parseFloat(feature.geometry.coordinates[0])];
});
});
$.when(geojsonLayer).done(function() {
// var kill = L.geoJSON(geojsonLayer.responseJSON);
var layer = geoJson2heat(geojsonLayer.responseJSON, 4);
var heatMap = L.heatLayer(layer, {
radius: 40,
blur: 10,
gradient: {
'0': 'Navy', '0.25': 'Navy',
'0.26': 'Green',
'0.5': 'Green',
'0.51': 'Yellow',
'0.75': 'Yellow',
'0.76': 'Red',
'1': 'Red'
},
maxZoom: 13});
map.addLayer(heatMap);
});
To give credit where it is due, the code chunks were taken from this Stack Overflow question and modified a bit. Let’s do everyone some justice by going through the preceding code bit by bit.
var geoJsonUrl = "https://raw.githubusercontent.com/sammigachuhi/geojson_files/main/selected_hospitals.json"

    var geojsonLayer = $.ajax({
    url : geoJsonUrl,
    dataType : 'json',
    jsonpCallback: 'getJson',
    success : console.log("Data successfully loaded!"),
    });
The var geoJsonUrl holds the link to our hospitals json file. The var geojsonLayer uses the Asynchronous Javascript And Xml (Ajax) method to load data from our Github server. If successful, we get the message “Data successfully loaded!” in our browser console.
geoJson2heat = ((geojson) => {
        return geojson.features.map(function(feature) {
        return [parseFloat(feature.geometry.coordinates[1]),
                parseFloat(feature.geometry.coordinates[0])];
        });
        });
The above code chunk is fairly easy to understand. The function passed to geoJson2heat uses the map method to iterate over every element, such as cities in the json file and retrieve the longitude and latitude coordinates. Notice the format has been inverted. Rather than [0]… [1] for Lat-Lon, we use [1]…[0].
The final is a jQuery function that will return the desired heatmap layer.
$.when(geojsonLayer).done(function() {
        // var kill = L.geoJSON(geojsonLayer.responseJSON);
        var layer = geoJson2heat(geojsonLayer.responseJSON, 4);
        var heatMap = L.heatLayer(layer, {
                radius: 40,
                blur: 10,
                gradient: {
                        '0': 'Navy', '0.25': 'Navy',
                        '0.26': 'Green',
                        '0.5': 'Green',
                        '0.51': 'Yellow',
                        '0.75': 'Yellow',
                        '0.76': 'Red',
                        '1': 'Red'
                      },
                maxZoom: 13});
        map.addLayer(heatMap);
        });
Honestly the last was a bit of a stretch since jQuery is hardly used in Leaflet or in normal JavaScript programming nowadays.
The full code files are available from here.
NB: It should be noted that all manner of efforts were employed to create a heatmap using L.heatLayer. The most promising seemed nesting the L.heatLayer within the simple L.geoJson.ajax class encountered numerous times so far. All attempts, including asking ChatGPT for a plausible solution, were unsuccessful.
## Summary
Heatmaps are one of the simplest forms of maps in geography. They use color and hue to visualize the concentration of phenomena across space. Here are the take home notes from this chapter.
Heatmaps are a type of maps that geographically visualize locations with patterns of higher than average occurrence of particular variables.
In order to draw heatmaps using Leaflet, we have to download the
Leaflet.heatplugin. Thereafter, the path to the plugin is parsed to thescripttag of your HTML file.Apart from using L.heatLayer, the other alternative of creating heatmaps from GeoJSON data is through a combination of Ajax and jQuery.