Chapter 3 Add ons
3.1 Not just a plain map
Like in the ultimate finale of a series where the episode begins with the statement- “Previously on…”, this chapter shall be a continuation of Chapter 2.
So we have a plain looking webmap like the one shown below.
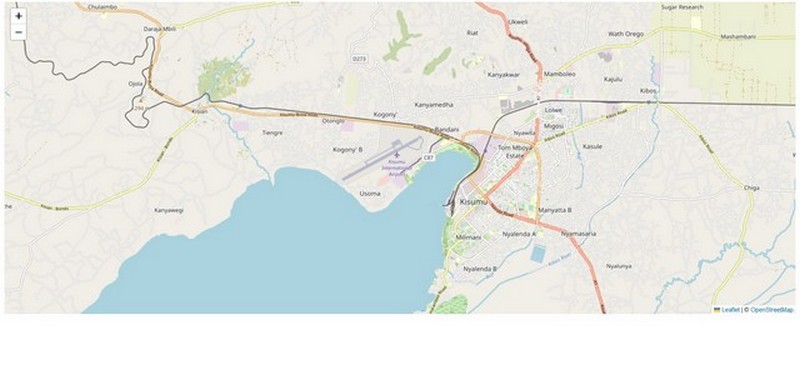
However, despite being a cool looking webmap, it offers no other additional information to the user. In order to pass some information, such as showing the location of Kisumu and inter alia, markers are one way of displaying such content. As a side note, there are other basemap layer servers compatible with Leaflet available here.
3.2 A marker
Many people could possibly hardly know where Kisumu, is, so lets indicate its location with a simple pin marker. To be more specific, let’s pinpoint Kisumu International Airport.
// Location of Kisumu International Airport
var marker = L.marker([-0.0819301, 34.7260167]).addTo(map);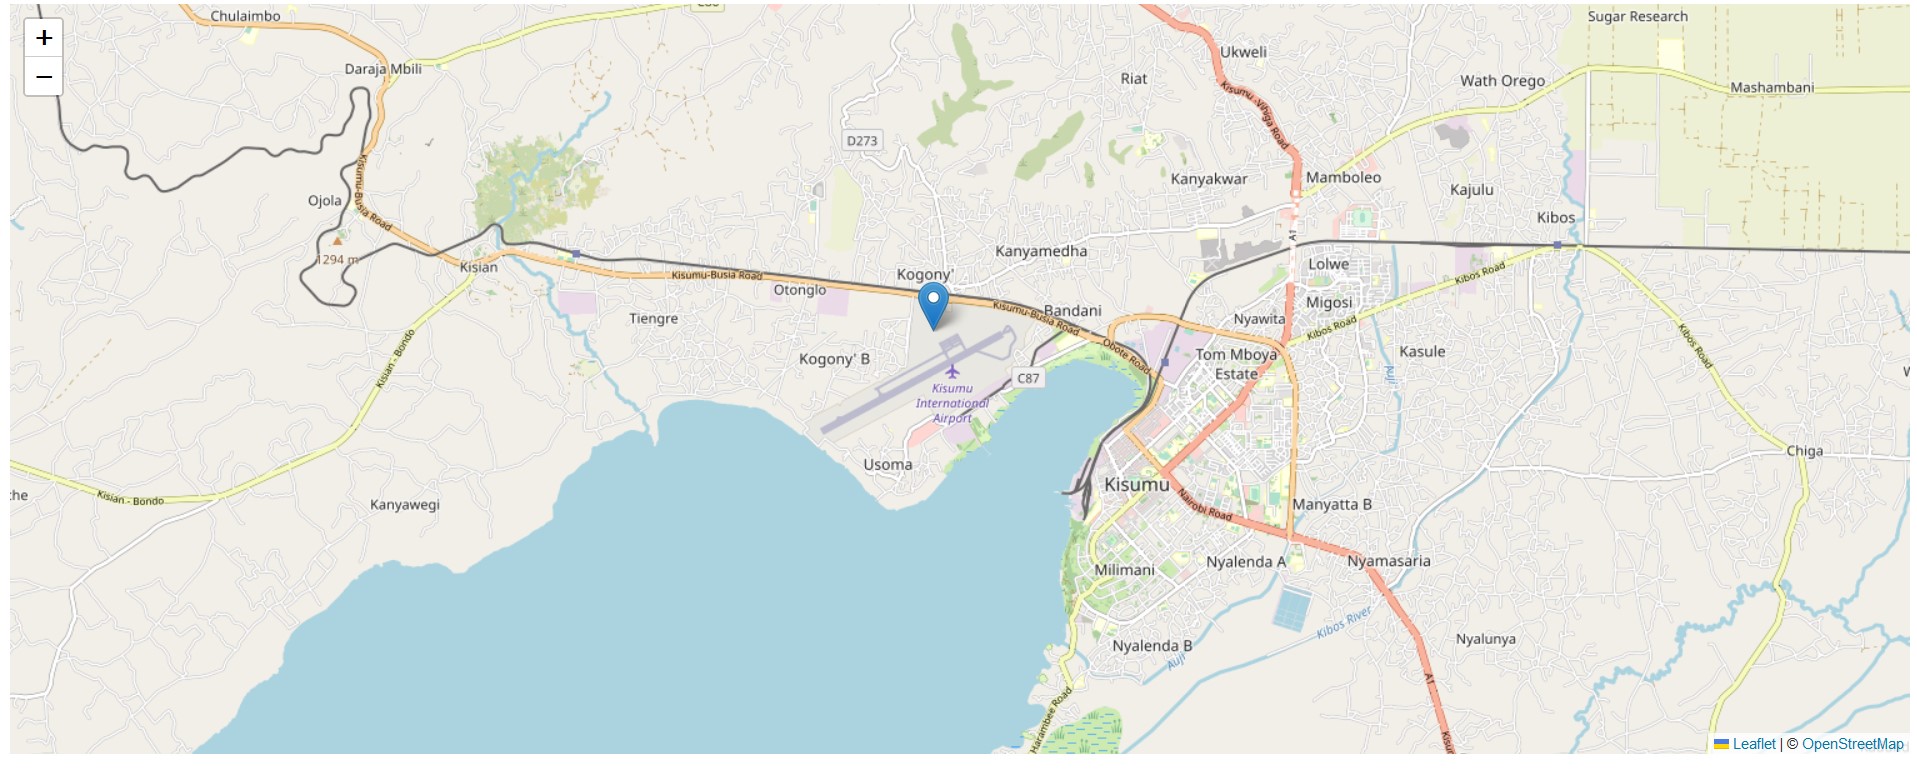
As a simple exercise, can you try creating a marker for your home location using the setView method you have learned about so far?
Alright, we have a marker. But what’s so special about it apart from it being a lone pin in the middle of somewhere? Let’s try to make this marker have some information, otherwise called attributes in GIS. Let’s say the attributes we want to add are the name of the airport and other auxillary data.
3.3 A marker with a popup
To create popups, Leaflet provides the bindPopup method. You just chain it to the variable, more like how you would add an extension to a browser to perform new functions but now in this case, these extra functions are added to the variable. In the below code, bindPopup is chained to the marker variable using a dot ..
// Create popup of Kisumu international Airport
marker.bindPopup("Kisumu International Airport.").openPopup();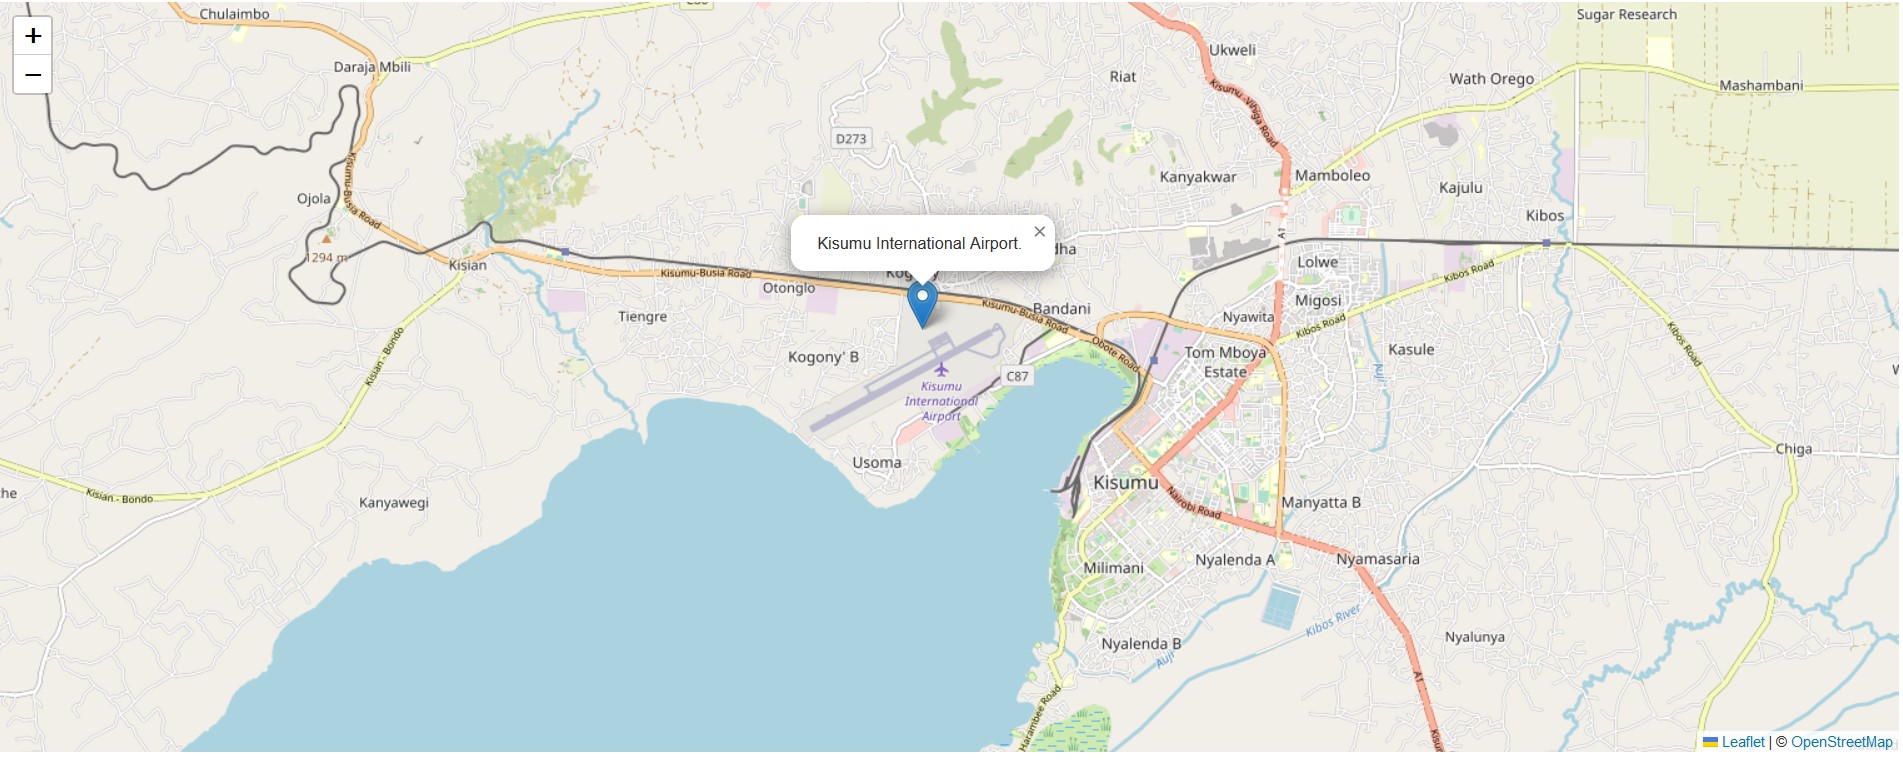
What has just happened is that bindPopup binds the popup content– “Kisumu International Airport” to the marker. In the below code, we have added another method, openPopup which open the popup at that specified latitude longitude. If you remove, or comment // out the popUp method, you will have to click the marker to see the popup content. Try it out.
Markers can also work with HTML elements, such as when you want to display additional metadata, say the owner of the place, size of land et cetera. In the below case, we have added the lat-lon coordinates of Kisumu airport location. It is highly advised not to include lengthy information in an HTML marker element.
// With html content
marker.bindPopup("<br>Name: Kisumu International Airport</br><br>Latitude: -0.0819301</br><br>Longitude: 34.7260167</br>").openPopup();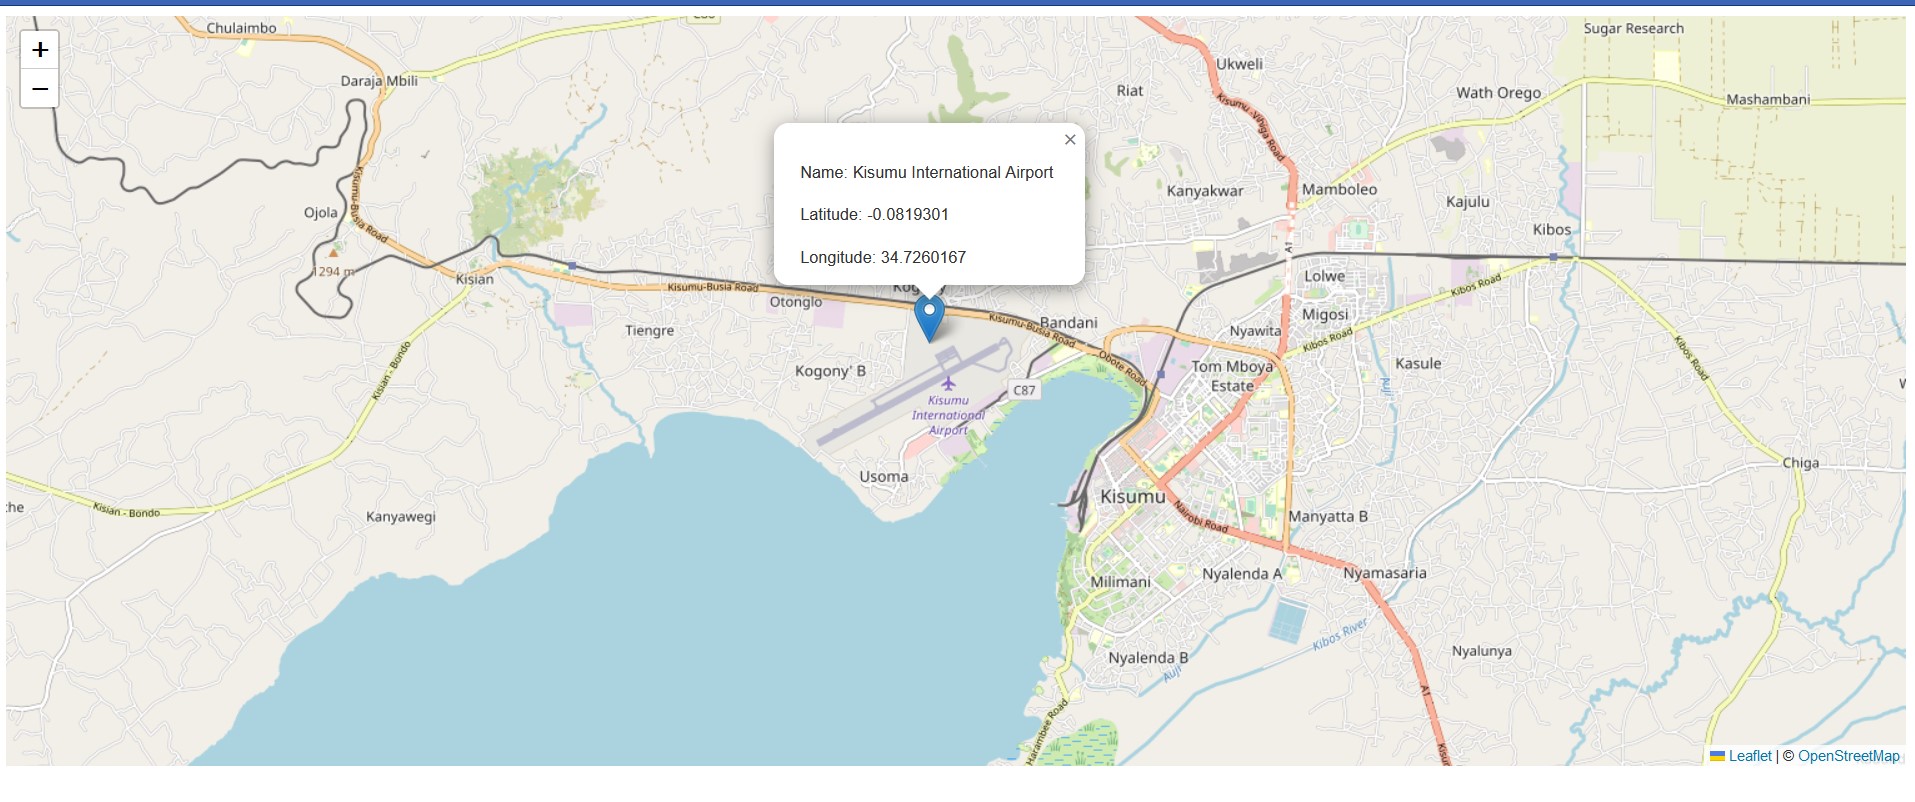
3.4 Different markers and popups
So far you have seen pin markers, but there are also other kinds of markers, such as circles and rectangles. Unlike the pin markers we have been experimenting with, these other markers require additional options, such as radius value for circle and lat-long coordinates for rectangles. Let’s have a go with each type.
Starting with a circle, let’s start by drawing a radius around the location of Kisumu Museum.
// Circle over Kisumu Museum
var circle = L.circle([-0.107637, 34.7435975]).setRadius(2000).addTo(map);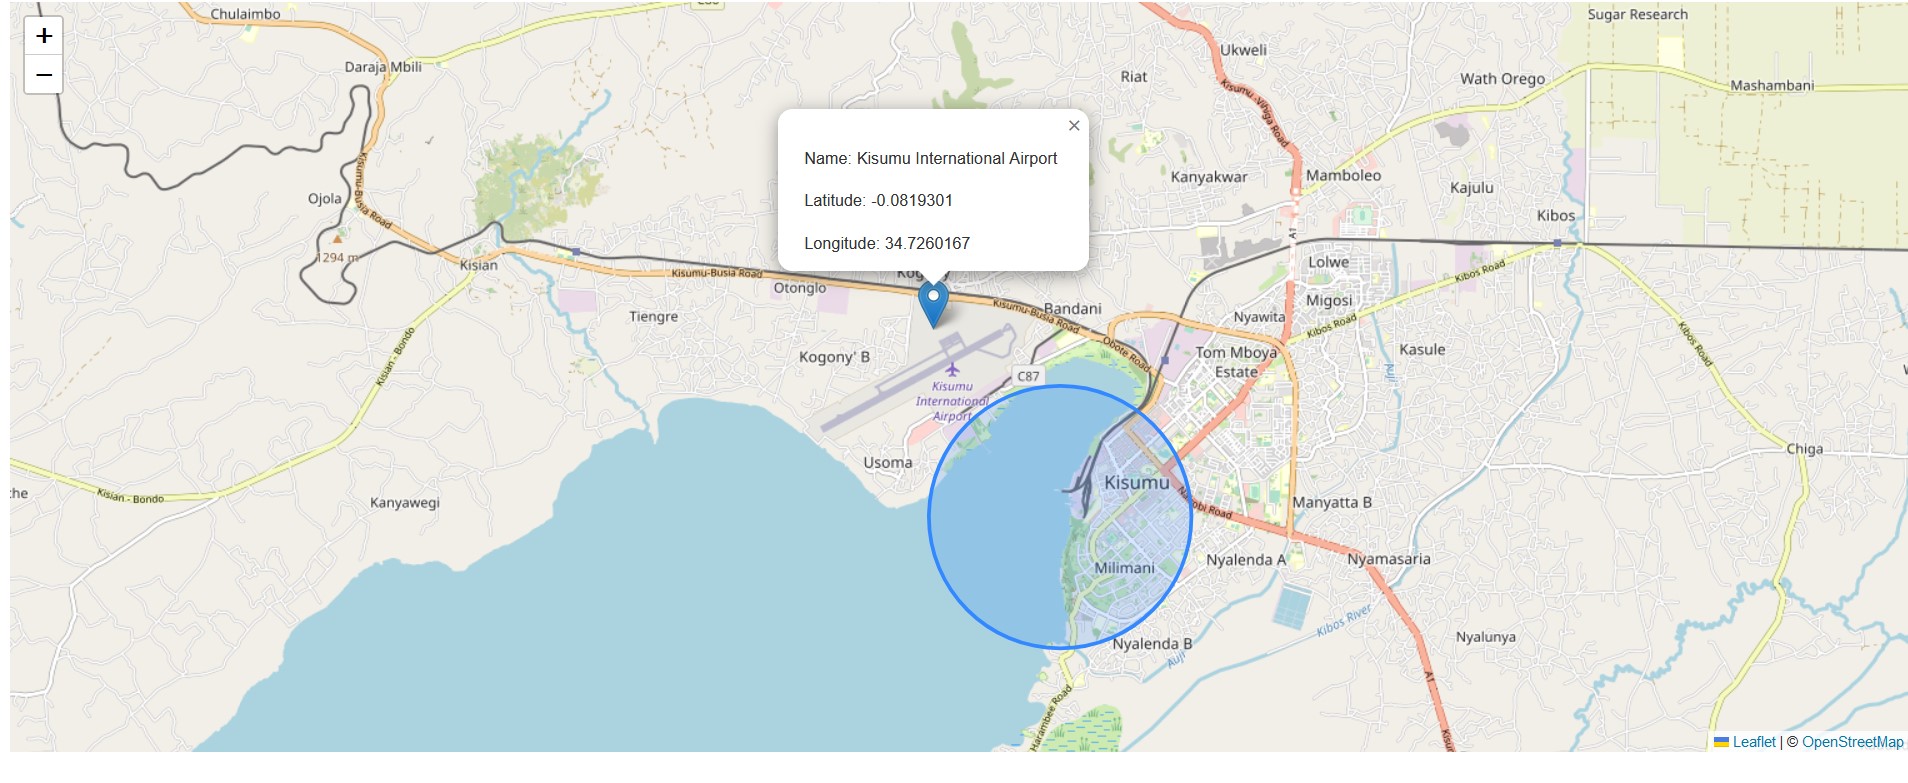
The below code will also create a slightly similar circle marker, the only difference is that in the preceding one we didn’t insert {options} and we set radius using the setRadius method. In the second one below, we have been very specific in what we want –our specifications going into the curly brackets {} before eventually adding the circle marker to our map. Brackets in JavaScript indicate you are dealing with a dictionary. A dictionary in JavaScript and even in Python is used to denote key-value pairs.
var circle = L.circle([-0.107637, 34.7435975], {
color: 'blue',
fillColor: 'blue',
fillOpacity: .5,
radius: 2000
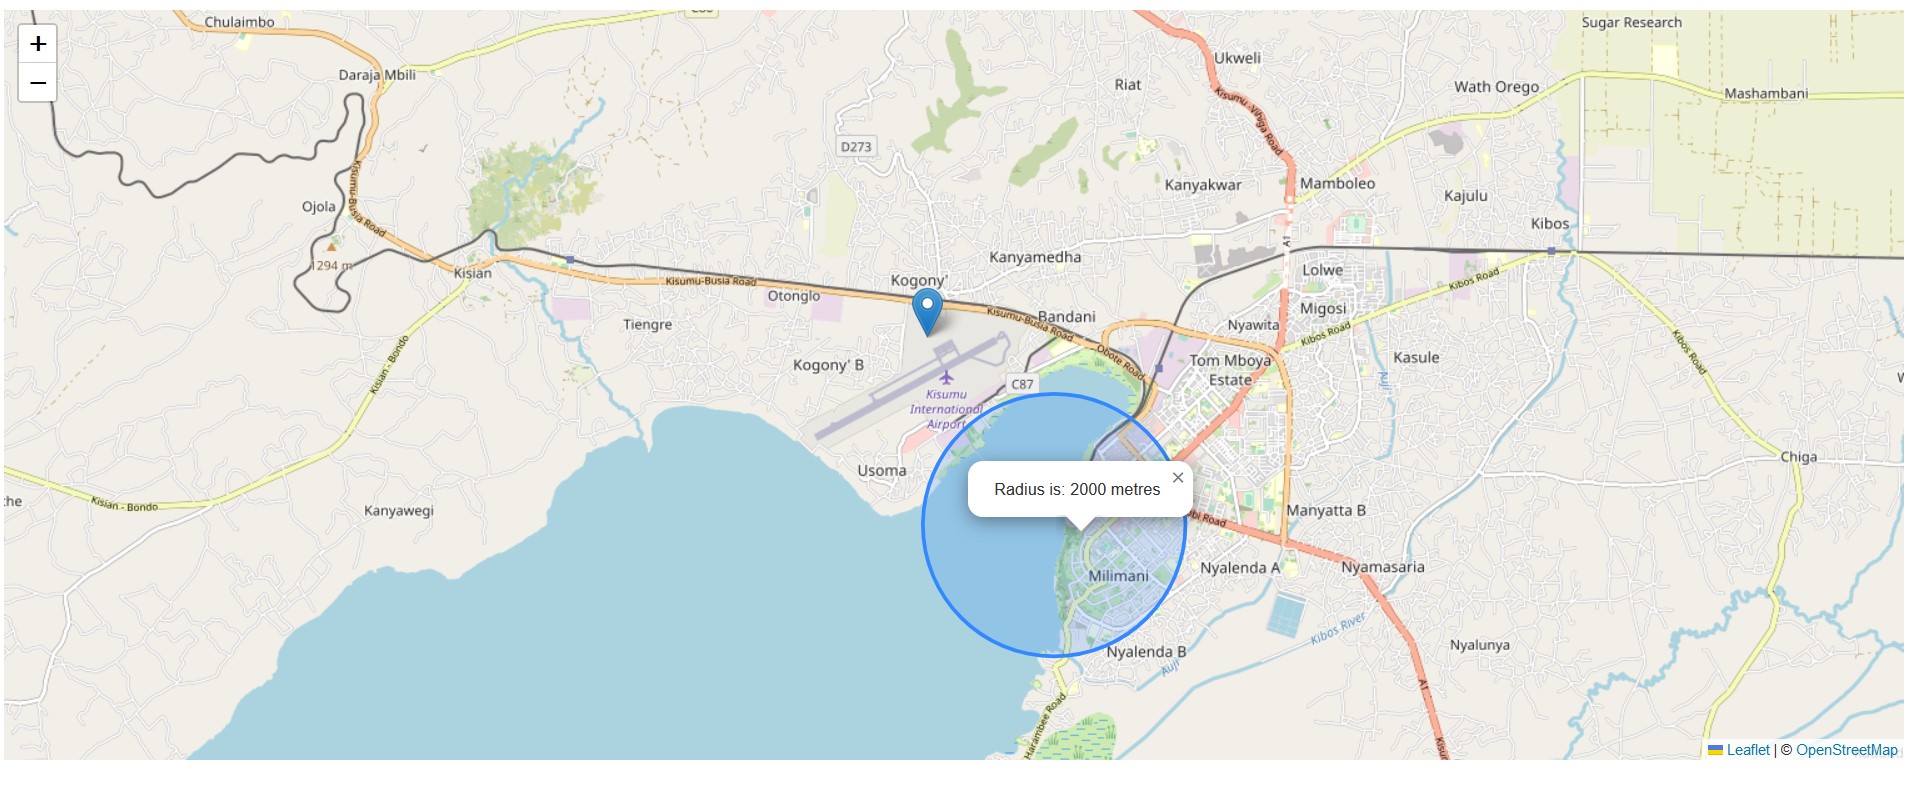
}).addTo(map);As we had mentioned earlier, other marker elements such as circles and rectangles can have popups attached to them. Ready for something cool? We will attach a popup into our circle. Not just any other ordinary hard coded popup but one which relies on other Leaflet JavaScript methods to generate an output. In our case, we want a pop up that shows the radius of our circle, without us typing it out into the code.
// Circle marker pop up for Kisumu Museum
var getRadius = circle.getRadius();
circle.bindPopup("Radius is: " + getRadius.toString() + " metres");
In our above code, getRadius gets the radius of our circle marker. bindPopup as has already been explained before binds the popup content to our circle marker. But there is a catch. The variable getRadius is used to print out the results, which is 2000 of course. However, bindPopup only understands strings so we convert our variable result to a string using toString(). We also added other strings to give the popup a wholesome result that is understandable to every Tom, Dick, Harry and Harriet.
Finally, let’s try with a rectangle. Actually, Leaflet allows us to create polygons. Let’s work with the polygon class to create a rectangle bounding a given location.
Copy the following coordinates.
// Draw rectangle around Kisumu Wildlife Impala Park
var impalaParkCoordinates = [
    [-0.1144753, 34.743418],
    [-0.115097, 34.745242],
    [-0.114238, 34.745071],
    [-0.114002, 34.746101],
    [-0.115054, 34.746787],
    [-0.115998, 34.745586],
    [-0.118444, 34.746208],
    [-0.121255, 34.744684]
]
Now using the L.polygon class and a few optional parameters, let’s showcase where the Kisumu Wildlife Impala Park is situated.
// Create a polygon using the above coordinates
var impalaParkPolygon = L.polygon(impalaParkCoordinates, {
color: 'brown',
fillOpacity: 0.4
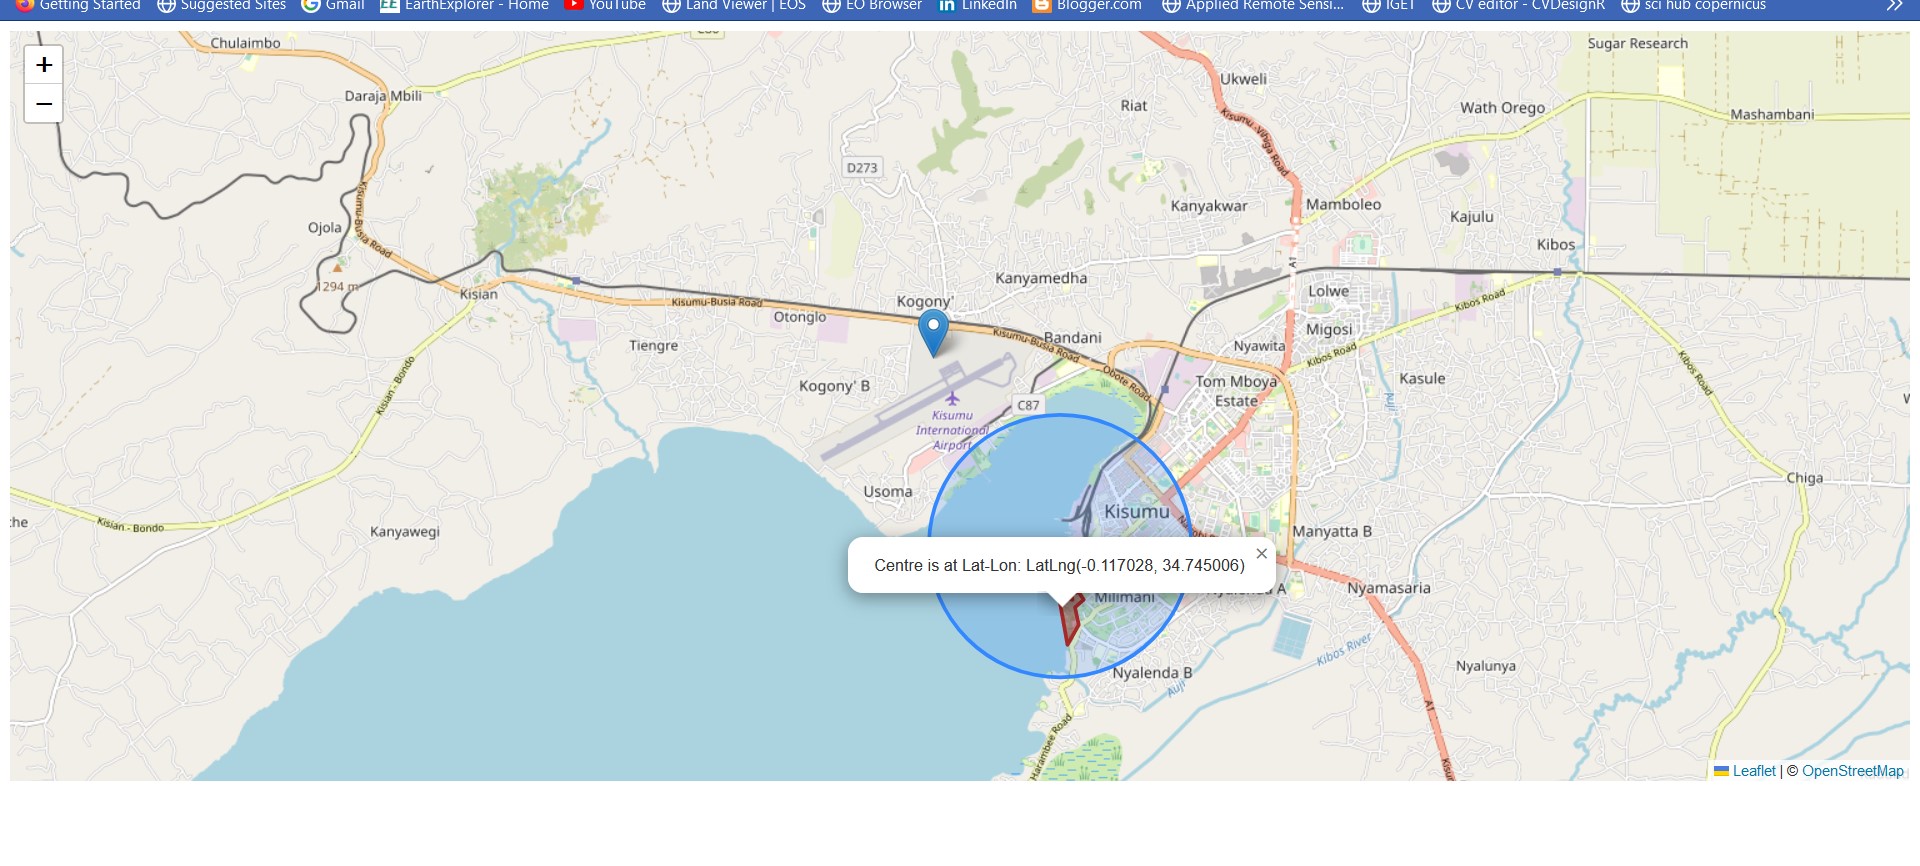
}).addTo(map);Just like we did for the circle marker, we will make our popup content rely on another variable, in this case getCenter which gets the centroid coordinates of our polygon. We were looking for something cooler such as getArea in Leaflet, one that automatically prints out the area of a polygon in a popup. Unfortunately, we were unable to find it.
// Add popup to the polygon of Kisumu Impala Park
var getCenter = impalaParkPolygon.getCenter();
impalaParkPolygon.bindPopup("Centre is at Lat-Lon: " + getCenter.toString()).openPopup();
If you find the circle marker too much of an obstraction to the rectangle marker, feel free to comment it out using //.
You can get the files used in this exercise here.
3.5 Summary
This chapter took you further in enriching the content that can be displayed in a webmap. You have seen that a webmap can offer far more useful information than just mere markers and symbols on a web canvas. Popups are one way of displaying information, and they too can be customized further. Through the practicals in this chapter, you have learnt the following:
To create popups in Leaflet, we use the
bindPopupmethod.openPopupautomatically opens the popups once the Leaflet map is loaded. They only disappear once you close them.Markers can also work with HTML elements.
Apart from location pins, markers can also be circles and rectangles.
There exist methods in Leaflet that can automatically parse out information in popups without requiring any hardcoding from the programmer. For example, we used
getRadiusto display the circle radius in the popup without necessarily typing it out in thebindPopupmethod.You comment out JavaScript code with
//!