Chapter 4 Embedding leaflet map to an external website
4.1 A website with a sense of direction
Now, we have succeeded in making a stand alone leaflet map. However, we want to do something that will quickly upscale you from a novice to a pro. That is, embeding a Leaflet map into a website.
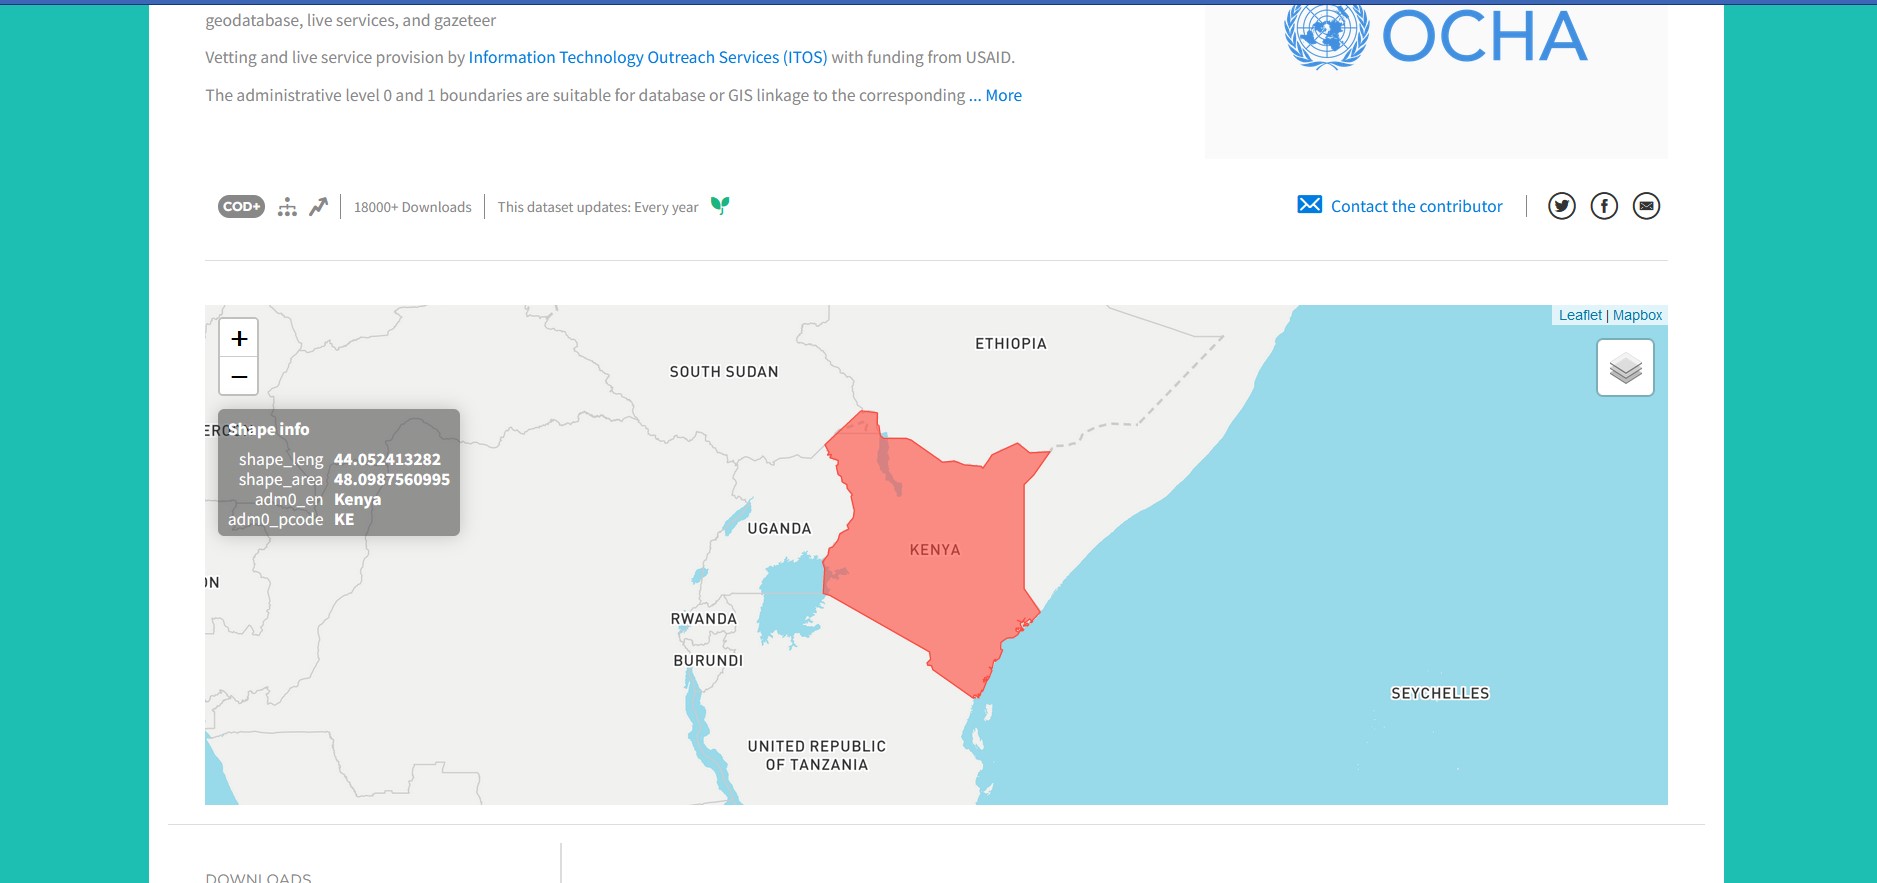
An example of what we want is shown below, which is a snapshot from the HDX website.

For this exercise, we shall embed a leaflet map to a simple HTML webpage. This webpage doesn’t look grand, but it serves the purpose of our exercise. Let’s get on to it. Here are the files.
4.2 The HTML webpage
Create a HTML page with the following code.
<!DOCTYPE html>
<html lang="en">
    <head>
        <title>Pro-GMO Alliance</title>
        <meta charset="utf-8">
        <link rel="stylesheet" href="example-styles.css">
        <link rel="stylesheet" href="https://unpkg.com/leaflet@1.9.3/dist/leaflet.css"
        integrity="sha256-kLaT2GOSpHechhsozzB+flnD+zUyjE2LlfWPgU04xyI="
        crossorigin=""/>
        <script src="https://unpkg.com/leaflet@1.9.3/dist/leaflet.js"
        integrity="sha256-WBkoXOwTeyKclOHuWtc+i2uENFpDZ9YPdf5Hf+D7ewM="
        crossorigin=""></script>
    </head>
    <body>
    <div id="div-for-article">
        <article id="introduction">
            <h2>Introduction</h2>
            <q>Sed ut perspiciatis unde omnis iste natus error sit voluptatem accusantium
            doloremque laudantium, totam rem aperiam, eaque ipsa quae ab illo inventore veritatis et
            quasi architecto beatae vitae dicta sunt explicabo. Nemo enim ipsam voluptatem quia voluptas
            sit aspernatur aut odit aut fugit, sed quia consequuntur magni dolores eos qui ratione
            voluptatem sequi nesciunt. Neque porro quisquam est, qui dolorem ipsum quia dolor sit amet,
            consectetur, adipisci velit, sed quia non numquam eius modi tempora incidunt ut labore et
            dolore magnam aliquam quaerat voluptatem. Ut enim ad minima veniam, quis nostrum exercitationem
            ullam corporis suscipit laboriosam, nisi ut aliquid ex ea commodi consequatur? Quis autem
            vel eum iure reprehenderit qui in ea voluptate velit esse quam nihil molestiae consequatur,
            vel illum qui dolorem eum fugiat quo voluptas nulla pariatur?</q>
        </article>
    </div>
    <div id="div-for-section">
        <section id="Products">
            <div class="row">
                <h2>Our Products</h2>
                <div class="column">
                  <img src="https://images.unsplash.com/photo-1632125941710-35a9d2fcc7ce?ixlib=rb-4.0.3&ixid=MnwxMjA3fDB8MHxwaG90by1wYWdlfHx8fGVufDB8fHx8&auto=format&fit=crop&w=1170&q=80" alt="Maize" style="width:100%">
                </div>
                <div class="column">
                    <img src="https://images.unsplash.com/photo-1595615636850-3292eb0a95b0?ixlib=rb-4.0.3&ixid=MnwxMjA3fDB8MHxwaG90by1wYWdlfHx8fGVufDB8fHx8&auto=format&fit=crop&w=1170&q=80" alt="Sunflower" style="width:100%">
                  </div>
                <div class="column">
                  <img src="https://images.unsplash.com/photo-1600333859399-228aa03f7dba?ixlib=rb-4.0.3&ixid=MnwxMjA3fDB8MHxwaG90by1wYWdlfHx8fGVufDB8fHx8&auto=format&fit=crop&w=1170&q=80" alt="Potato" style="width:100%">
                </div>
                <div class="column">
                  <img src="https://images.unsplash.com/photo-1630145398476-853543b02843?ixlib=rb-4.0.3&ixid=MnwxMjA3fDB8MHxwaG90by1wYWdlfHx8fGVufDB8fHx8&auto=format&fit=crop&w=1167&q=80" alt="Cotton" style="width:100%">
                </div>
              </div>
        </section>
    </div>
    <div>
        <br>
        <h2>Our Branches</h2>
        <br>
    </div>
      <div class="container">
        <div id="map">
          <script src="example-main.js"></script>
        </div>
        <div class="text">
          <h1>Address</h1>
          <p>
            P.O. Box 55044, Nakuru
        </p>
        </div>
      </div>
    </body>
</html>
Since this is a geospatial book, we shall not go through every line of the HTML script above. It just a webpage containing some text, some pictures and a webmap. The webmap is the centre of our interest in this chapter. We at least do know how to create a Leaflet map, but how do we fit it inside a webpage?
Before we head there, let’s insert the CSS file, which looks like this.
/* Three image containers (use 25% for four, and 50% for two, etc) */
.column {
    float: left;
    width: 33.33%;
    padding: 5px;
  }

  /* Clear floats after image containers */
  .row::after {
    content: "";
    clear: both;
    display: table;
  }


/* Styling the map */
  .container {
    display: flex;
    align-items: center;
    justify-content: center
  }

#map {
    height: 300px;
    width: 90%
}

.text {
    font-size: 15px;
    padding-left: 20px;
}
4.3 A simple for loop for webmap display
Back to the Leaflet map of our dummy Pro-GMO Alliance webpage. How did we put the Leaflet in there? In just under a minute, parsing the JavaScript Leaflet file to the <script> tag and referencing it using the src attribute makes our webmap appear at its placed position in the HTML file. The JavaScript file we parsed to our HTML file is called example-main.js. It contains the following code:
var map = L.map('map').setView([-0.302765, 36.146147], 12);
L.tileLayer('https://tile.openstreetmap.org/{z}/{x}/{y}.png', {
maxZoom: 19,
attribution: '© <a href="http://www.openstreetmap.org/copyright">OpenStreetMap</a>'
}).addTo(map);
var branches = [
["Potatoes",-0.328858, 36.008474],
["Maize",-0.302765, 36.146147],
["Sunflower",-0.224832, 36.159880],
["Cotton", -0.214189, 36.135847]
];
for (var i = 0; i < branches.length; i++) {
marker = new L.marker([branches[i][1], branches[i][2]])
.bindPopup(branches[i][0])
.addTo(map);
}
For the first time in this book, we are introducing the for loop. As is the case in other languages such as R and Python, JavaScript also uses the for loop to iterate over items. In our case, and remembering that indexing in arrays begins from 0, the marker popups will read the latitudes and longitudes which are at index 1 and 2 respectively. The lat-lon are indicated by ([branches[i][1], branches[i][2]]). The popup strings, which appear as the first elements in the branches array, are at index 0. The popup strings are indicated by branches[i][0]. At the end of the chain the markers are added to the map with .addTo.
Alright. How about the keyword new?
The new keyword is a constructor. That is, it creates an empty object. Many instances of the variable marker can be created from the instance of new object. For more information on the new keyword constructor, see this website. Be rest assured that the new keyword isn’t mandatory to make the webmap to work in our case but its helpful to learn another JavaScript trick to add to your hat.
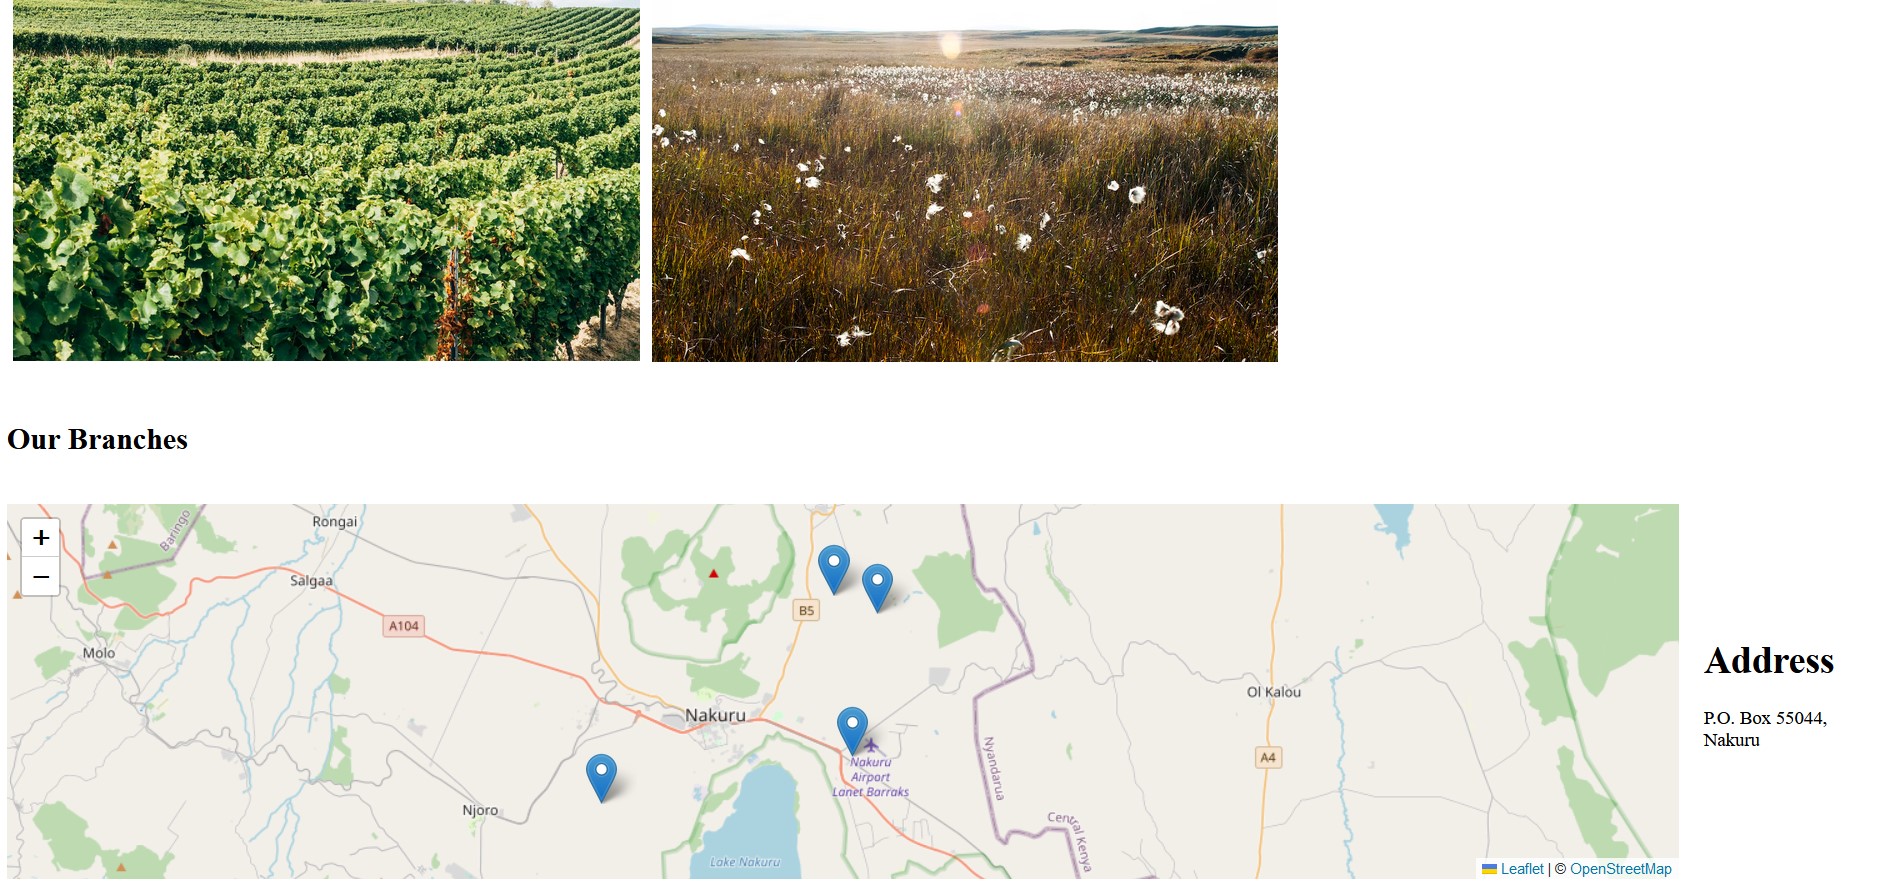
Below is a snapshot of how the dummy Pro-GMO website looks like with our newly embedded webmap.

“How are we able to align the webmap to the left and also make other text stand aside to it?” This is all thanks to the CSS property display: flex. display is a CSS property that deals with how HTML elements are displayed.
The display property aligns a HTML element to fill or shrink according to the space available within its assigned portion in the webpage. On the other hand, the CSS property padding-left just creates space all around the element, thus creating a neat space between the Leaflet map and the address text. Removing this will just make the address text and the Leaflet map touch each other edge to edge. The inspiration to use all these CSS properties and values in placing HTML elements side-by-side emanated from this example.
Having done the above, you can consider you are as good a Leaflet mapper to undertake any task! Later on, in Chapter 13, we shall see how to insert a Leaflet map in a more sophisticated website. This was just a gentle introduction.
4.4 Summary
This chapter has introduced you on how you can use CSS to customize the appearance and positioning of your webmap. You have also encountered the use of for loop in JavaScript code to retrieve geospatial information, particularly from arrays. Here are some of the take aways from this chapter.
Leaflet maps can be embedded inside a website as demonstrated in the dummy Pro-GMO webpage.
One can use
forloops to iterate over elements from an array and retrieve geospatial information. In this chapter, theforloop was used to retrieve both latitude-longitude coordinates and text from thebranchesarray variable.We can use CSS elements, such as
displayandpadding-leftto position and define how a webmap shall be displayed on our webpage.