12.2 Plot Margins
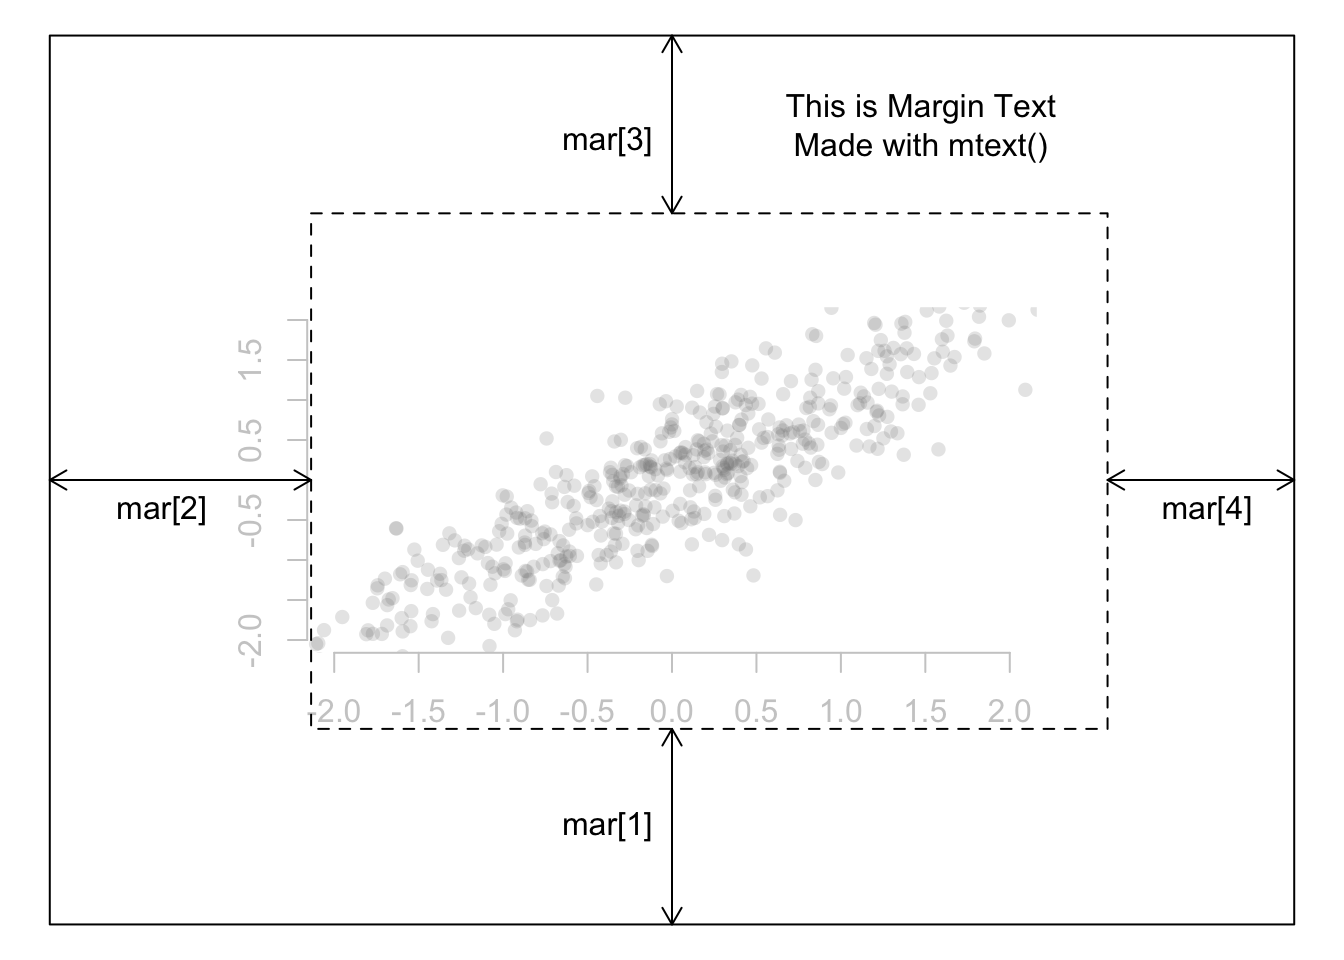
Figure 12.2: Margins of a plot.
All plots in R have margins surrounding them that separate the main plotting space from the area where the axes, labels and additional text lie. To visualize how R creates plot margins, look at margin Figure 12.2.
You can adjust the size of the margins by specifying a margin parameter using the syntax par(mar = c(bottom, left, top, right)), where the arguments bottom, left … are the size of the margins. The default value for mar is c(5.1, 4.1, 4.1, 2.1). To change the size of the margins of a plot you must do so with par(mar) before you actually create the plot.
Let’s see how this works by creating two plots with different margins:In the plot on the left, I’ll set the margins to 3 on all sides. In the plot on the right, I’ll set the margins to 6 on all sides.
# First Plot with small margins
par(mar = c(2, 2, 2, 2)) # Set the margin on all sides to 2
plot(1:10)
mtext("Small Margins", side = 3, line = 1, cex = 1.2)
mtext("par(mar = c(2, 2, 2, 2))", side = 3)

# Second Plot with large margins
par(mar = c(5, 5, 5, 5)) # Set the margin on all sides to 6
plot(1:10)
mtext("Large Margins", side = 3, line = 1, cex = 1.2)
mtext("par(mar = c(5, 5, 5, 5))", side = 3)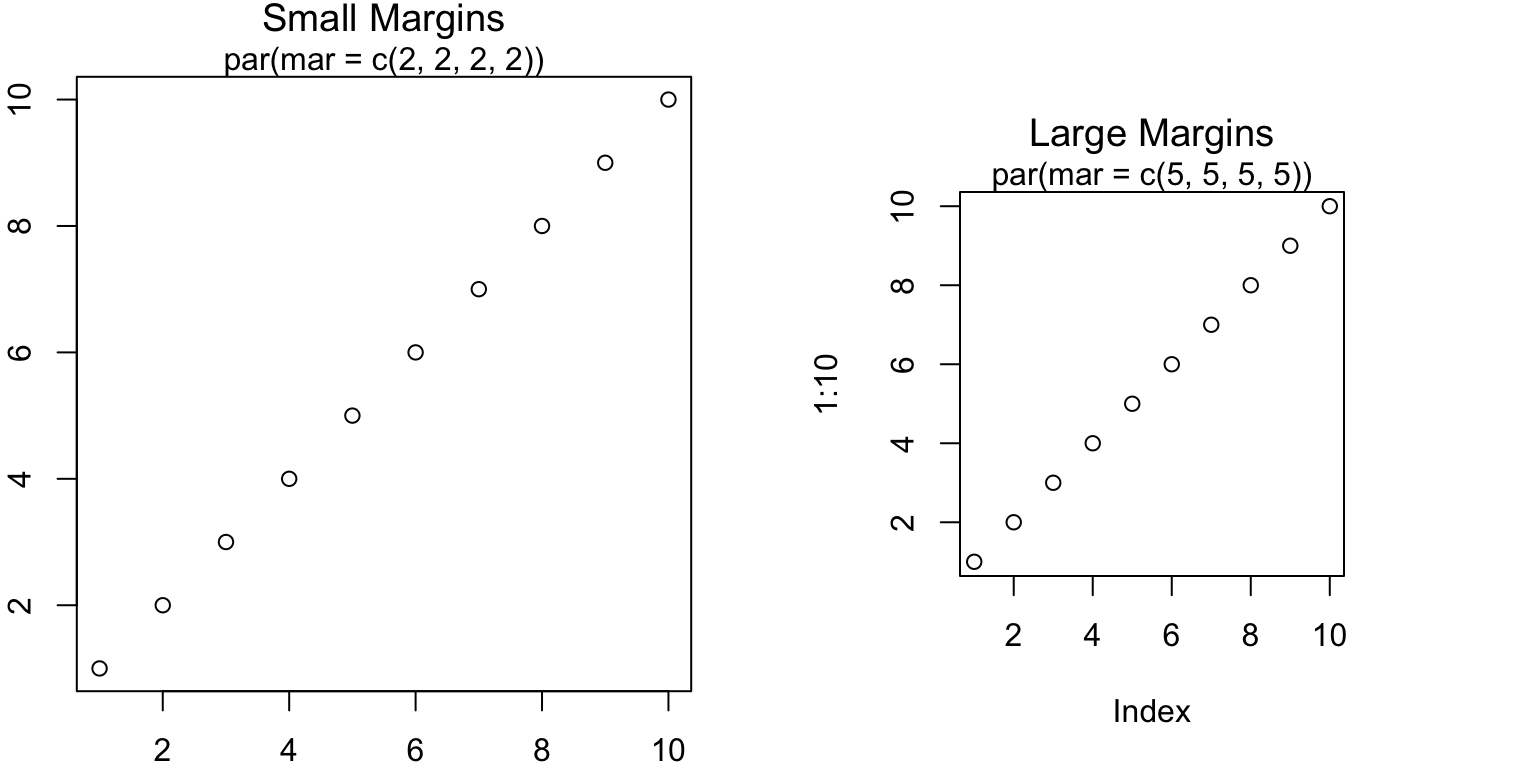
You’ll notice that the margins are so small in the first plot that you can’t even see the axis labels, while in the second plot there is plenty (probably too much) white space around the plotting region.
In addition to using the mar parameter, you can also specify margin sizes with the mai parameter. This acts just like mar except that the values for mai set the margin size in inches.