Chapter 14 ANOVA
Figure 14.1: Menage a trois wine – the perfect pairing for a 3-way ANOVA
In the last chapter we covered 1 and two sample hypothesis tests. In these tests, you are either comparing 1 group to a hypothesized value, or comparing the relationship between two groups (either their means or their correlation). In this chapter, we’ll cover how to analyse more complex experimental designs with ANOVAs.
When do you conduct an ANOVA? You conduct an ANOVA when you are testing the effect of one or more nominal (aka factor) independent variable(s) on a numerical dependent variable. A nominal (factor) variable is one that contains a finite number of categories with no inherent order. Gender, profession, experimental conditions, and Justin Bieber albums are good examples of factors (not necessarily of good music). If you only include one independent variable, this is called a One-way ANOVA. If you include two independent variables, this is called a Two-way ANOVA. If you include three independent variables it is called a Menage a trois `NOVA.
Ok maybe it’s not yet, but we repeat it enough it will be and we can change the world.
For example, let’s say you want to test how well each of three different cleaning fluids are at getting poop off of your poop deck.To test this, you could do the following: over the course of 300 cleaning days, you clean different areas of the deck with the three different cleaners. You then record how long it takes for each cleaner to clean its portion of the deck. At the same time, you could also measure how well the cleaner is cleaning two different types of poop that typically show up on your deck: shark and parrot. Here, your independent variables cleaner and type are factors, and your dependent variable time is numeric.
Thankfully, this experiment has already been conducted. The data are recorded in a dataframe called poopdeck in the yarrr package. Here’s how the first few rows of the data look:
head(poopdeck)
##   day cleaner   type time
## 1   1       a parrot   47
## 2   1       b parrot   55
## 3   1       c parrot   64
## 4   1       a  shark  101
## 5   1       b  shark   76
## 6   1       c  shark   63
We can visualize the poopdeck data using (of course) a pirate plot:
pirateplot(formula = time ~ cleaner + type,
           data = poopdeck,
           ylim = c(0, 150),
           xlab = "Cleaner",
           ylab = "Cleaning Time (minutes)",
           main = "poopdeck data",
           back.col = gray(.97),
           cap.beans = TRUE,
           theme = 2)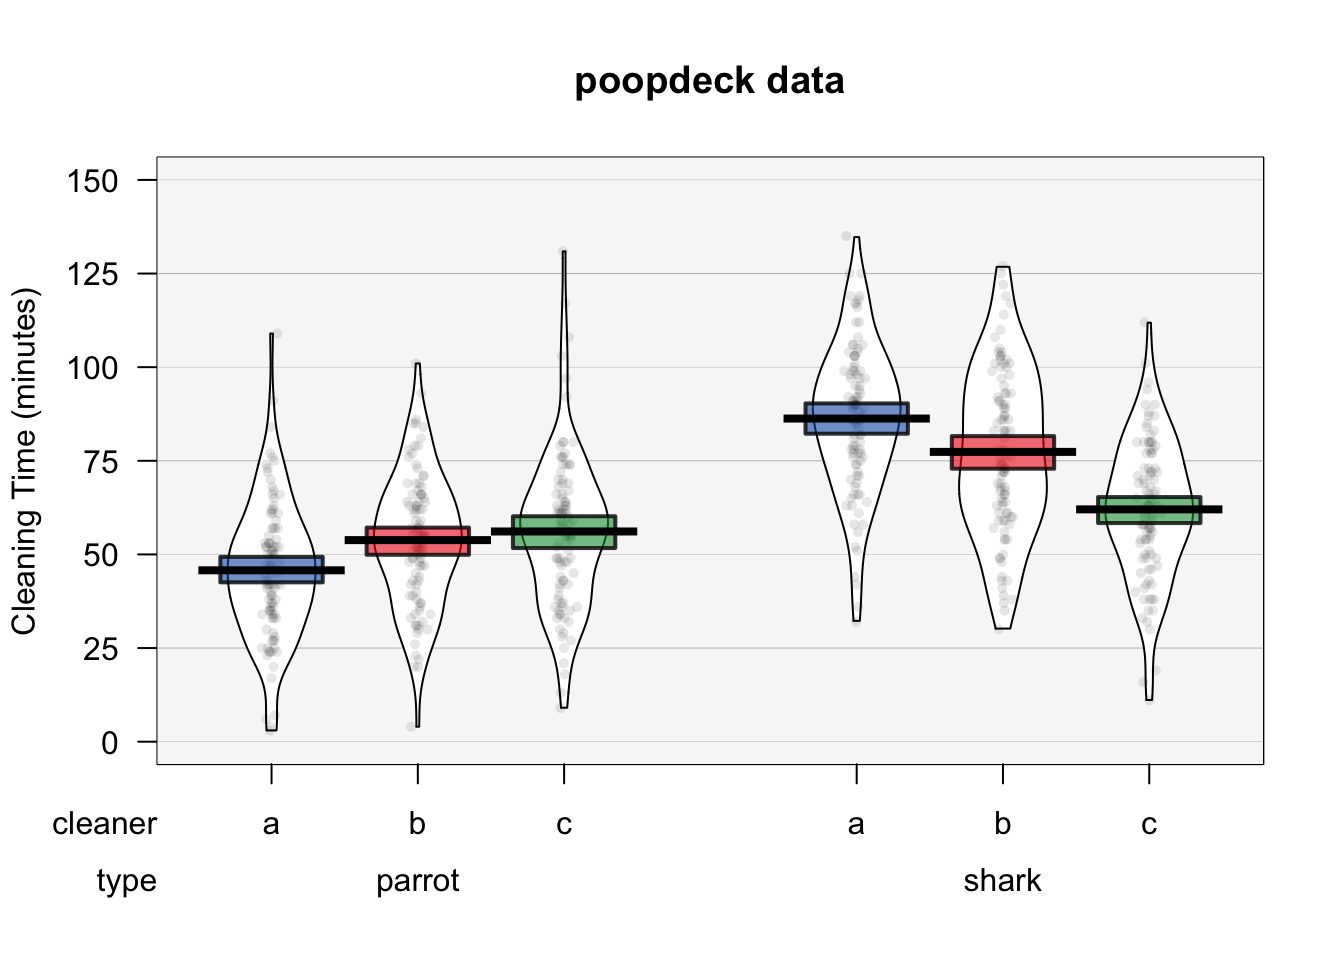
Given this data, we can use ANOVAs to answer four separate questions:
| Question | Analysis | Formula |
|---|---|---|
| Is there a difference between the different cleaners on cleaning time (ignoring poop type)? | One way ANOVA | time ~ cleaner |
| Is there a difference between the different poop types on cleaning time (ignoring which cleaner is used) | One-way ANOVA | time ~ type |
| Is there a unique effect of the cleaner or poop types on cleaning time? | Two-way ANOVA | time ~ cleaner + type |
| Does the effect of cleaner depend on the poop type? | Two-way ANOVA with interaction term |
time ~ cleaner * type |
##Full-factorial between-subjects ANOVA
There are many types of ANOVAs that depend on the type of data you are analyzing. In fact, there are so many types of ANOVAs that there are entire books explaining differences between one type and another. For this book, we’ll cover just one type of ANOVAs called full-factorial, between-subjects ANOVAs. These are the simplest types of ANOVAs which are used to analyze a standard experimental design. In a full-factorial, between-subjects ANOVA, participants (aka, source of data) are randomly assigned to a unique combination of factors – where a combination of factors means a specific experimental condition. For example, consider a psychology study comparing the effects of caffeine on cognitive performance. The study could have two independent variables: drink type (soda vs. coffee vs. energy drink), and drink dose (.25l, .5l, 1l). In a full-factorial design, each participant in the study would be randomly assigned to one drink type and one drink dose condition. In this design, there would be 3 x 3 = 9 conditions.
For the rest of this chapter, I will refer to full-factorial between-subjects ANOVAs as `standard’ ANOVAs
###What does ANOVA stand for?
ANOVA stands for “Analysis of variance.” At first glance, this sounds like a strange name to give to a test that you use to find differences in means, not differences in variances. However, ANOVA actually uses variances to determine whether or not there are ‘real’ differences in the means of groups. Specifically, it looks at how variable data are within groups and compares that to the variability of data between groups. If the between-group variance is large compared to the within group variance, the ANOVA will conclude that the groups do differ in their means. If the between-group variance is small compared to the within group variance, the ANOVA will conclude that the groups are all the same. See Figure~\(\ref{fig:anovadiagram}\) for a visual depiction of an ANOVA.
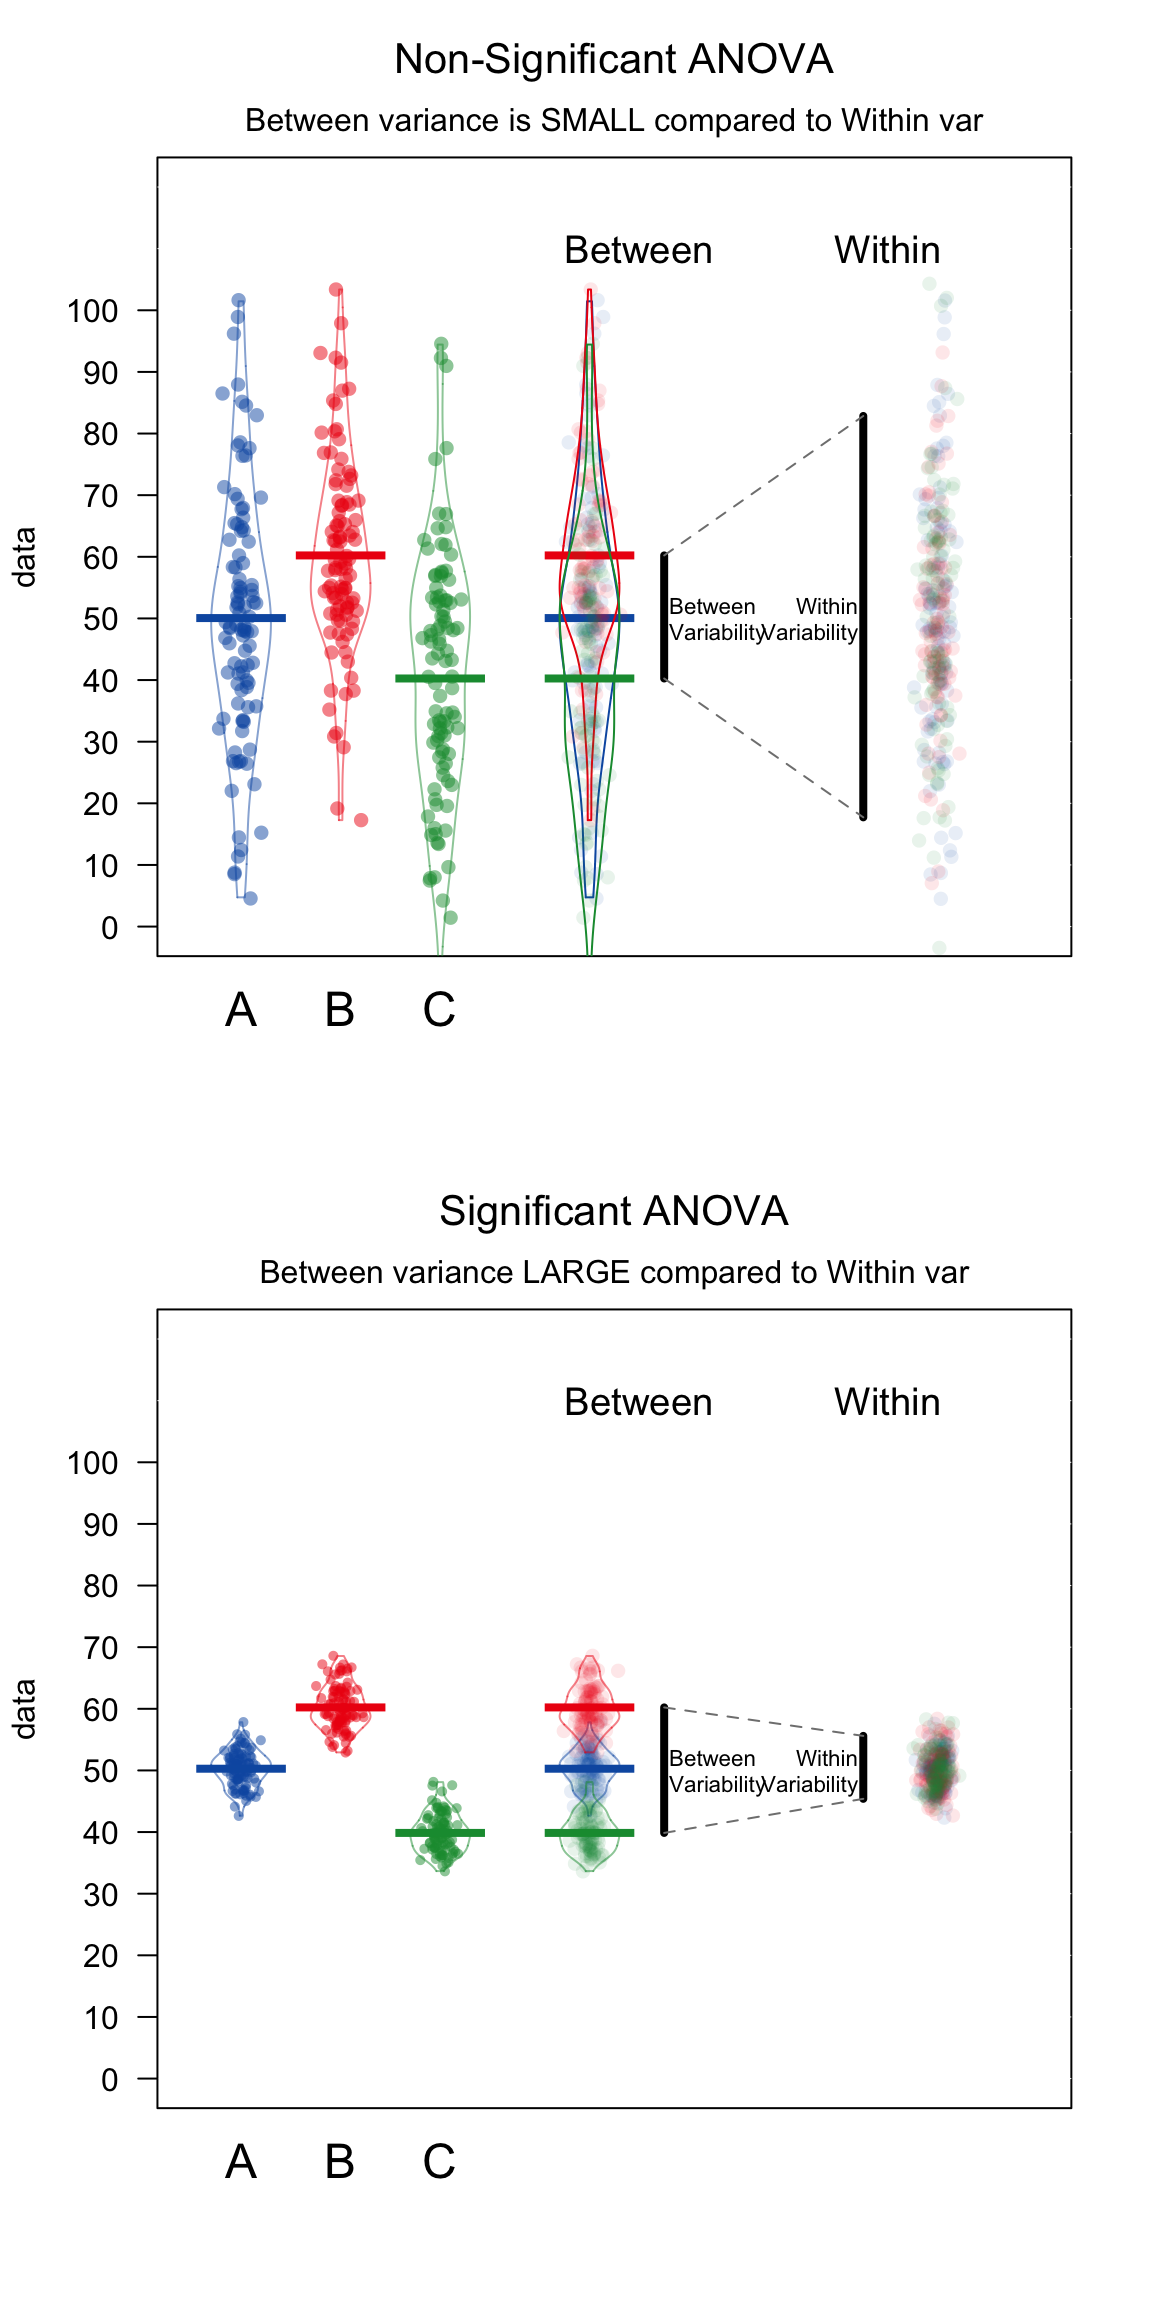
Figure 14.2: How ANOVAs work. ANOVA compares the variability between groups (i.e.; the differences in the group means) to the variability within groups (i.e.; how much individuals generally differ from each other). If the variability between groups is small compared to the variability between groups, ANOVA will return a non-significant result – suggesting that the groups are not really different. If the variability between groups is large compared to the variability within groups, ANOVA will return a significant result – indicating that the groups are really different.
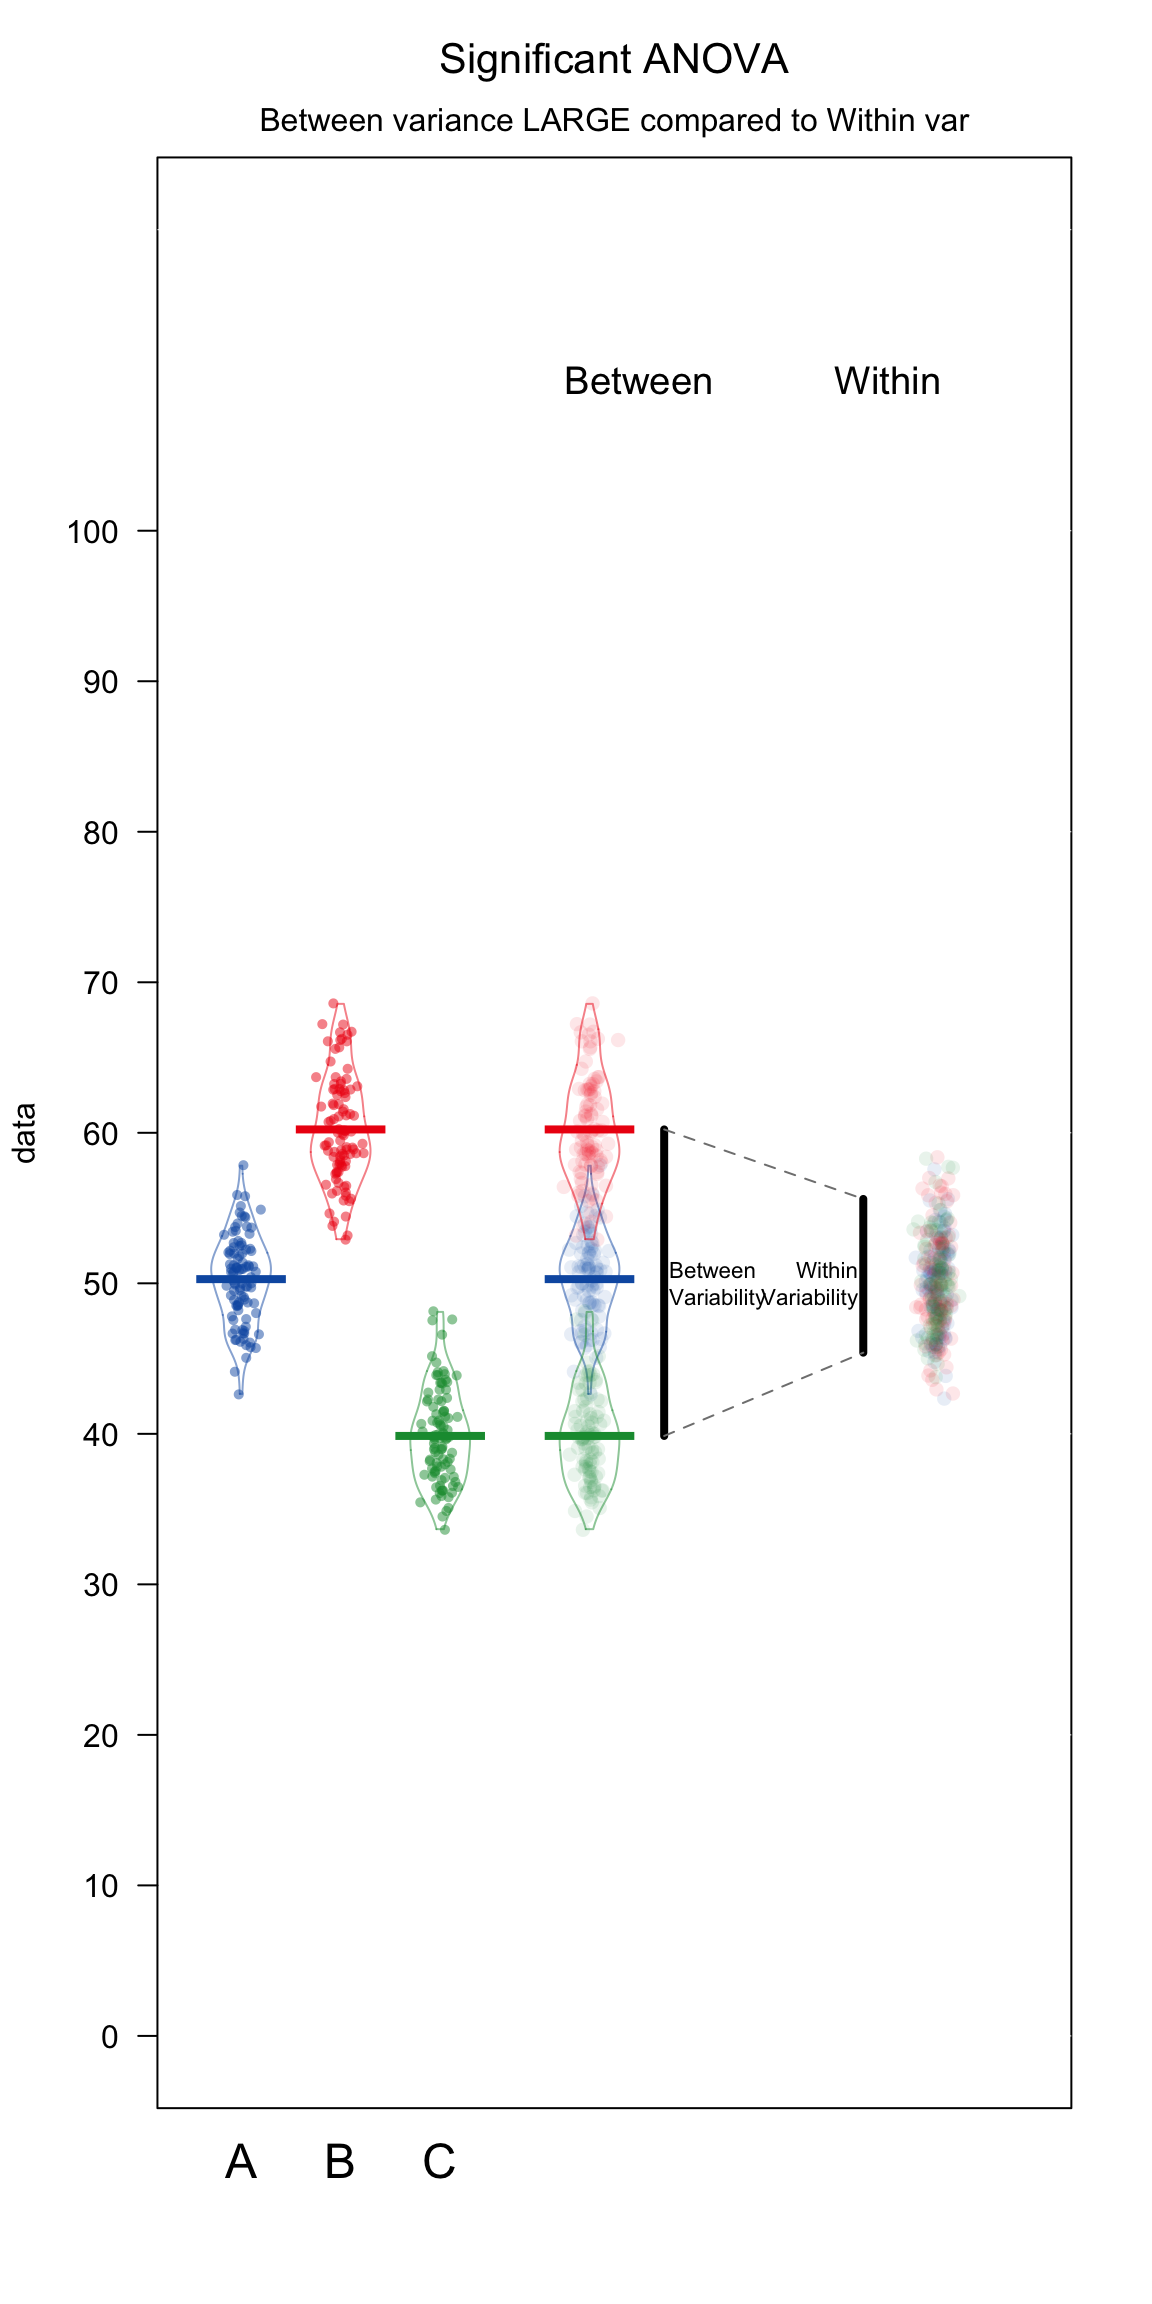
Figure 14.3: How ANOVAs work. ANOVA compares the variability between groups (i.e.; the differences in the group means) to the variability within groups (i.e.; how much individuals generally differ from each other). If the variability between groups is small compared to the variability between groups, ANOVA will return a non-significant result – suggesting that the groups are not really different. If the variability between groups is large compared to the variability within groups, ANOVA will return a significant result – indicating that the groups are really different.