Chapter 6 Seed Weight
6.1 2019 Seed Weight Data
6.1.1 2019 sW22 backcrossed to W22
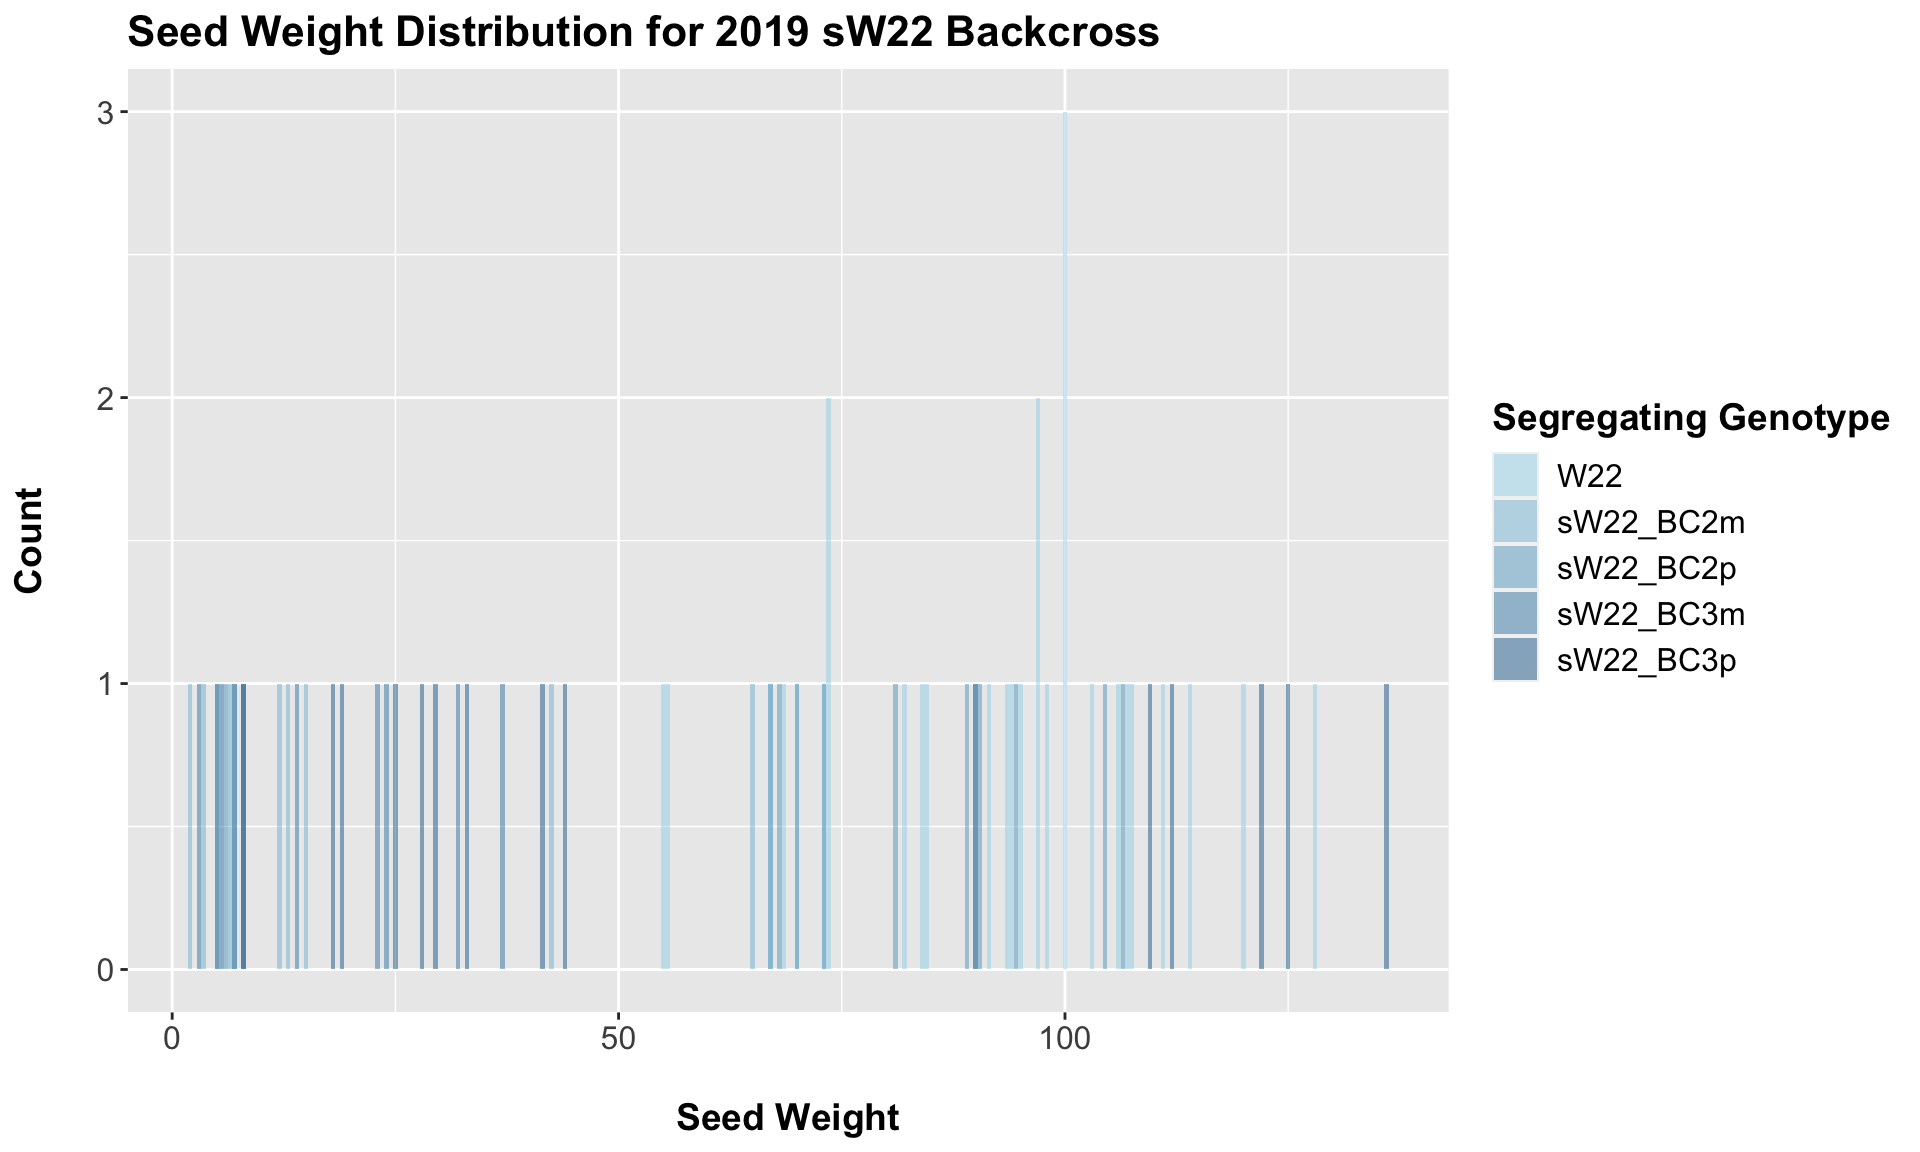
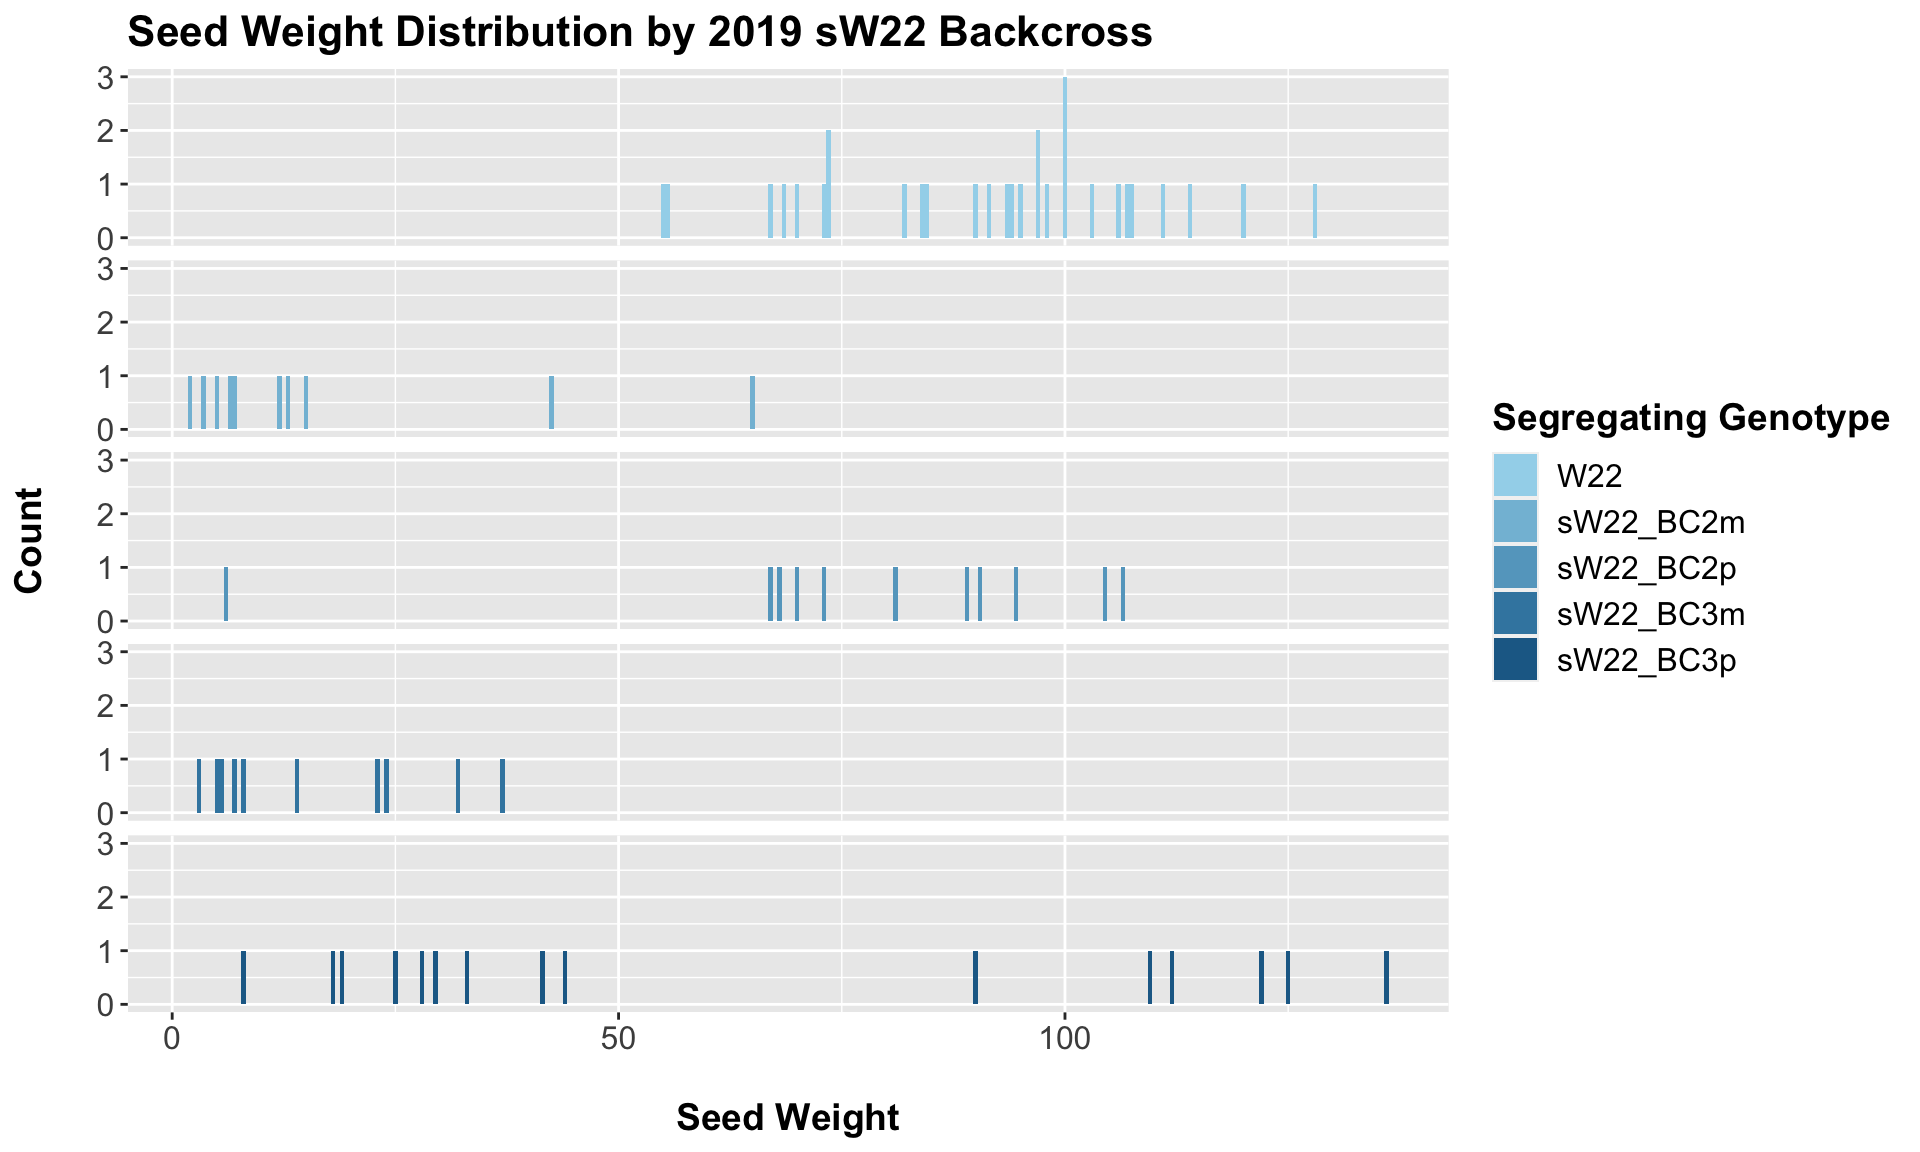
##
##  Mean, SD, and SE for each genotype
## Seg_Genotype N mean sd se
## 1 W22 30 91.30000 18.21169 3.324984
## 2 sW22_BC2m 10 17.15000 20.44104 6.464024
## 3 sW22_BC2p 11 77.27273 27.49760 8.290839
## 4 sW22_BC3m 10 15.85000 12.28832 3.885908
## 5 sW22_BC3p 15 62.70000 46.63337 12.040685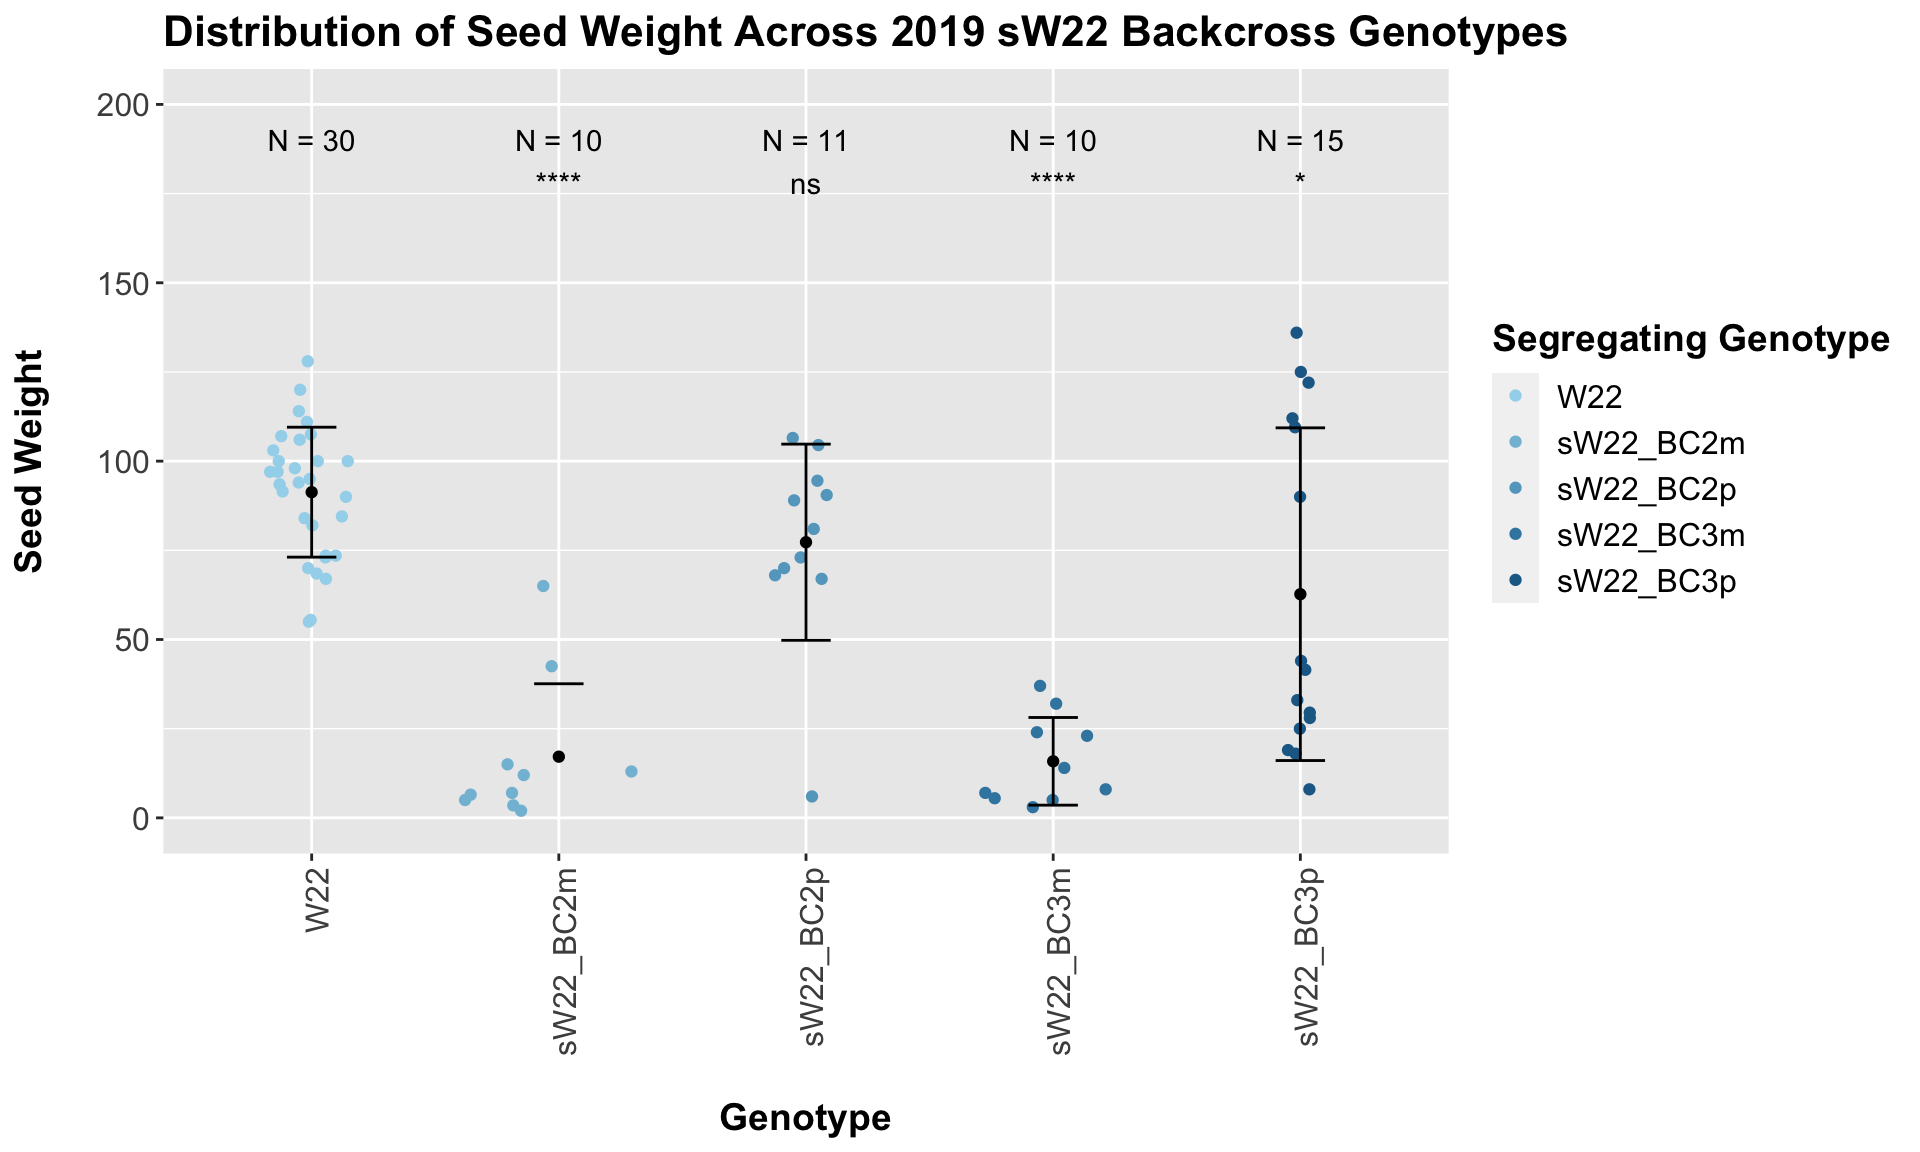
##
## Results of T-test used to obtain significance in the above plot
## # A tibble: 4 x 8
## .y. group1 group2 p p.adj p.format p.signif method
## <chr> <chr> <chr> <dbl> <dbl> <chr> <chr> <chr>
## 1 Ear_Trait W22 sW22_BC2m 6.90e- 8 2.10e- 7 6.9e-08 **** T-test
## 2 Ear_Trait W22 sW22_BC2p 1.40e- 1 1.40e- 1 0.140 ns T-test
## 3 Ear_Trait W22 sW22_BC3m 2.90e-13 1.20e-12 2.9e-13 **** T-test
## 4 Ear_Trait W22 sW22_BC3p 3.58e- 2 7.20e- 2 0.036 * T-testInterestingly, we see a significant reduction in seed weight among backcrosses where the maternal parent was sick (BC2m and BC3m), but we do not see this trend play out among the paternal crosses. It does not seem like there is a strong change in seed weight between the generations.
We may also we separate the data by which field the row was in.

The trend and associated significance seems to hold out if we stratify the data by field.
6.1.2 2019 sW22 and W22 backcrossed to B73
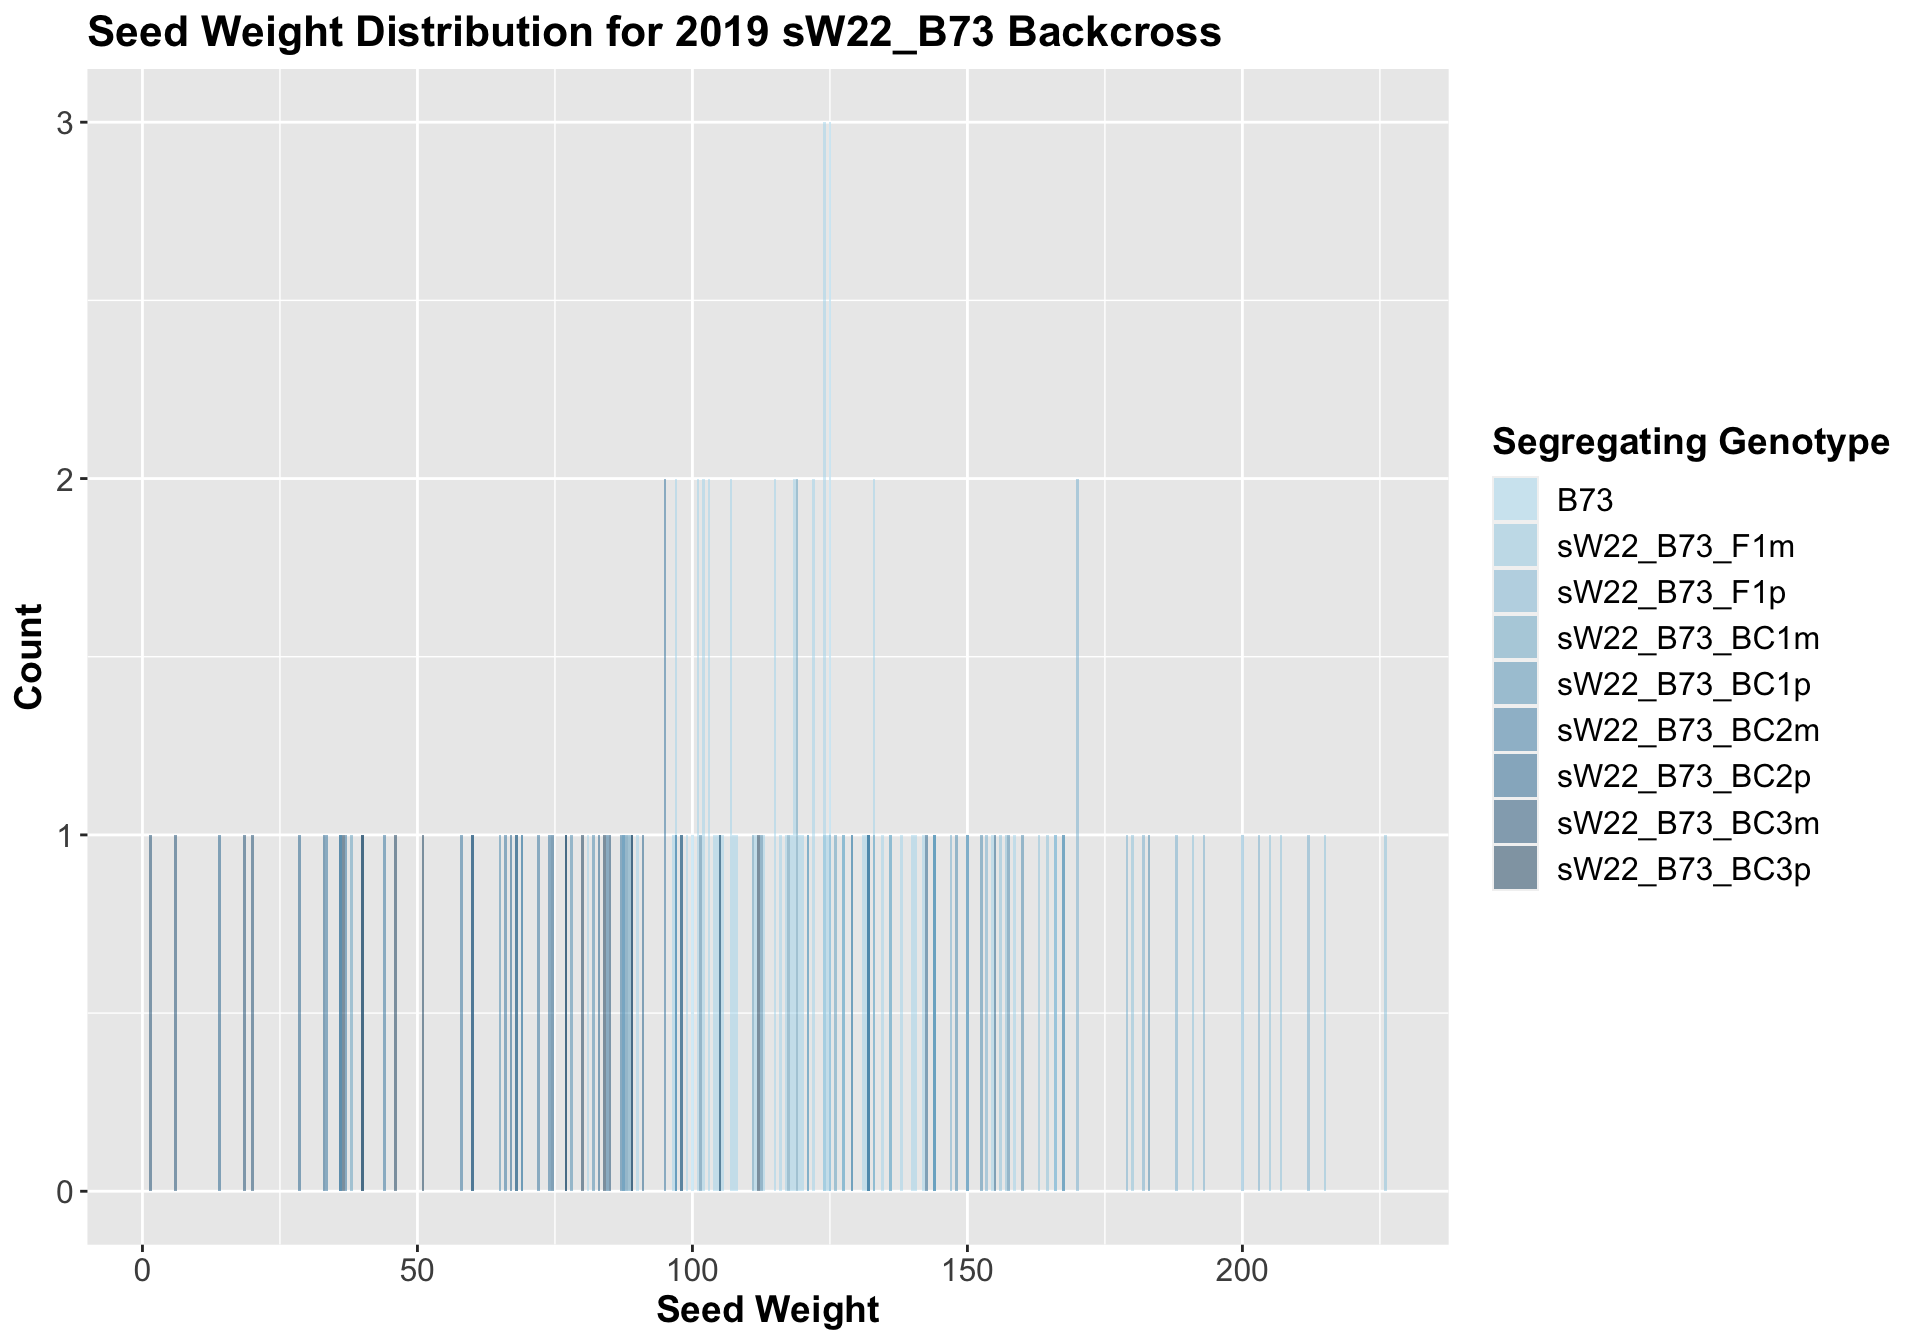
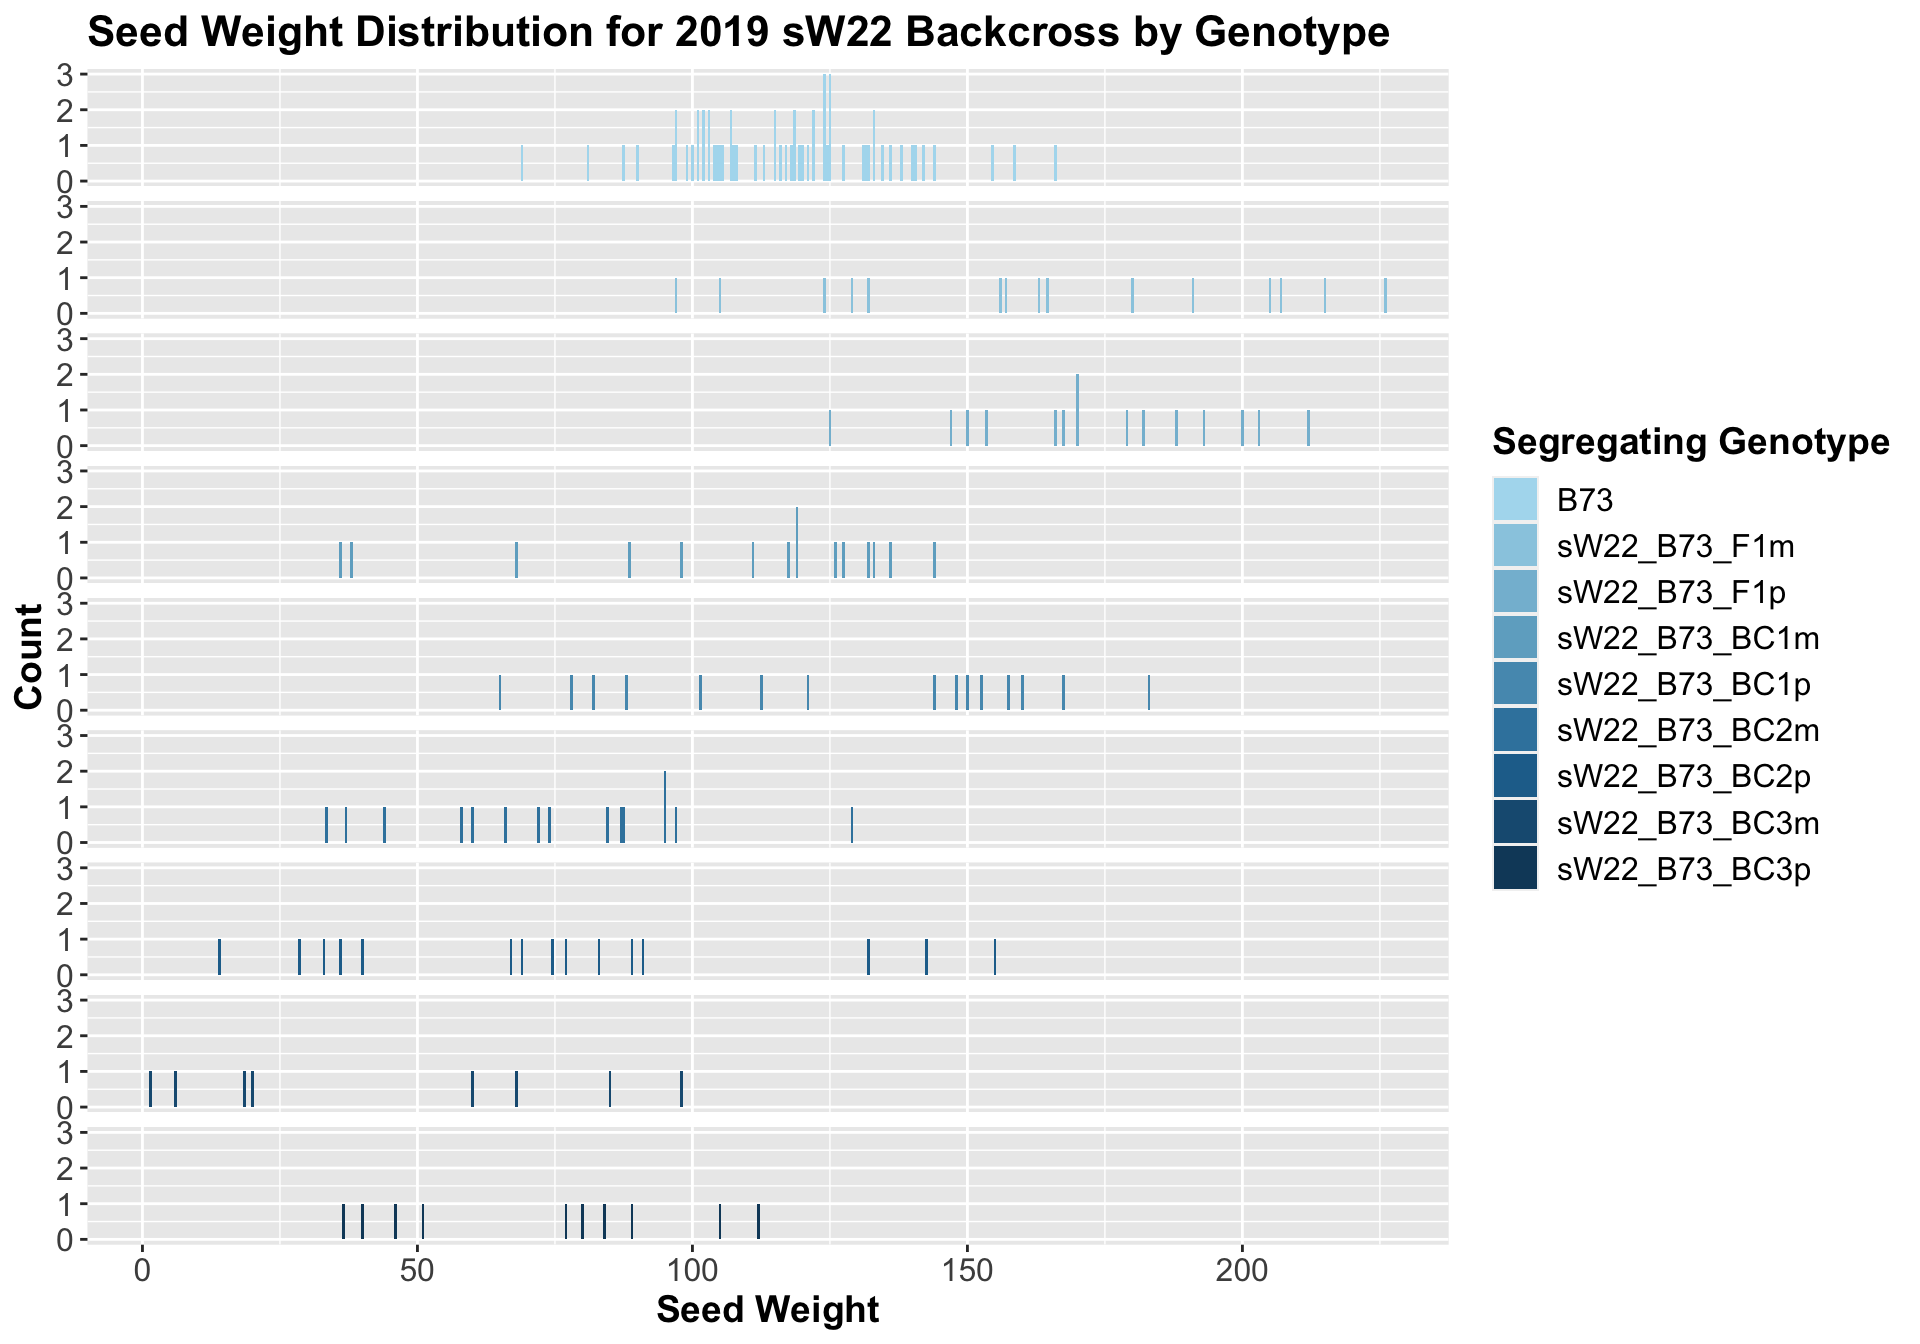
##
##  Mean, SD, and SE for each genotype
## Seg_Genotype N mean sd se
## 1 B73 60 117.30000 18.51138 2.389809
## 2 sW22_B73_F1m 15 163.43333 40.43375 10.439949
## 3 sW22_B73_F1p 15 173.73333 23.71020 6.121949
## 4 sW22_B73_BC1m 15 106.23333 34.27195 8.848980
## 5 sW22_B73_BC1p 15 127.36667 37.21581 9.609081
## 6 sW22_B73_BC2m 15 74.63333 25.80245 6.662165
## 7 sW22_B73_BC2p 15 75.43333 42.43982 10.957914
## 8 sW22_B73_BC3m 8 44.62500 37.61150 13.297674
## 9 sW22_B73_BC3p 10 72.05000 27.10520 8.571416
## # A tibble: 8 x 8
##   .y.       group1 group2                   p     p.adj p.format p.signif method
##   <chr>     <chr>  <chr>                <dbl>     <dbl> <chr>    <chr>    <chr>
## 1 Ear_Trait B73    sW22_B73_F1m  0.000580       2.90e-3 0.00058  ***      T-test
## 2 Ear_Trait B73    sW22_B73_F1p  0.0000000714   5.70e-7 7.1e-08  ****     T-test
## 3 Ear_Trait B73    sW22_B73_BC1m 0.245          4.90e-1 0.24474  ns       T-test
## 4 Ear_Trait B73    sW22_B73_BC1p 0.325          4.90e-1 0.32466  ns       T-test
## 5 Ear_Trait B73    sW22_B73_BC2m 0.0000112      7.90e-5 1.1e-05  ****     T-test
## 6 Ear_Trait B73    sW22_B73_BC2p 0.00193        5.80e-3 0.00193  **       T-test
## 7 Ear_Trait B73    sW22_B73_BC3m 0.000837       3.30e-3 0.00084  ***      T-test
## 8 Ear_Trait B73    sW22_B73_BC3p 0.000414       2.50e-3 0.00041  ***      T-test
We see an initial increase in seed weight among the F1s that continues to decline as we continue to backcross to B73. Once again, it seems as if though the paternal crosses are slightly heavier than the maternal crosses. Also, it does seem like there is noticeably more variation in the seed weight of our crosses compared to B73.
Once, again, we separate the data by field, to see whether the trend is the same.

If we separate by field, we see that the trend does hold. It maintains equal significance in field 1, and it shows slightly reduced significance in field 2.
We can compare the weight data across the W22 backcrossed to B73 rows to look at this set of controls.
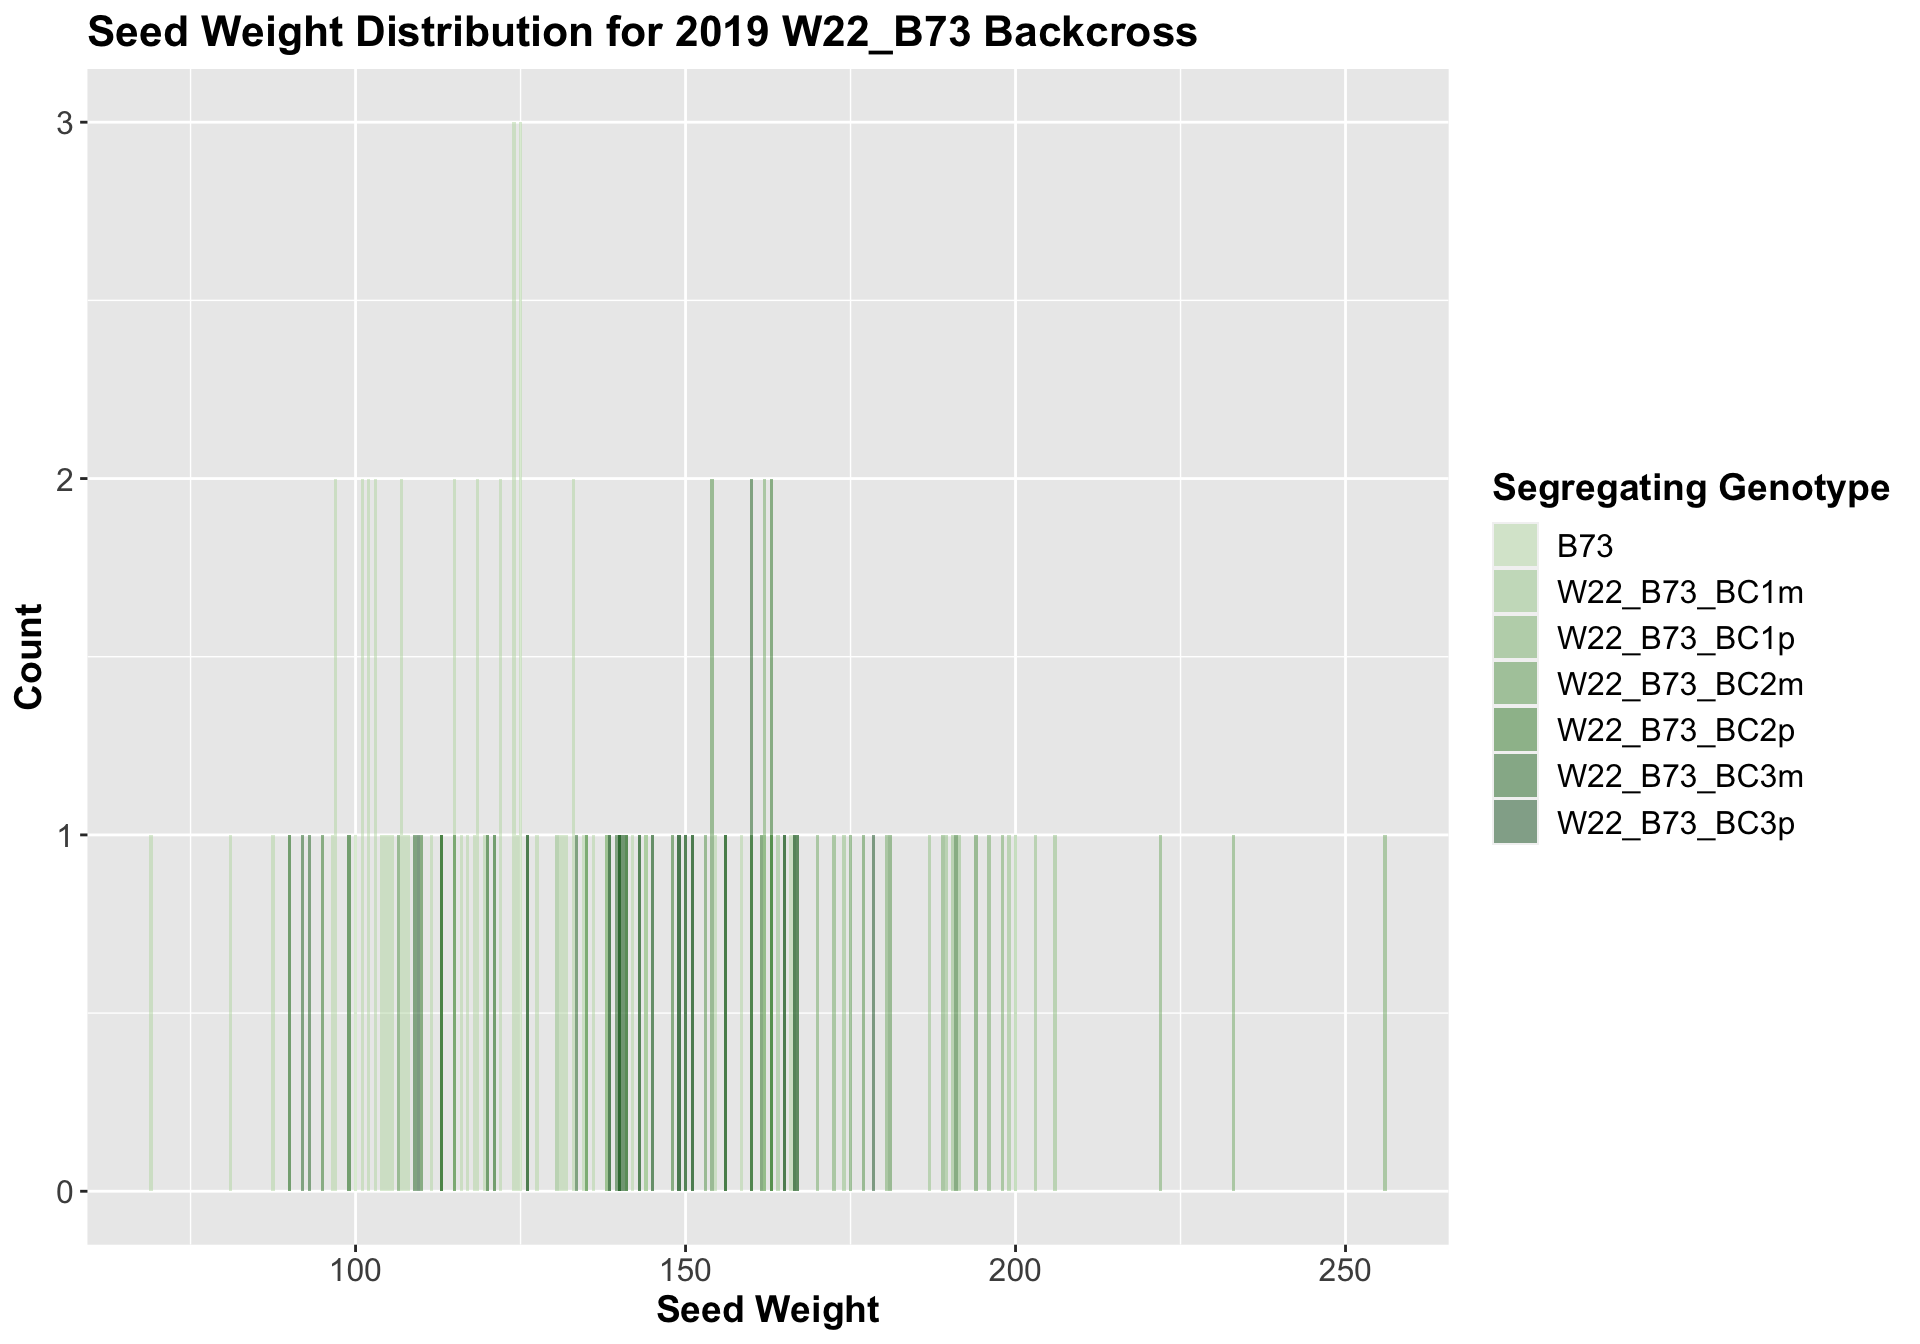
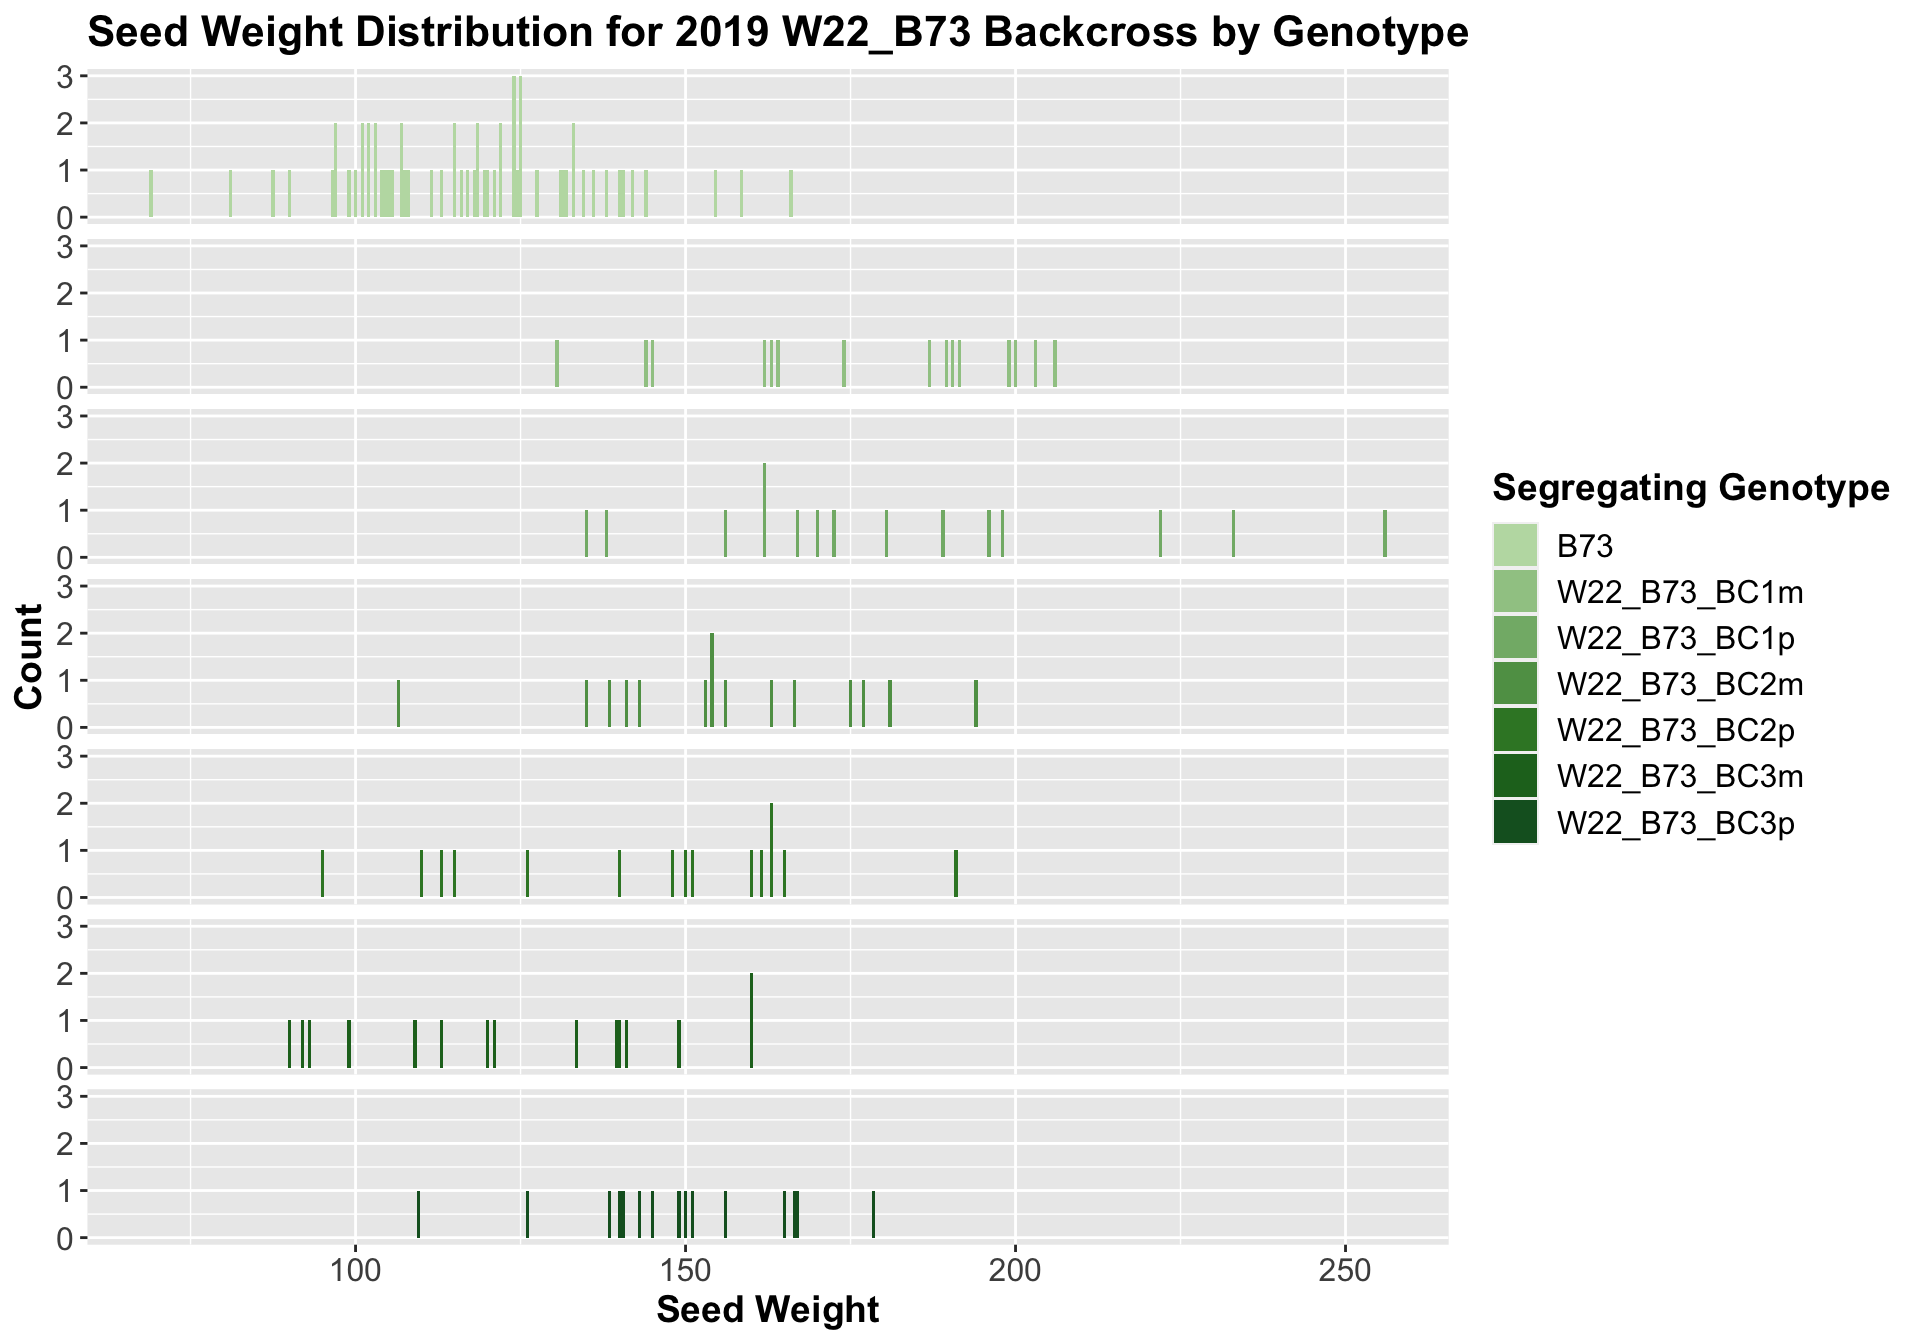
##
##  Mean, SD, and SE for each genotype
## Seg_Genotype N mean sd se
## 1 B73 60 117.3000 18.51138 2.389809
## 2 W22_B73_BC1m 15 176.6000 23.98005 6.191623
## 3 W22_B73_BC1p 15 182.4667 34.07684 8.798602
## 4 W22_B73_BC2m 15 155.8333 21.77537 5.622376
## 5 W22_B73_BC2p 15 143.4333 26.36208 6.806661
## 6 W22_B73_BC3m 15 124.0000 24.24503 6.260040
## 7 W22_B73_BC3p 15 148.3667 17.33954 4.477049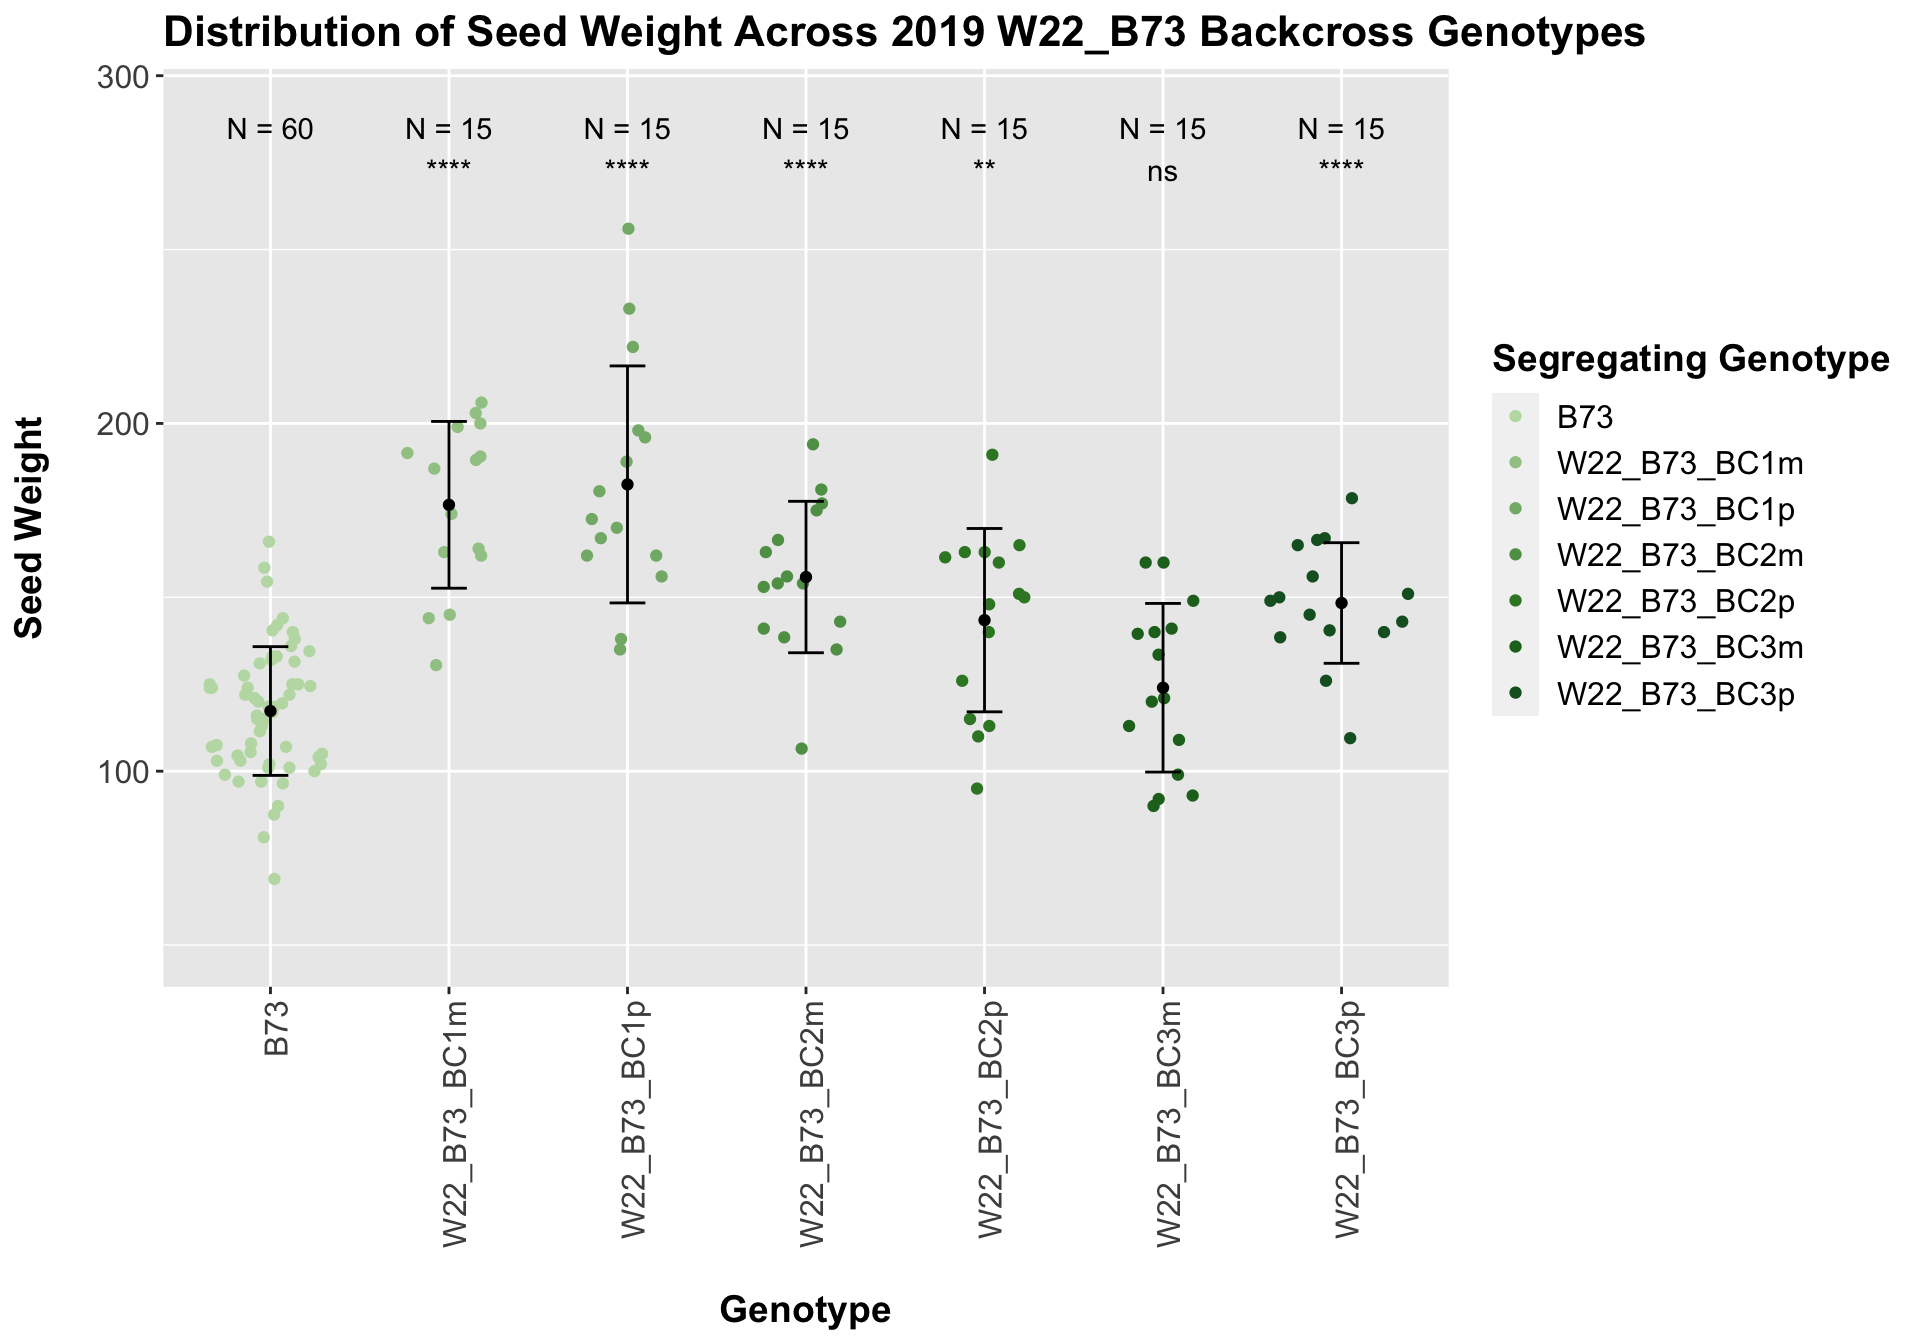
## # A tibble: 6 x 8
##   .y.       group1 group2                  p      p.adj p.format p.signif method
##   <chr>     <chr>  <chr>               <dbl>      <dbl> <chr>    <chr>    <chr>
## 1 Ear_Trait B73    W22_B73_BC1m 0.0000000411 0.00000025 4.1e-08  ****     T-test
## 2 Ear_Trait B73    W22_B73_BC1p 0.00000222   0.000011   2.2e-06  ****     T-test
## 3 Ear_Trait B73    W22_B73_BC2m 0.00000431   0.000013   4.3e-06  ****     T-test
## 4 Ear_Trait B73    W22_B73_BC2p 0.00201      0.004      0.002    **       T-test
## 5 Ear_Trait B73    W22_B73_BC3m 0.330        0.33       0.330    ns       T-test
## 6 Ear_Trait B73    W22_B73_BC3p 0.00000322   0.000013   3.2e-06  ****     T-test
Once again, we see an initial increase in seed weight among our backcrosses that slowly declines. This pattern holds if we separate by field, and it is noticeably heavier than the sW22_B73 backcrosses.
We may also compare the distribution for sW22_B73 backcrosses to W22_B73 backcrosses and each generation compares across these two sets. Note: when looking at these plots, just be aware that the genotypes don't align perfectly across backcrosses because we don't have a few crosses for the W22_B73 genotypes.
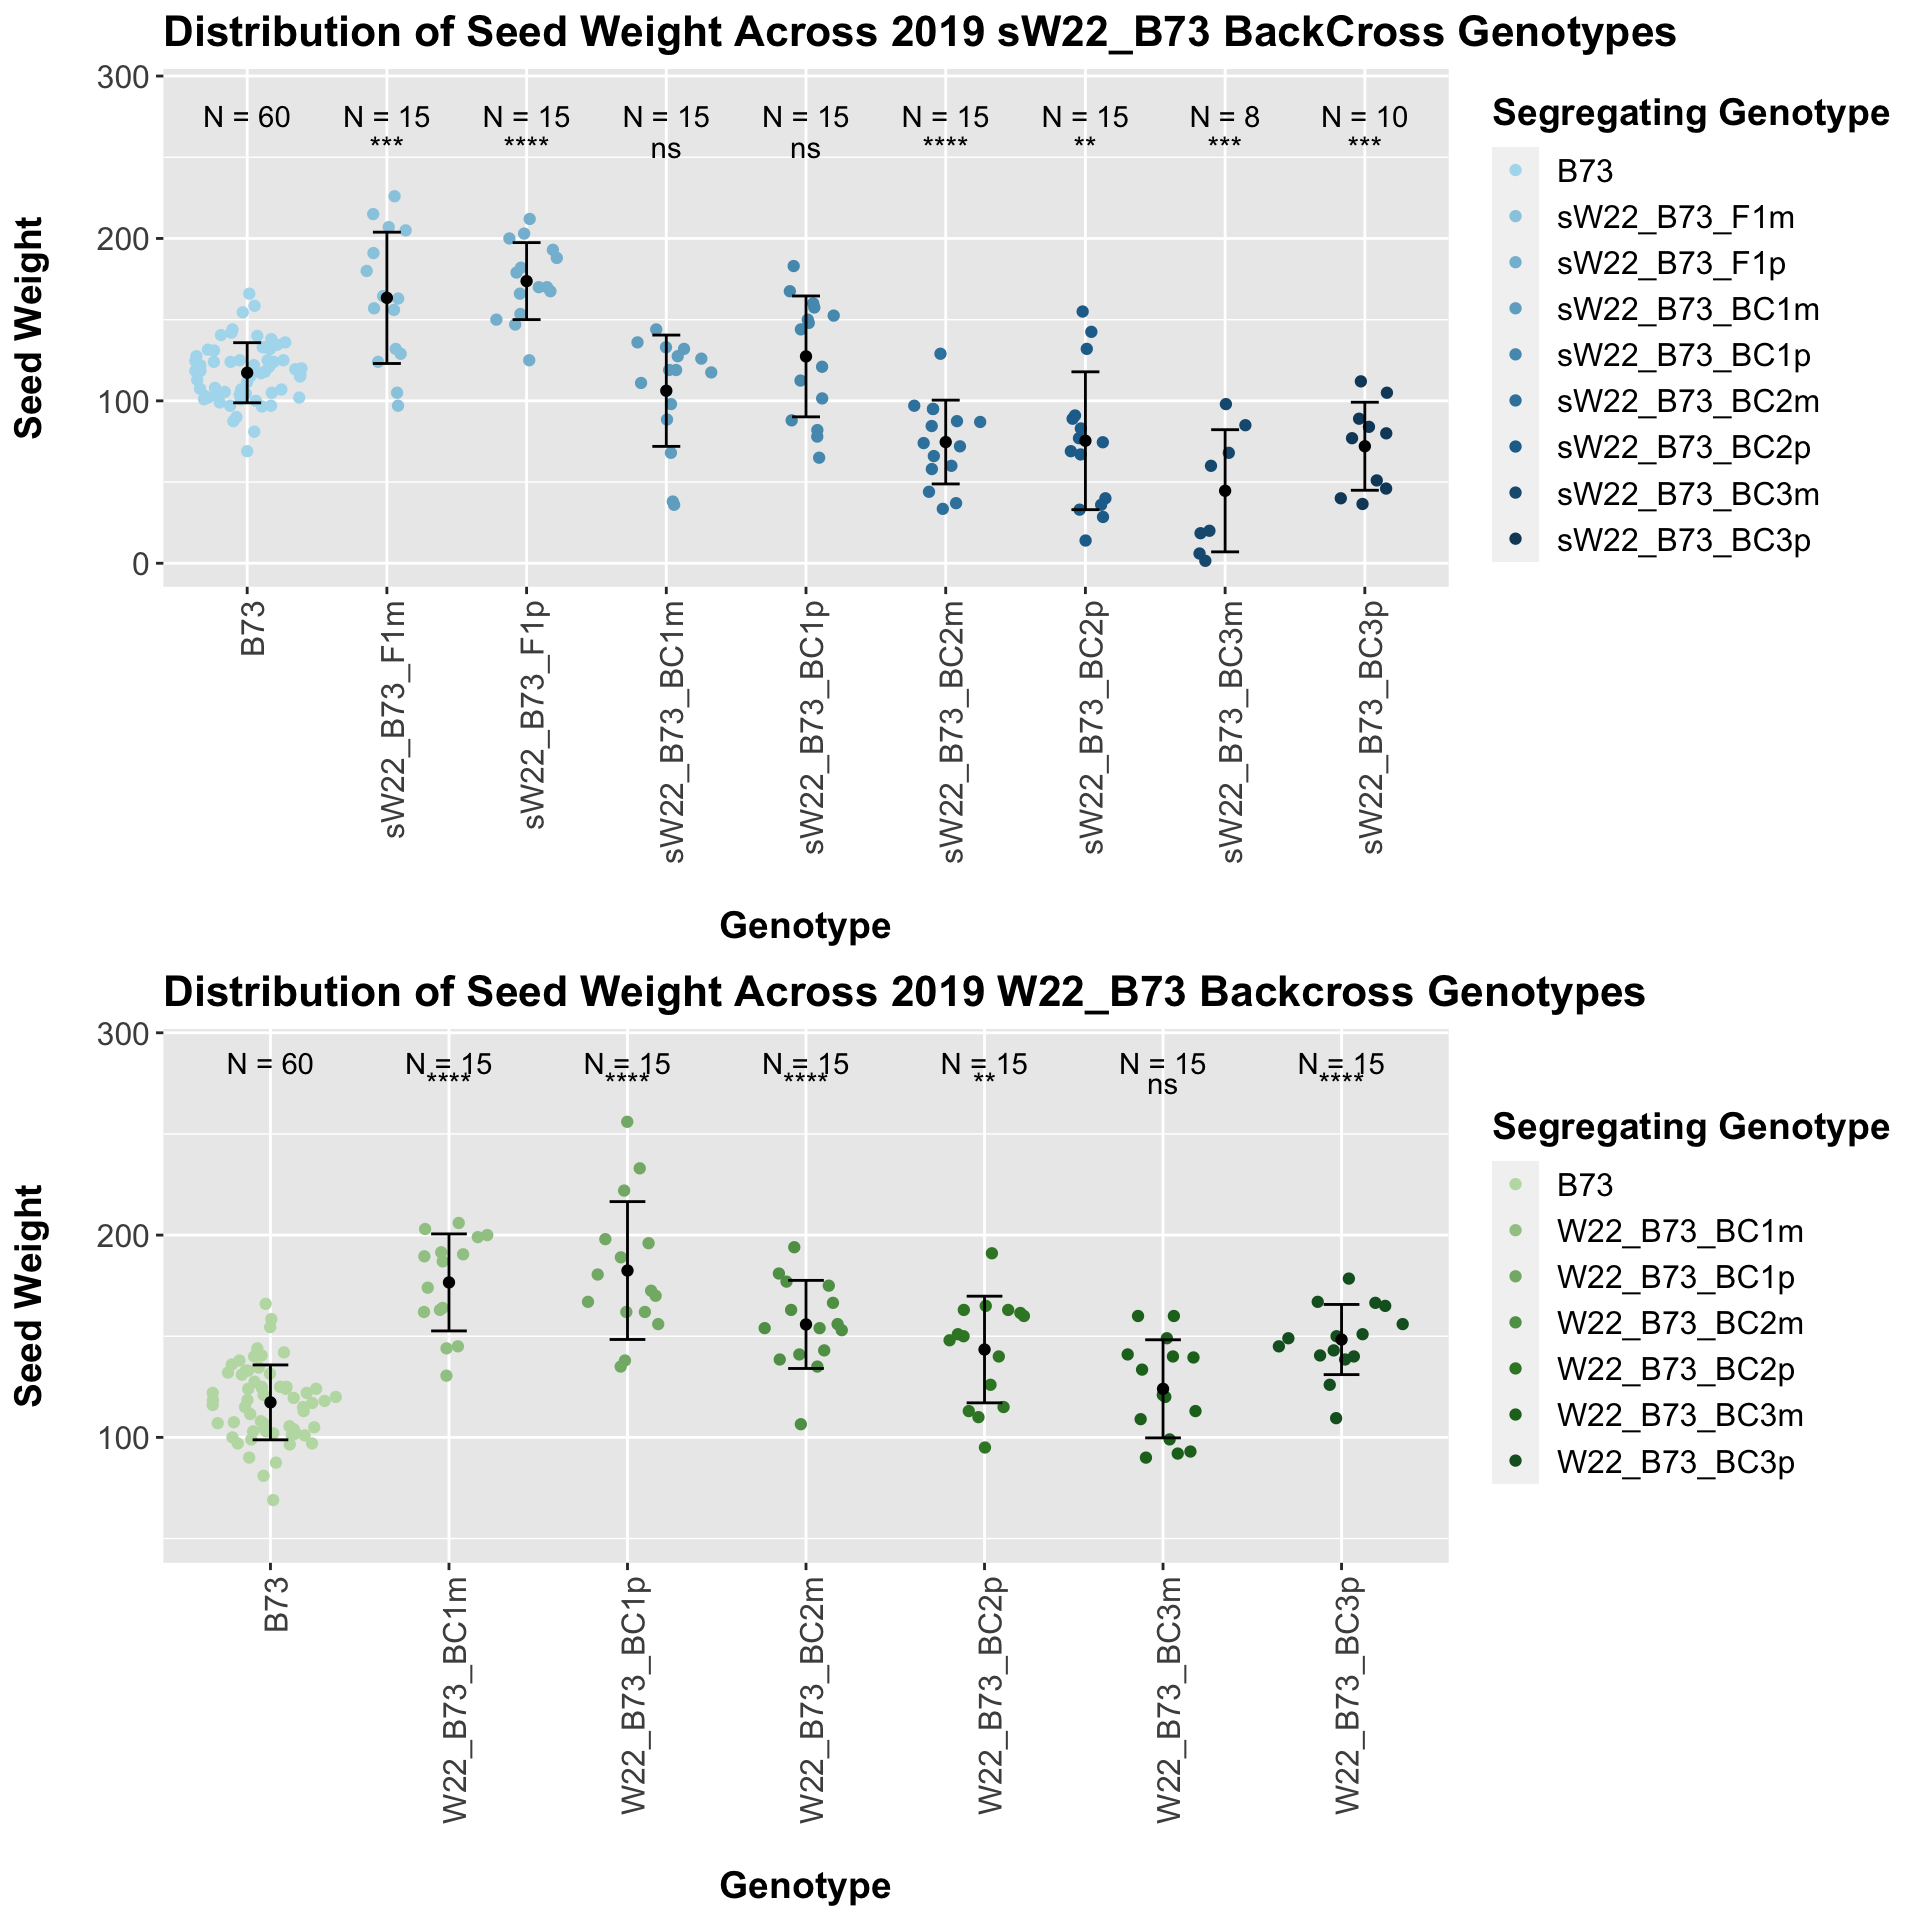

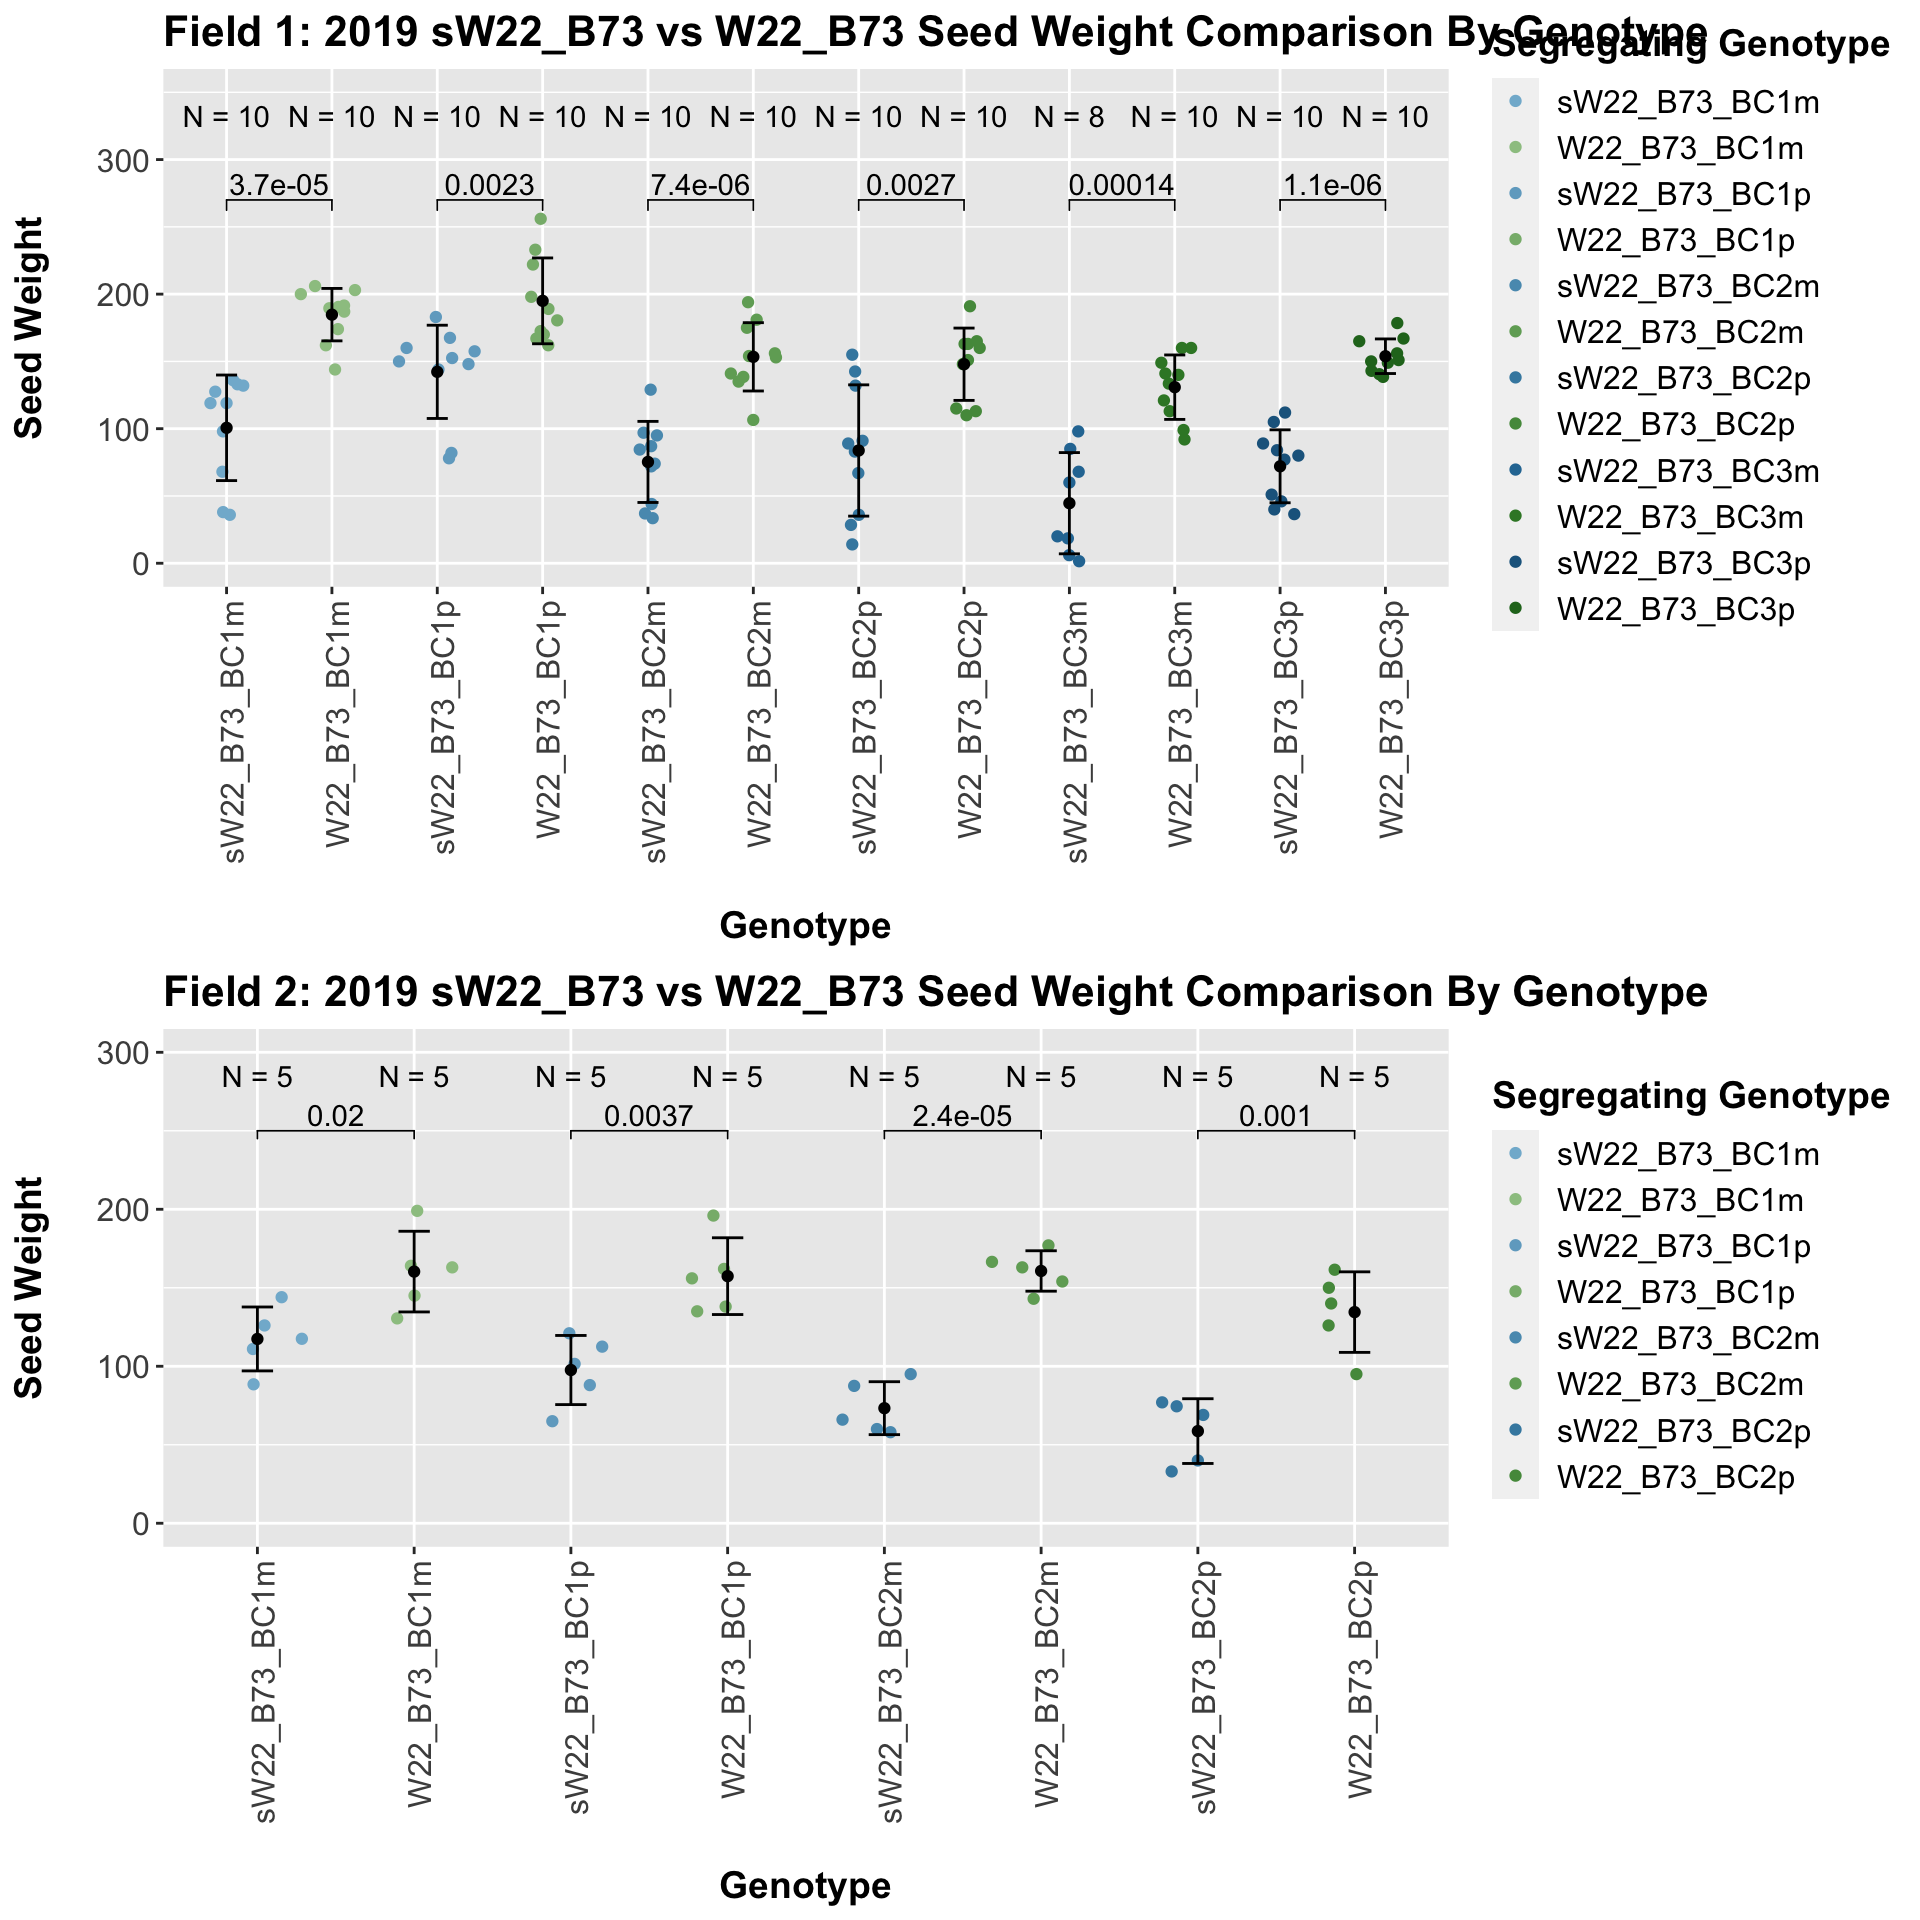
When we specifically compare the seed weight between sW22 and W22 backcrossed to B73 at each generation, we see a significant reduction in seed weight of the sW22 backcross against the W22 backcross. If we stratify this data by field, we see that this continues to remain significant. There also seems to be a much stronger decline in seed weight among the sW22_B73 backcrosses compared to the w22_B73 backcrosses.
6.1.3 2019 sW22 and W22 backcrossed to Mo17
##
##  Mean, SD, and SE for each genotype
## Seg_Genotype N mean sd se
## 1 Mo17 60 117.05000 20.12139 2.597660
## 2 sW22_Mo17_F1m 15 144.53333 43.59164 11.255313
## 3 sW22_Mo17_F1p 15 120.73333 50.80982 13.119040
## 4 sW22_Mo17_BC1m 15 87.33333 51.87714 13.394621
## 5 sW22_Mo17_BC1p 15 118.06667 40.65177 10.496243
## 6 sW22_Mo17_BC2m 15 77.46667 35.24378 9.099904
## 7 sW22_Mo17_BC2p 14 52.89286 33.03447 8.828833
## 8 sW22_Mo17_BC3m 10 105.95000 33.95050 10.736089
## 9 sW22_Mo17_BC3p 15 83.36667 35.76334 9.234055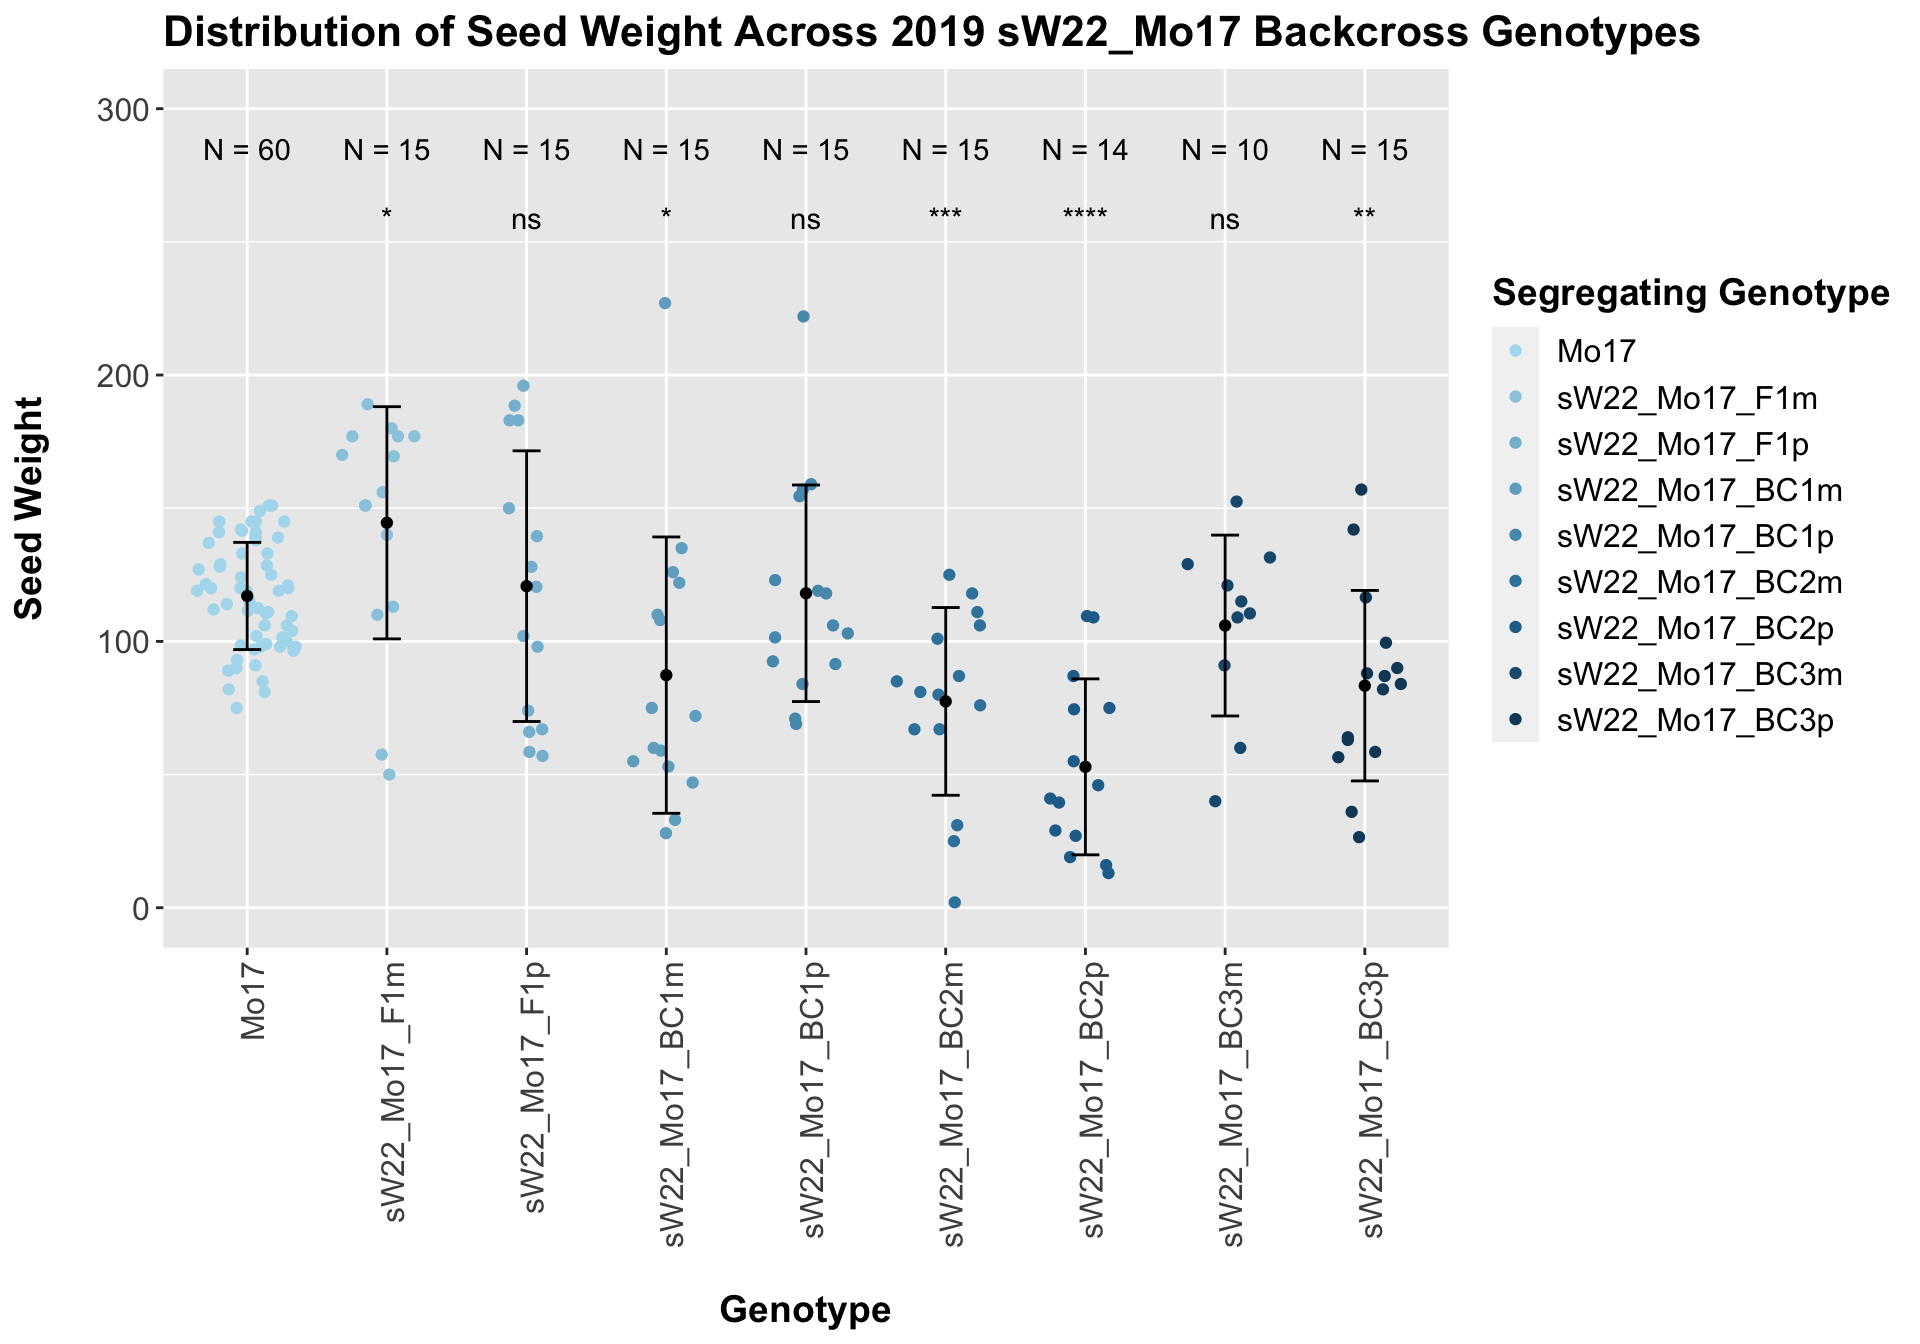
## # A tibble: 8 x 8
##   .y.       group1 group2                  p    p.adj p.format p.signif method
##   <chr>     <chr>  <chr>               <dbl>    <dbl> <chr>    <chr>    <chr>
## 1 Ear_Trait Mo17   sW22_Mo17_F1m  0.0306     0.15     0.03056  *        T-test
## 2 Ear_Trait Mo17   sW22_Mo17_F1p  0.787      1        0.78673  ns       T-test
## 3 Ear_Trait Mo17   sW22_Mo17_BC1m 0.0457     0.18     0.04570  *        T-test
## 4 Ear_Trait Mo17   sW22_Mo17_BC1p 0.926      1        0.92628  ns       T-test
## 5 Ear_Trait Mo17   sW22_Mo17_BC2m 0.000674   0.0047   0.00067  ***      T-test
## 6 Ear_Trait Mo17   sW22_Mo17_BC2p 0.00000400 0.000032 4e-06    ****     T-test
## 7 Ear_Trait Mo17   sW22_Mo17_BC3m 0.338      1        0.33846  ns       T-test
## 8 Ear_Trait Mo17   sW22_Mo17_BC3p 0.00283    0.017    0.00283  **       T-test
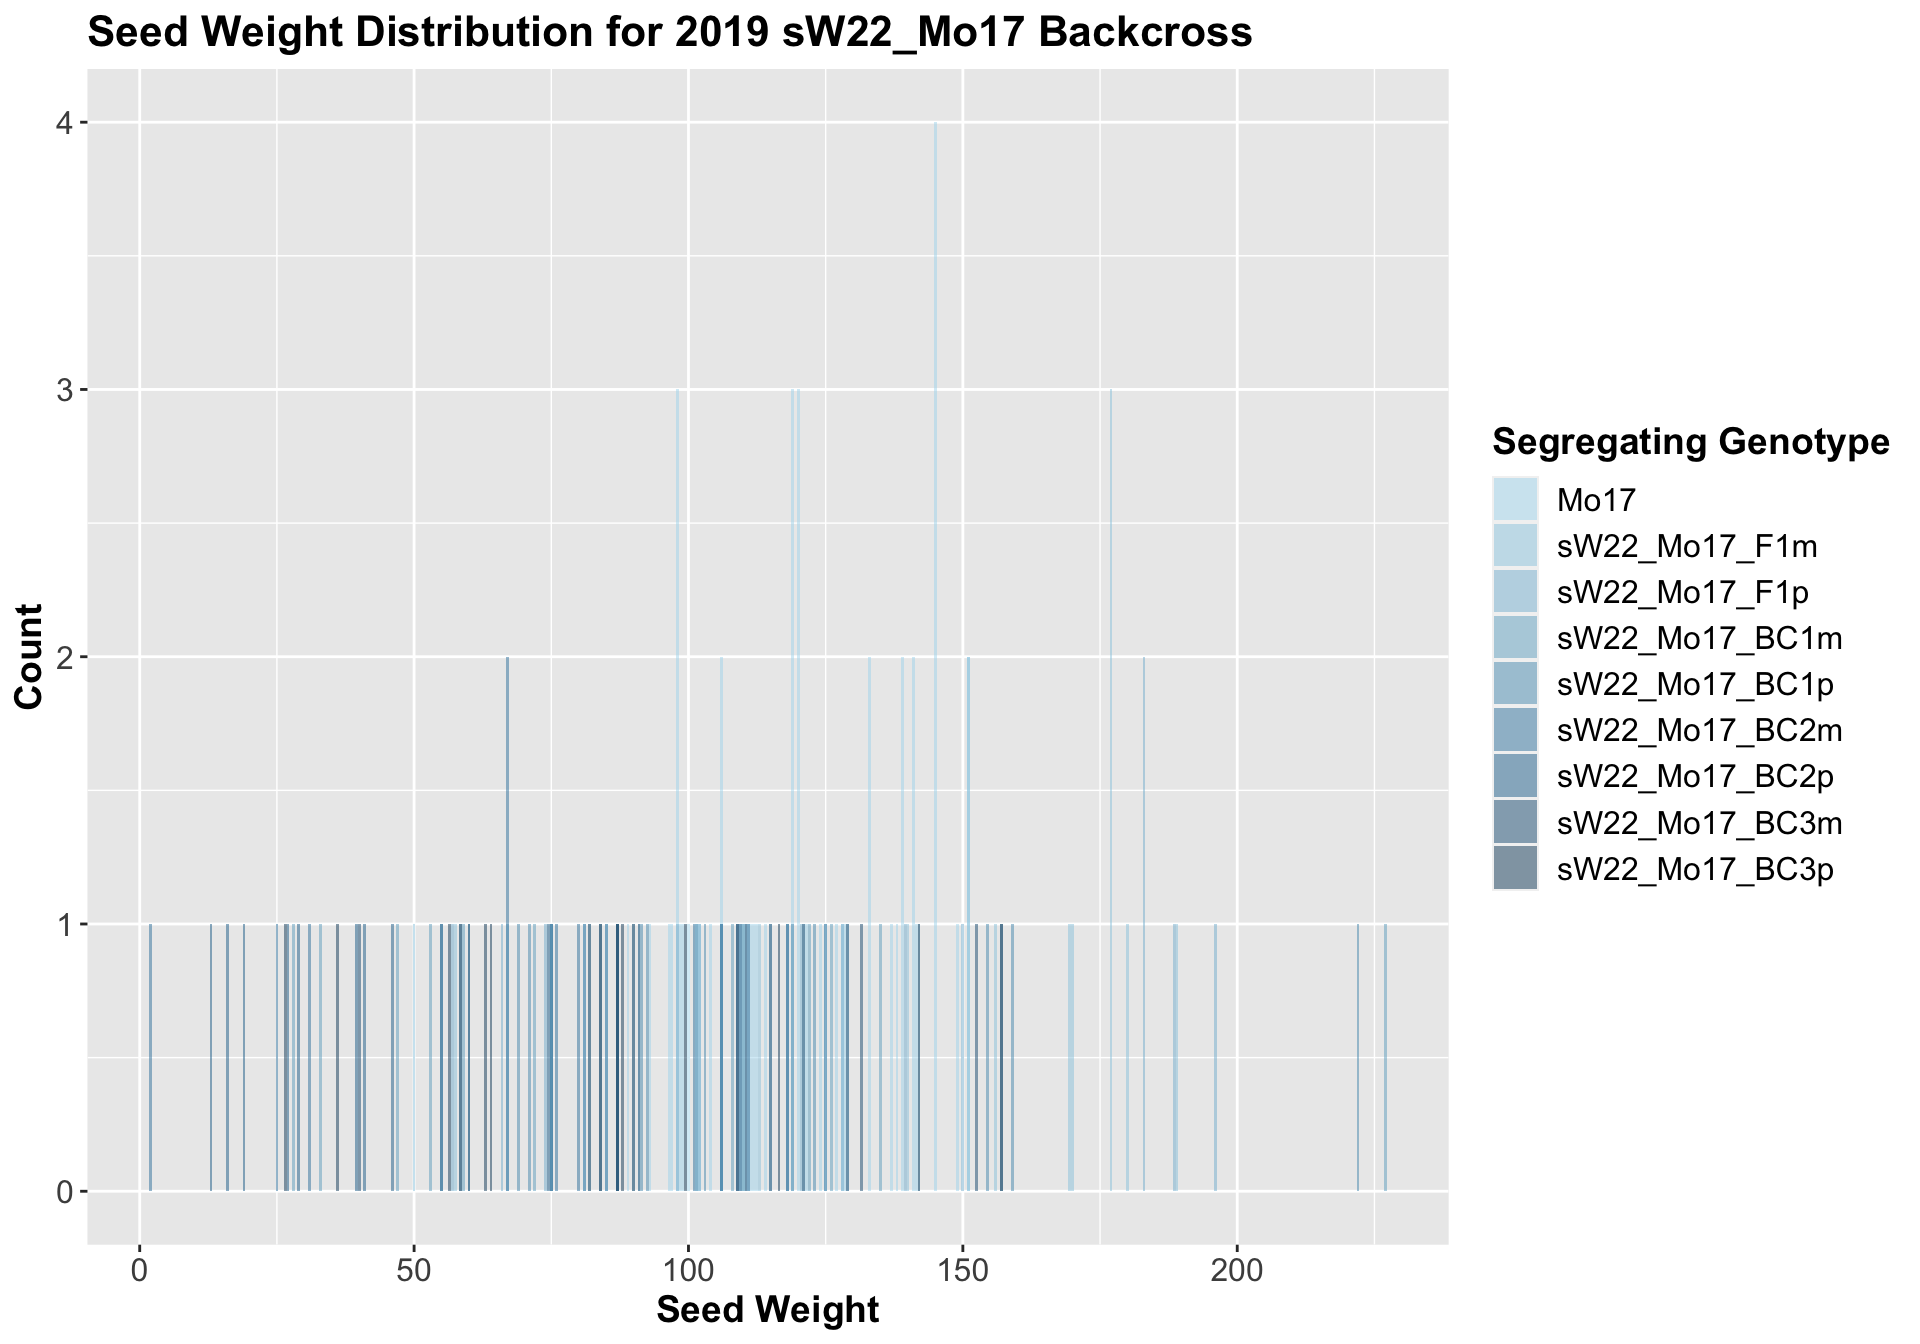
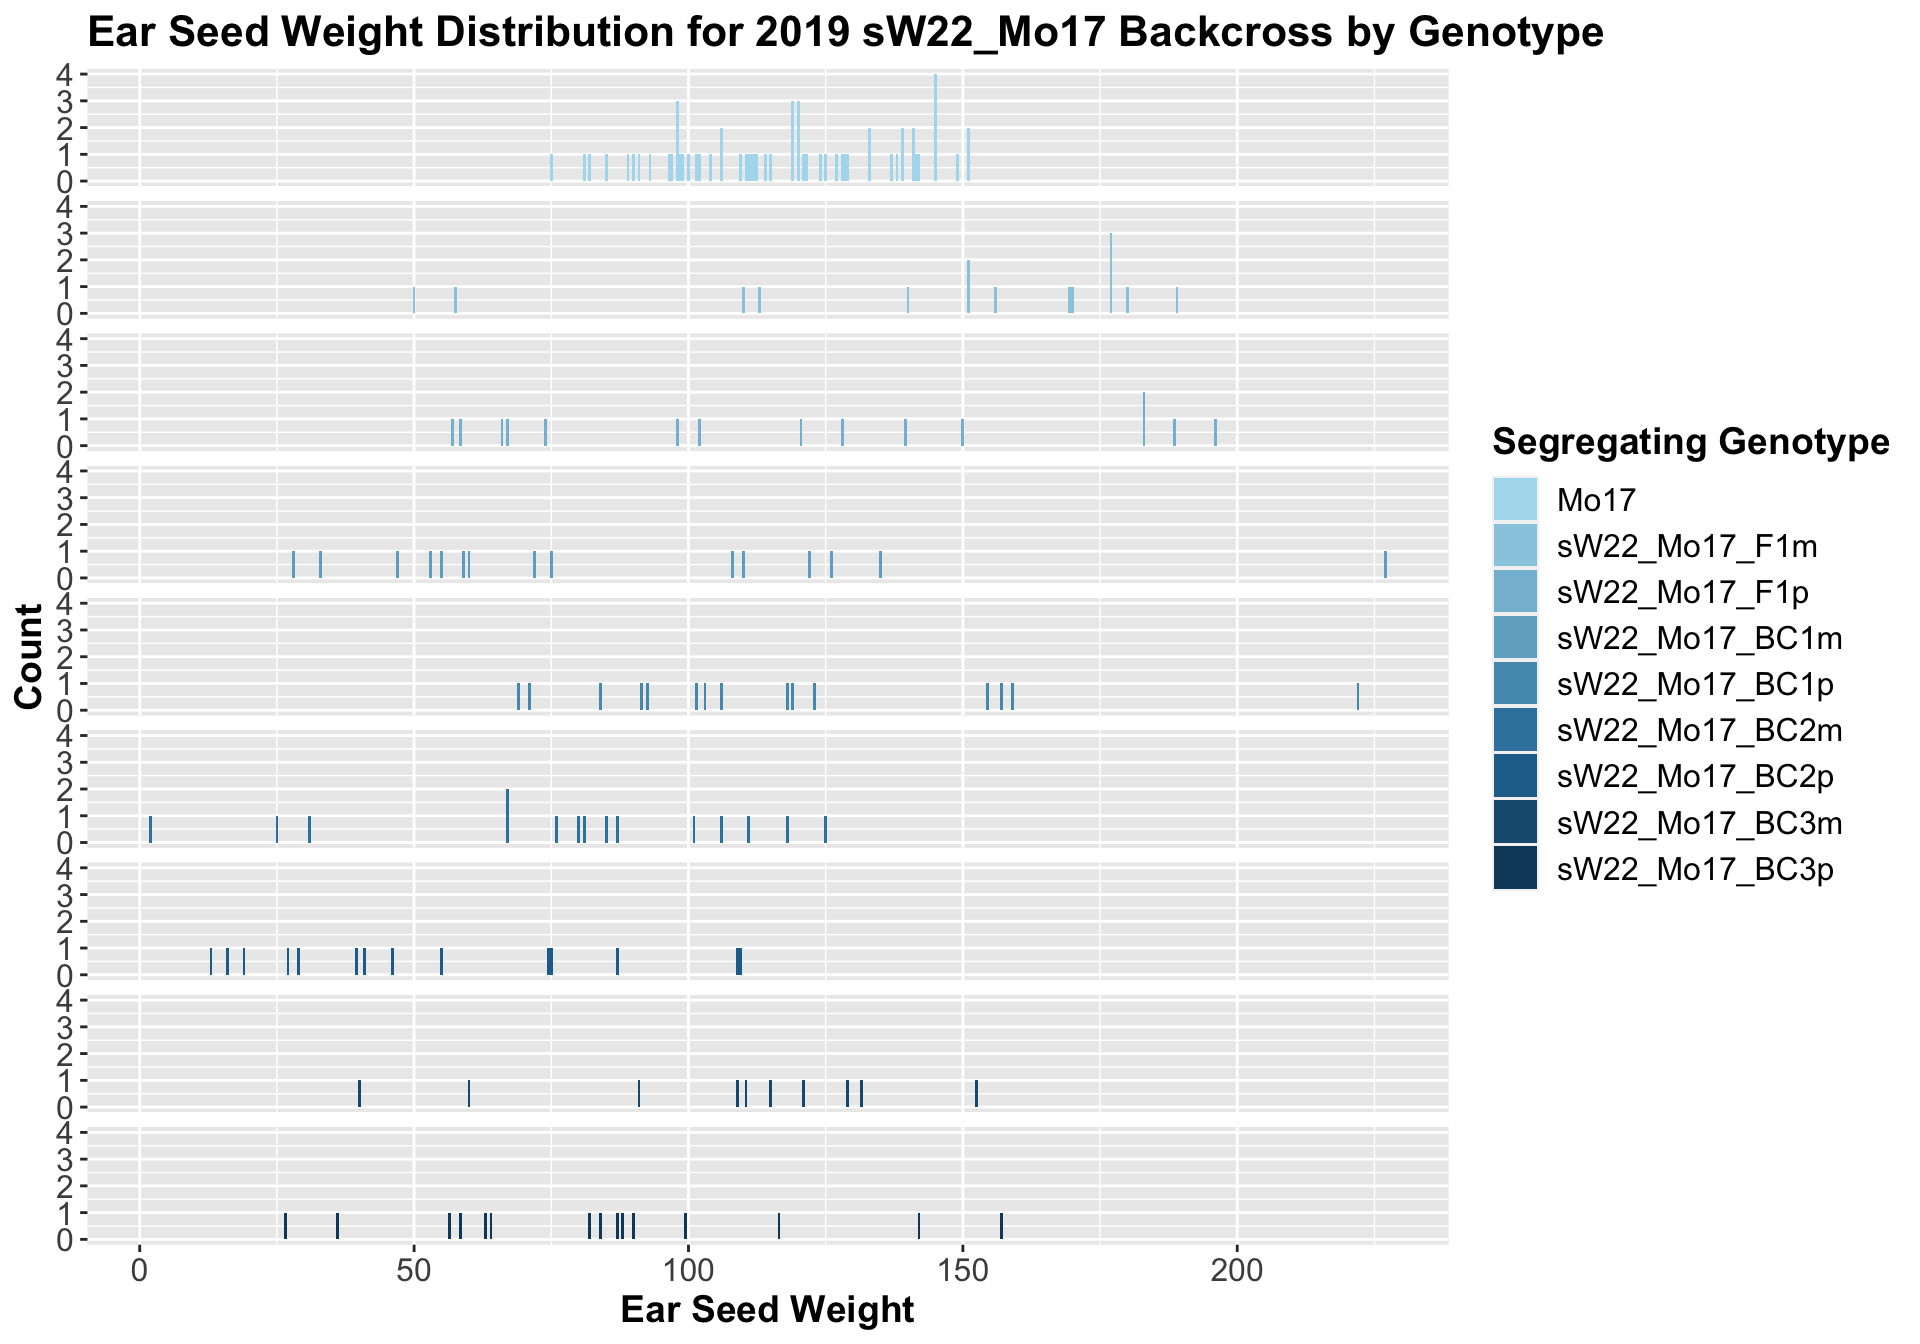
We see an initial increase followed by somewhat of a decline. Oddly, here, we find that the maternal crosses seem to have a higher seed weight than the paternal crosses.

The field data is very similar to the data in aggregate. We see a general trend towards lower seed weight as we keep backcrossing to B73.
We can compare the height data across the W22 backcrossed to Mo17 rows.
##
##  Mean, SD, and SE for each genotype
## Seg_Genotype N mean sd se
## 1 Mo17 60 117.0500 20.12139 2.597660
## 2 W22_Mo17_BC1m 15 170.7333 30.24357 7.808857
## 3 W22_Mo17_BC1p 10 185.0000 21.10819 6.674995
## 4 W22_Mo17_BC2m 15 116.6000 24.97585 6.448736
## 5 W22_Mo17_BC3m 15 136.1667 21.46231 5.541546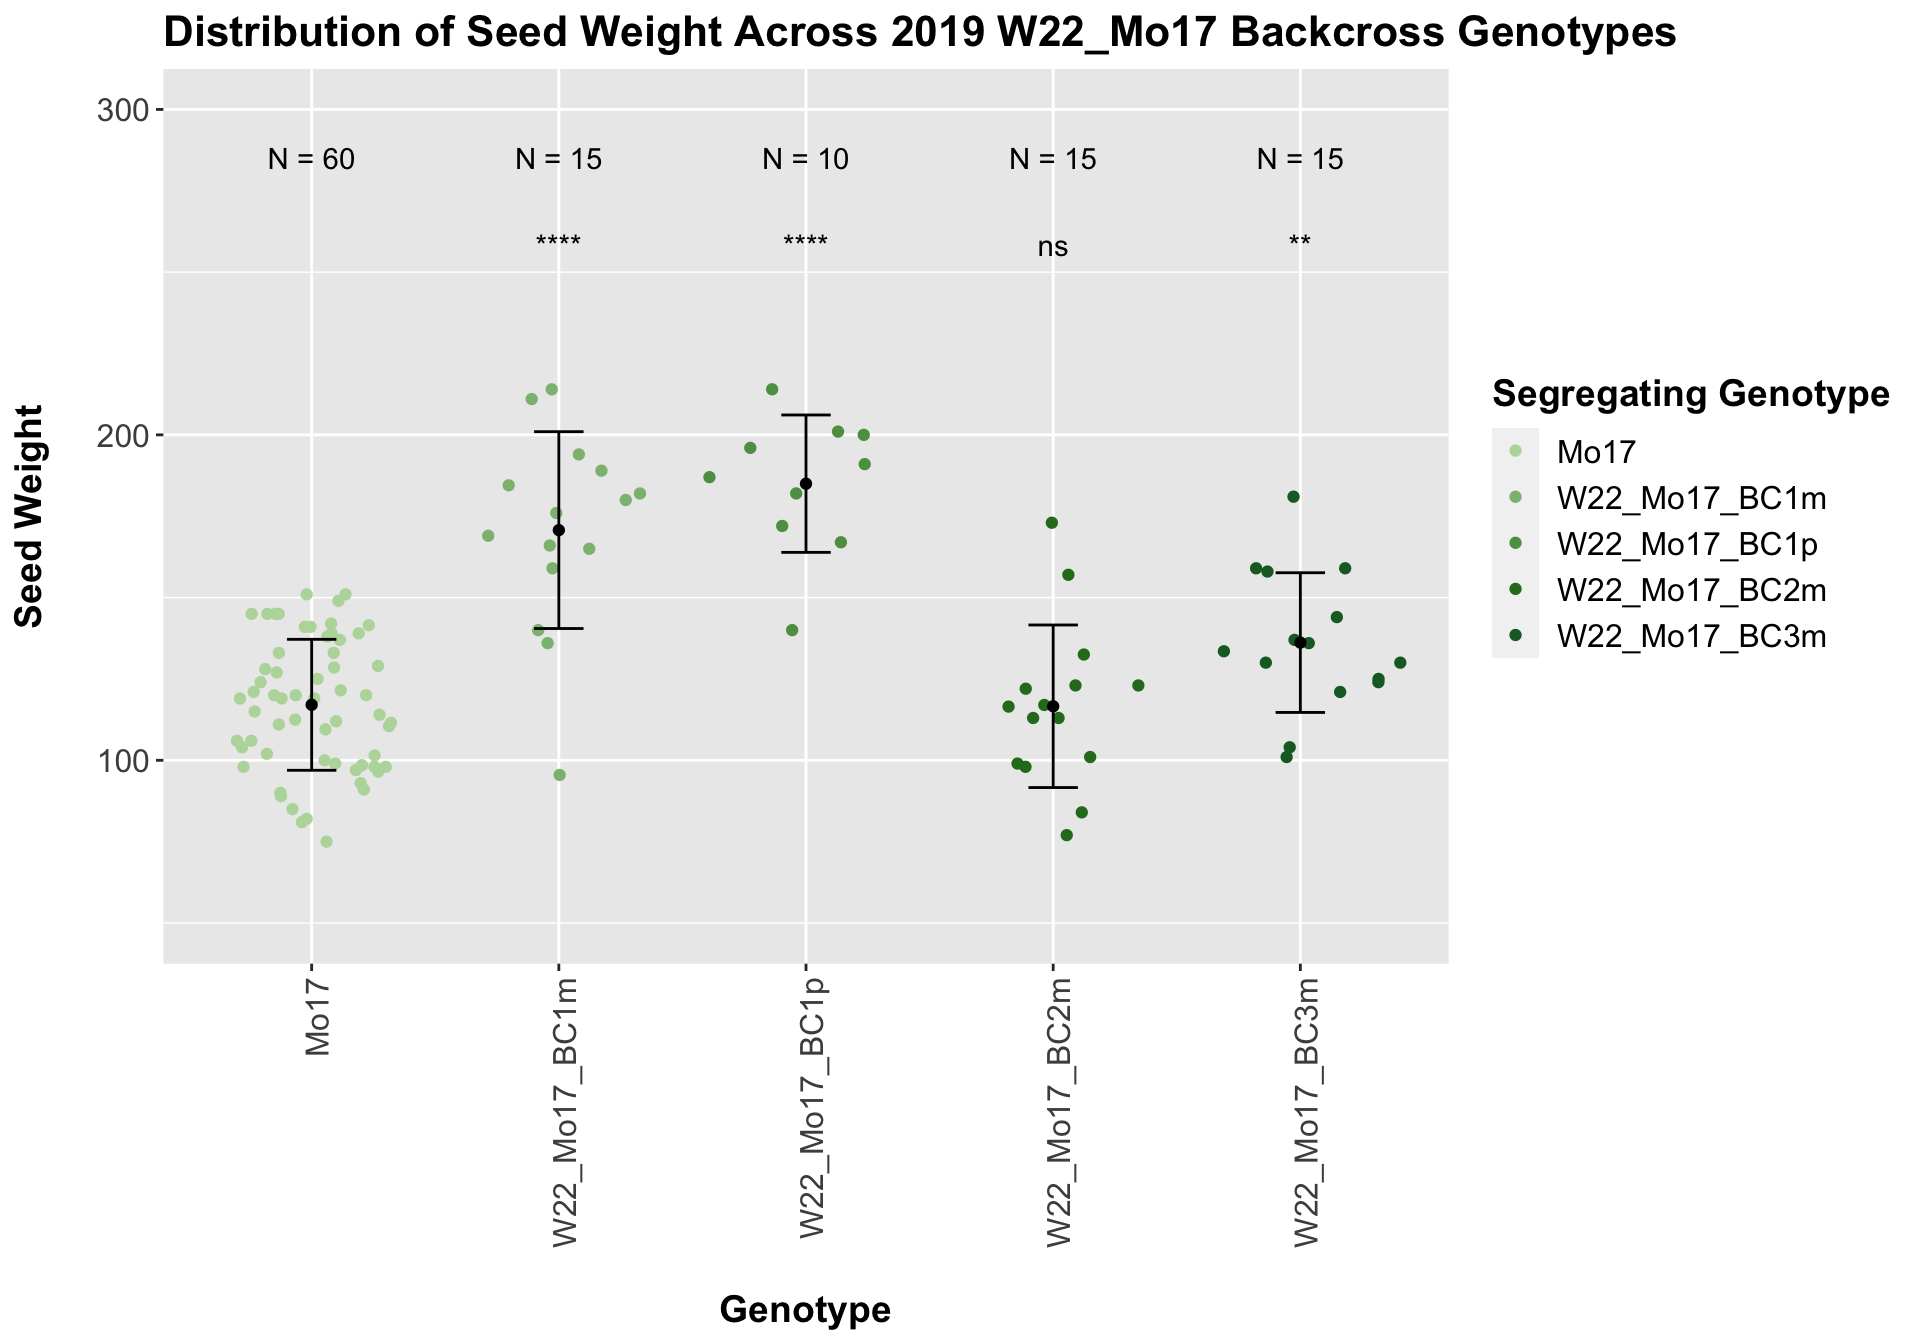
## # A tibble: 4 x 8
##   .y.       group1 group2                  p     p.adj p.format p.signif method
##   <chr>     <chr>  <chr>               <dbl>     <dbl> <chr>    <chr>    <chr>
## 1 Ear_Trait Mo17   W22_Mo17_BC1m 0.00000489  0.000015  4.9e-06  ****     T-test
## 2 Ear_Trait Mo17   W22_Mo17_BC1p 0.000000678 0.0000027 6.8e-07  ****     T-test
## 3 Ear_Trait Mo17   W22_Mo17_BC2m 0.949       0.95      0.9491   ns       T-test
## 4 Ear_Trait Mo17   W22_Mo17_BC3m 0.00522     0.01      0.0052   **       T-test
With the w22_Mo17 backcrosses we see that there is an initial increase in seed weight for the first generation backcross that declines slightly by the second backcross before increasing in weight compared to the Mo17 seed weight. This pattern holds when we stratify the data by field.
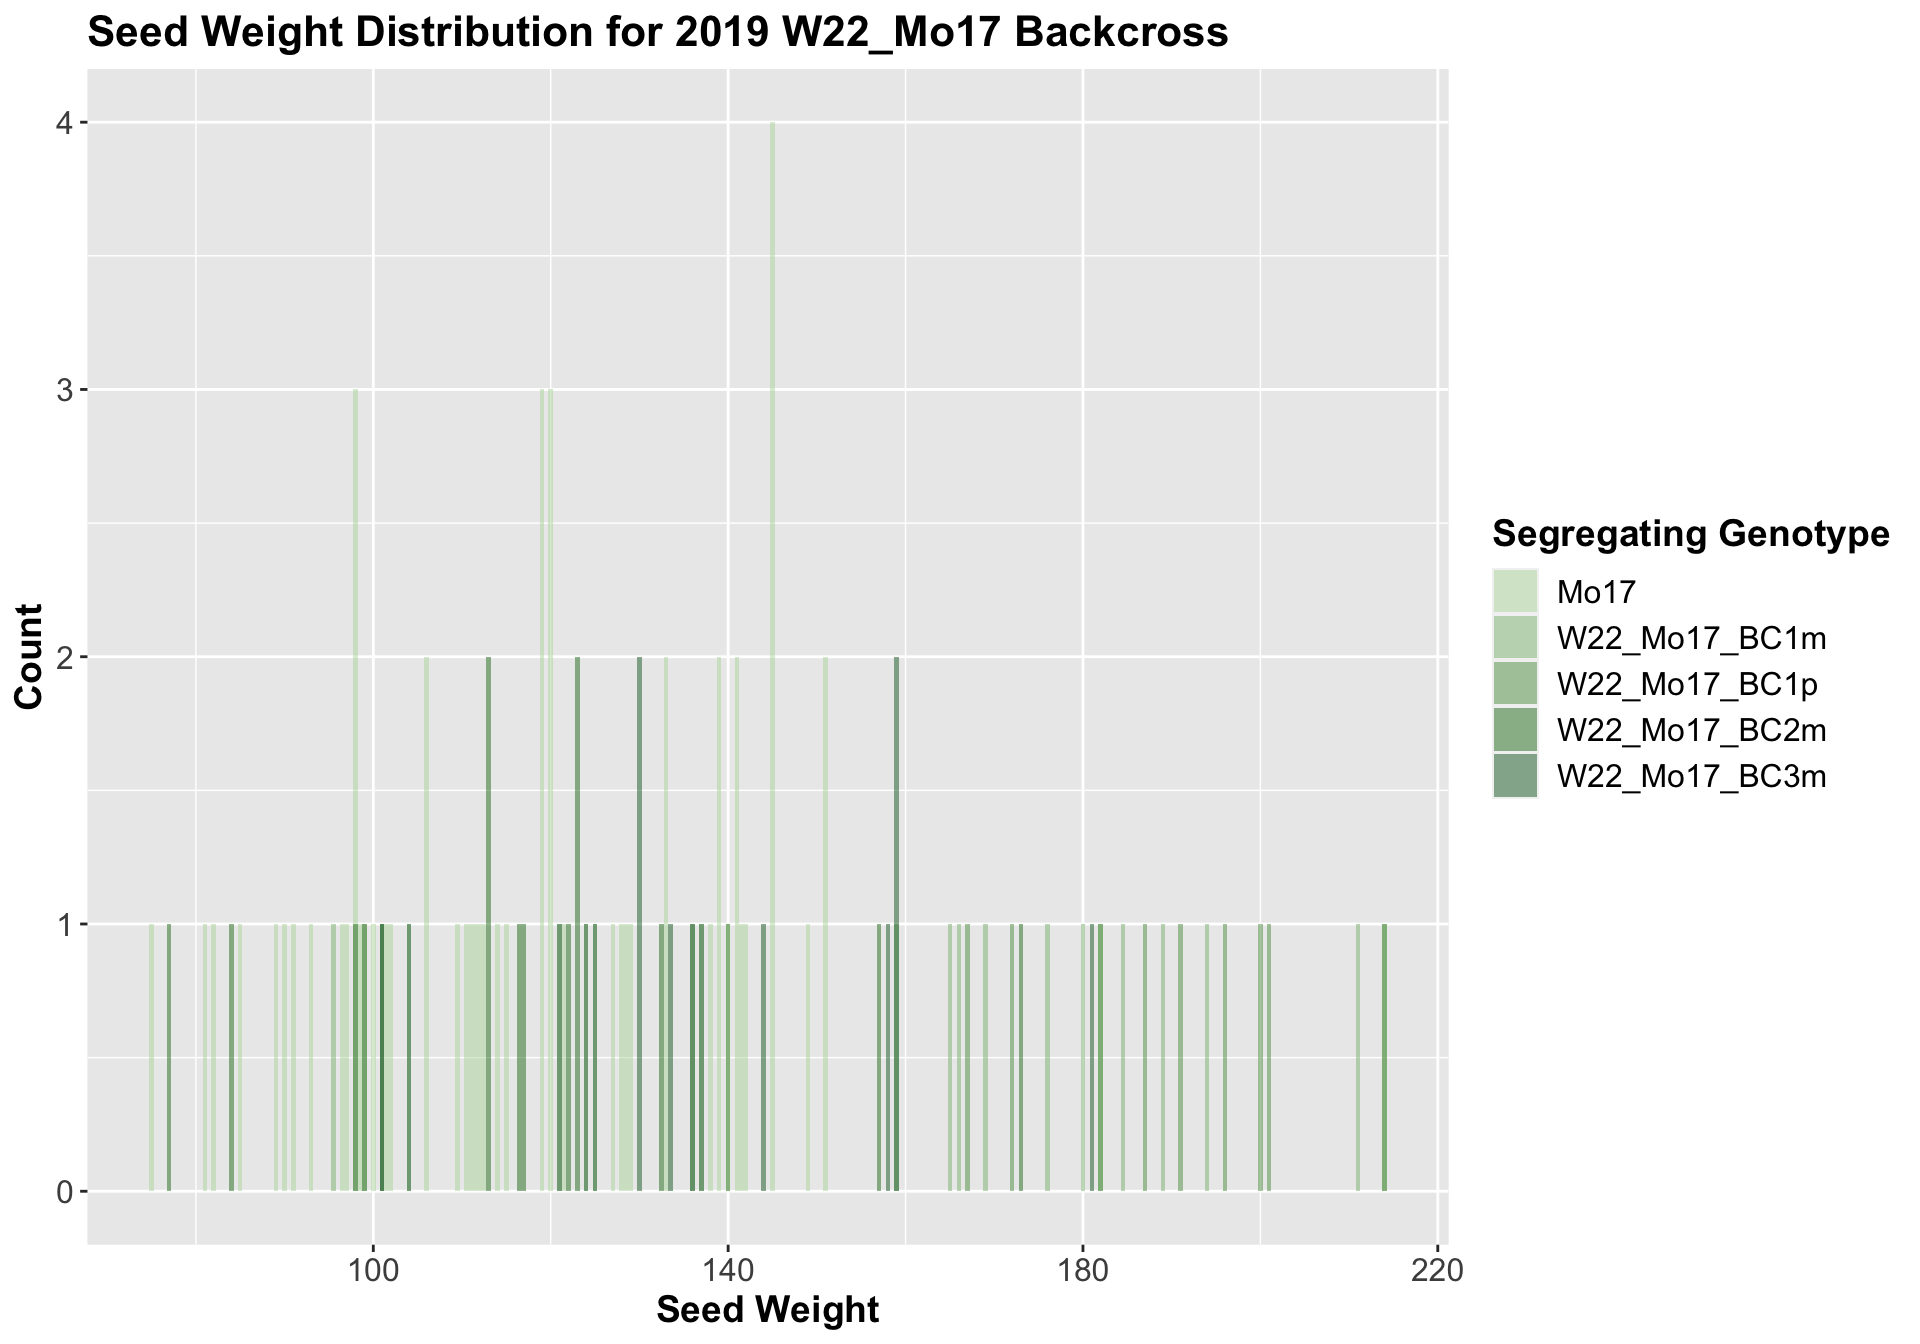
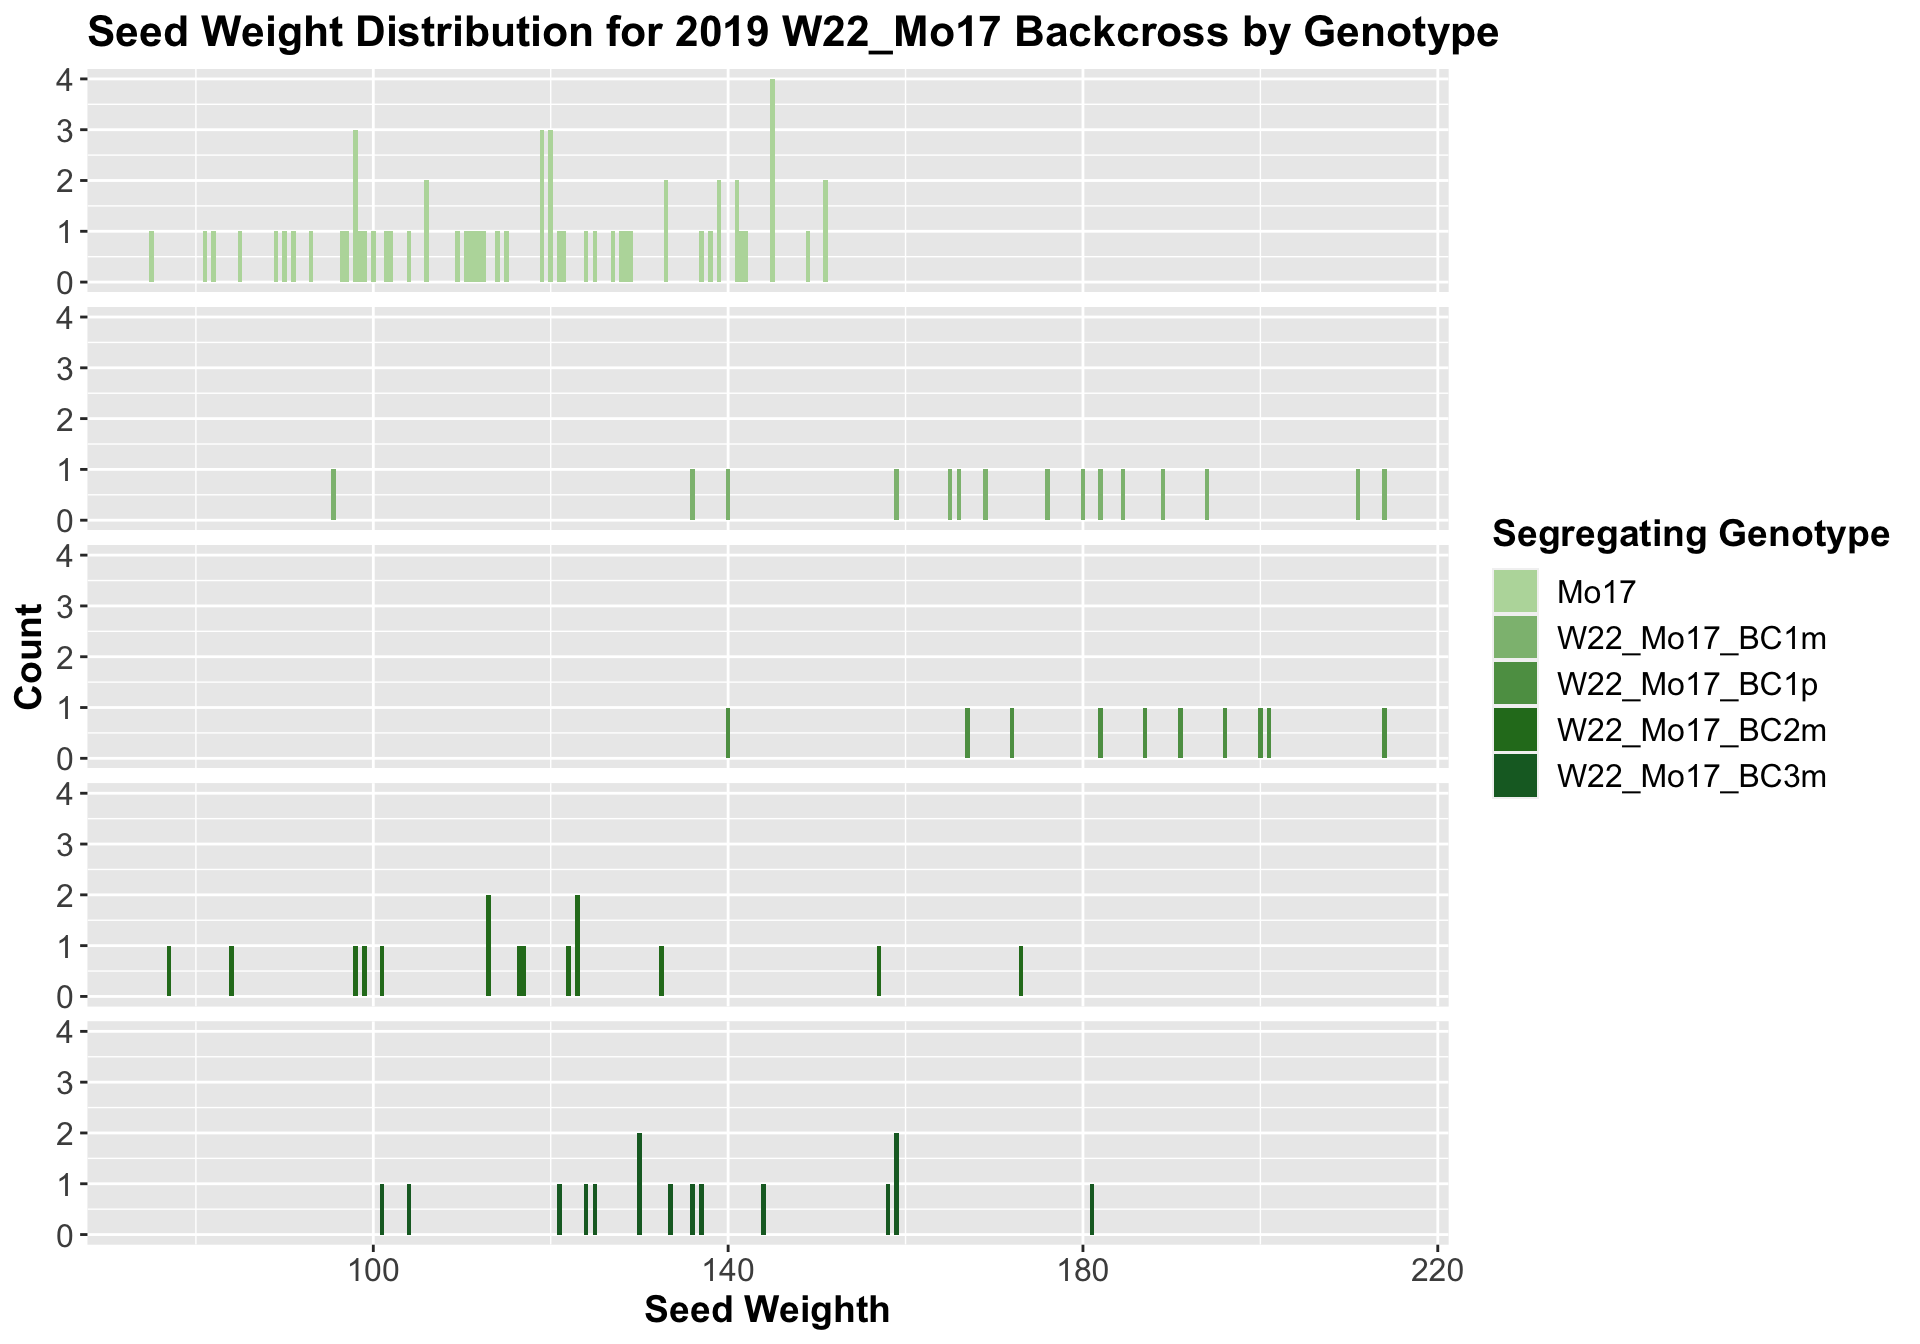
We now compare the distribution for sW22_Mo17 backcrosses to W22_Mo17 backcrosses and how each generaiton compares across these two sets. Note: when looking at these plots, just be aware that the genotypes don't align perfectly across backcrosses because we don't have a few crosses for the W22_Mo17 genotypes.

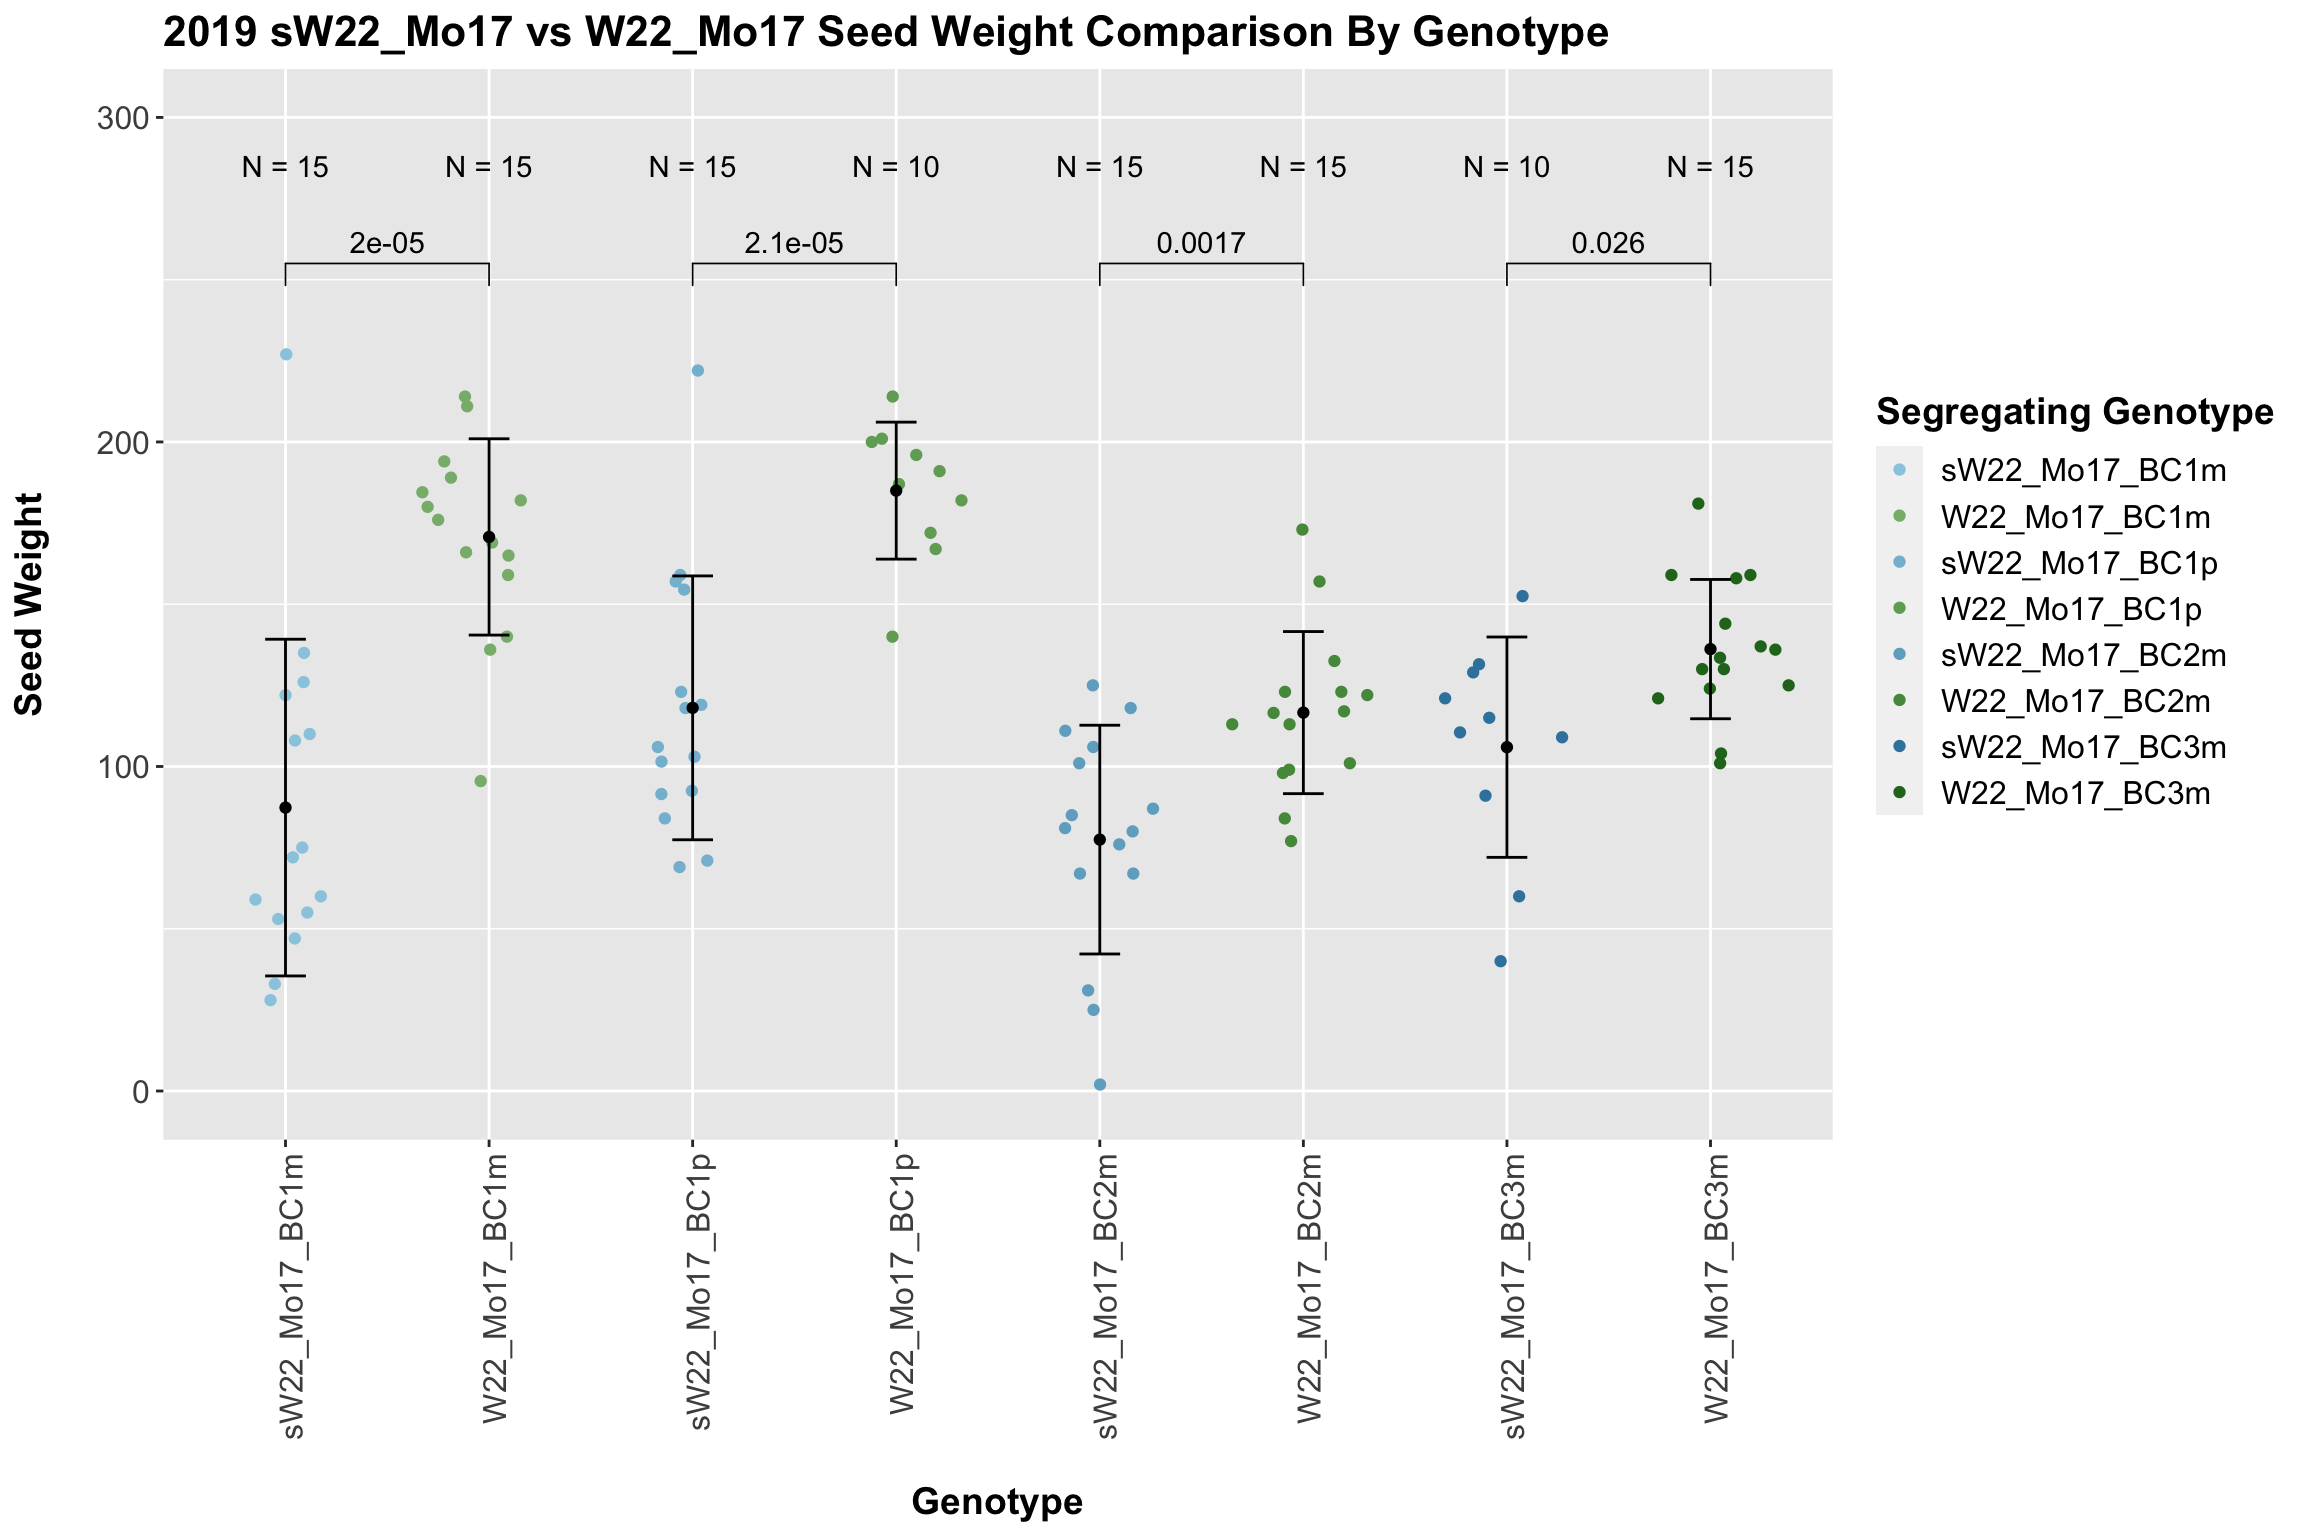

We find that there is a significant reduction in seed weight for the sW22_Mo17 backcrosses compared to the W22_Mo17 backcrosses.
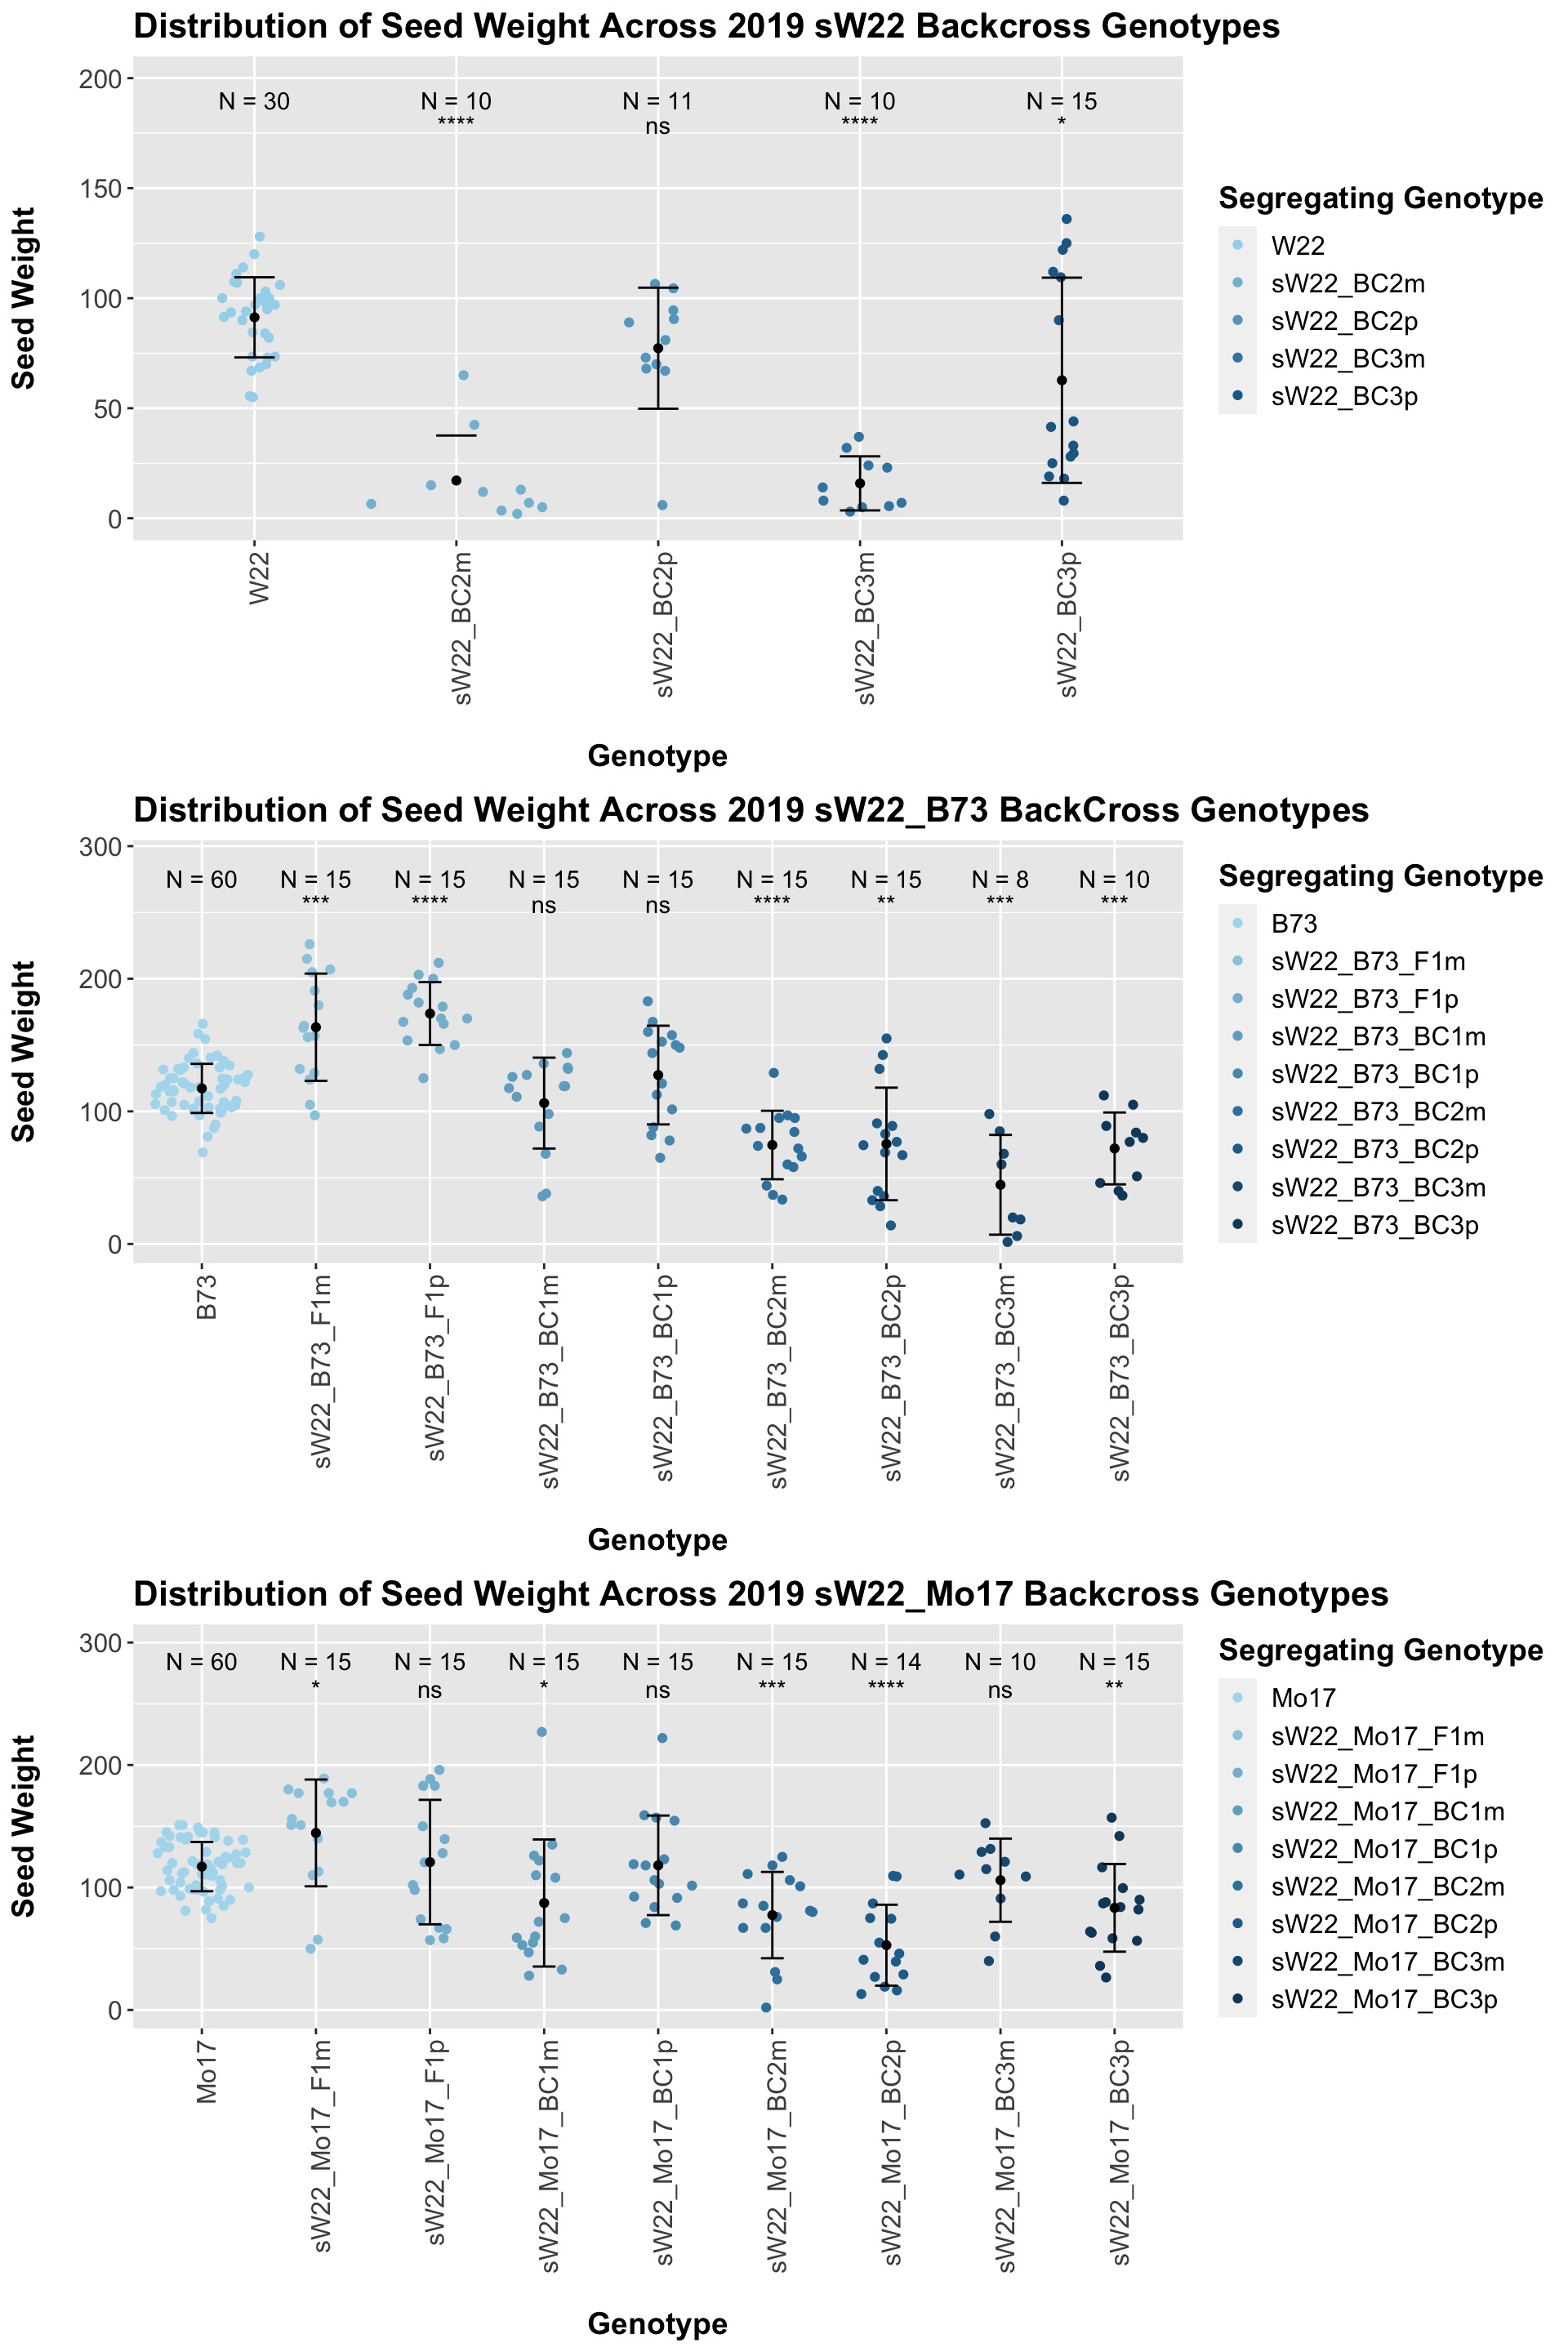
We may also compare the distribution for all sW22 backcrosses (crossed to W22, B73, and Mo17 respectively). Note: when looking at these plots, just be aware that the genotypes don't align perfectly across backcrosses so be sure to check the x-axis.
6.1.4 2019 ANOVA for Seed Weight
We now want to test whether (1) seed weight is impacted by the sex of the sick parent and (2) the means across each backcross generation change NOTE: I was not fully confident in how/whether to incorporate the external stock information (W22, B73,Mo17) as these lineages were selfed and therefore had no sick parent to test the sex of. We also transformed the categorical genotype values (F1,BC1,BC2,BC3,BC4,BC5) to numerical values (0,1,2,3,4,5).NOTE: I'm not sure if this is appropriate. It'd be fairly simple to switch this back to categorical values if that would be better
We start by fitting a series of linear models:
- mod_full_int: Seed_Weight (Numerical) ~ Field (Cateogrical) + Genotype (Numerical) + Sick_Sex (Categorical) + Genotype*Sick_Sex
- mod_full: Seed_Weight (Numerical) ~ Field (Categorical) + Genotype (Numerical) + Sick_Sex (Categorical)
- mod_geno: Seed_Weight (Numerical) ~ Field (Cateogrical) + Genotype (Numerical)
- mod_sex: Seed_Weight (Numerical) ~ Field + Sick_Sex (Categorical)
We can then compare the fit of these models to our data using an ANOVA to test whether the more complex model (mod_full) is significantly better at capturing our height data than either of our simpler models. This will tell us whether incorporating sex/genotype significantly improves our model.
We can summarize the results of this across each set of genotypes. The significance codes are as follows:
- '***' - between 0 and 0.001
- '**' - between 0.001 and 0.01
- '*' - between 0.01 and 0.05
- '.' - between 0.05 and 0.1
- ' ' - between 0.1 and 1
##    Geno_Set   Sex_PValue Sex_Signif Genotype_PValue Genotype_Signif
## 1  sW22_W22 1.901675e-06        ***    2.798053e-01
## 2  sW22_B73 3.530956e-02          *    3.428674e-23             ***
## 3 sW22_Mo17 3.958193e-01               5.531168e-05             ***
## 4   W22_B73 2.609349e-01               1.733182e-09             ***
## 5  W22_Mo17 2.145169e-02          *    2.390686e-03              **
##   Sex_Geno_Int_PValue Sex_Geno_Int_Signif
## 1           0.4022990
## 2           0.7063123
## 3           0.7436325
## 4           0.1516075
## 5                  NA
Here, we find out that that for all lineages, except for sW22_22, show a significant influence of segregating genotype. We also find a significant influence of the sex of the sick parent on the sW22, sW22_B73, and W22_Mo17 lineage on seed weight.