Chapter 8 100K and Estimated Seed Number
8.1 2019 100K Data
NOTE
In previous sections, the code I use to analyze our data includes t-tests to compare the means between the backcrosses and the line they are crossed to. I do not include this code in this section. Several of the lines have very few data points, which makes a statistical test to call significance suspect in my opinion. I also do not separte this data by field, once again due to the low number of data points. It's just not informative.
Consequently, I am just plotting sina plots showing the distribution of these data points without any statistical analysis. I can incorporate more plots or a statistical analysis back if folks think that would be helpful to see.
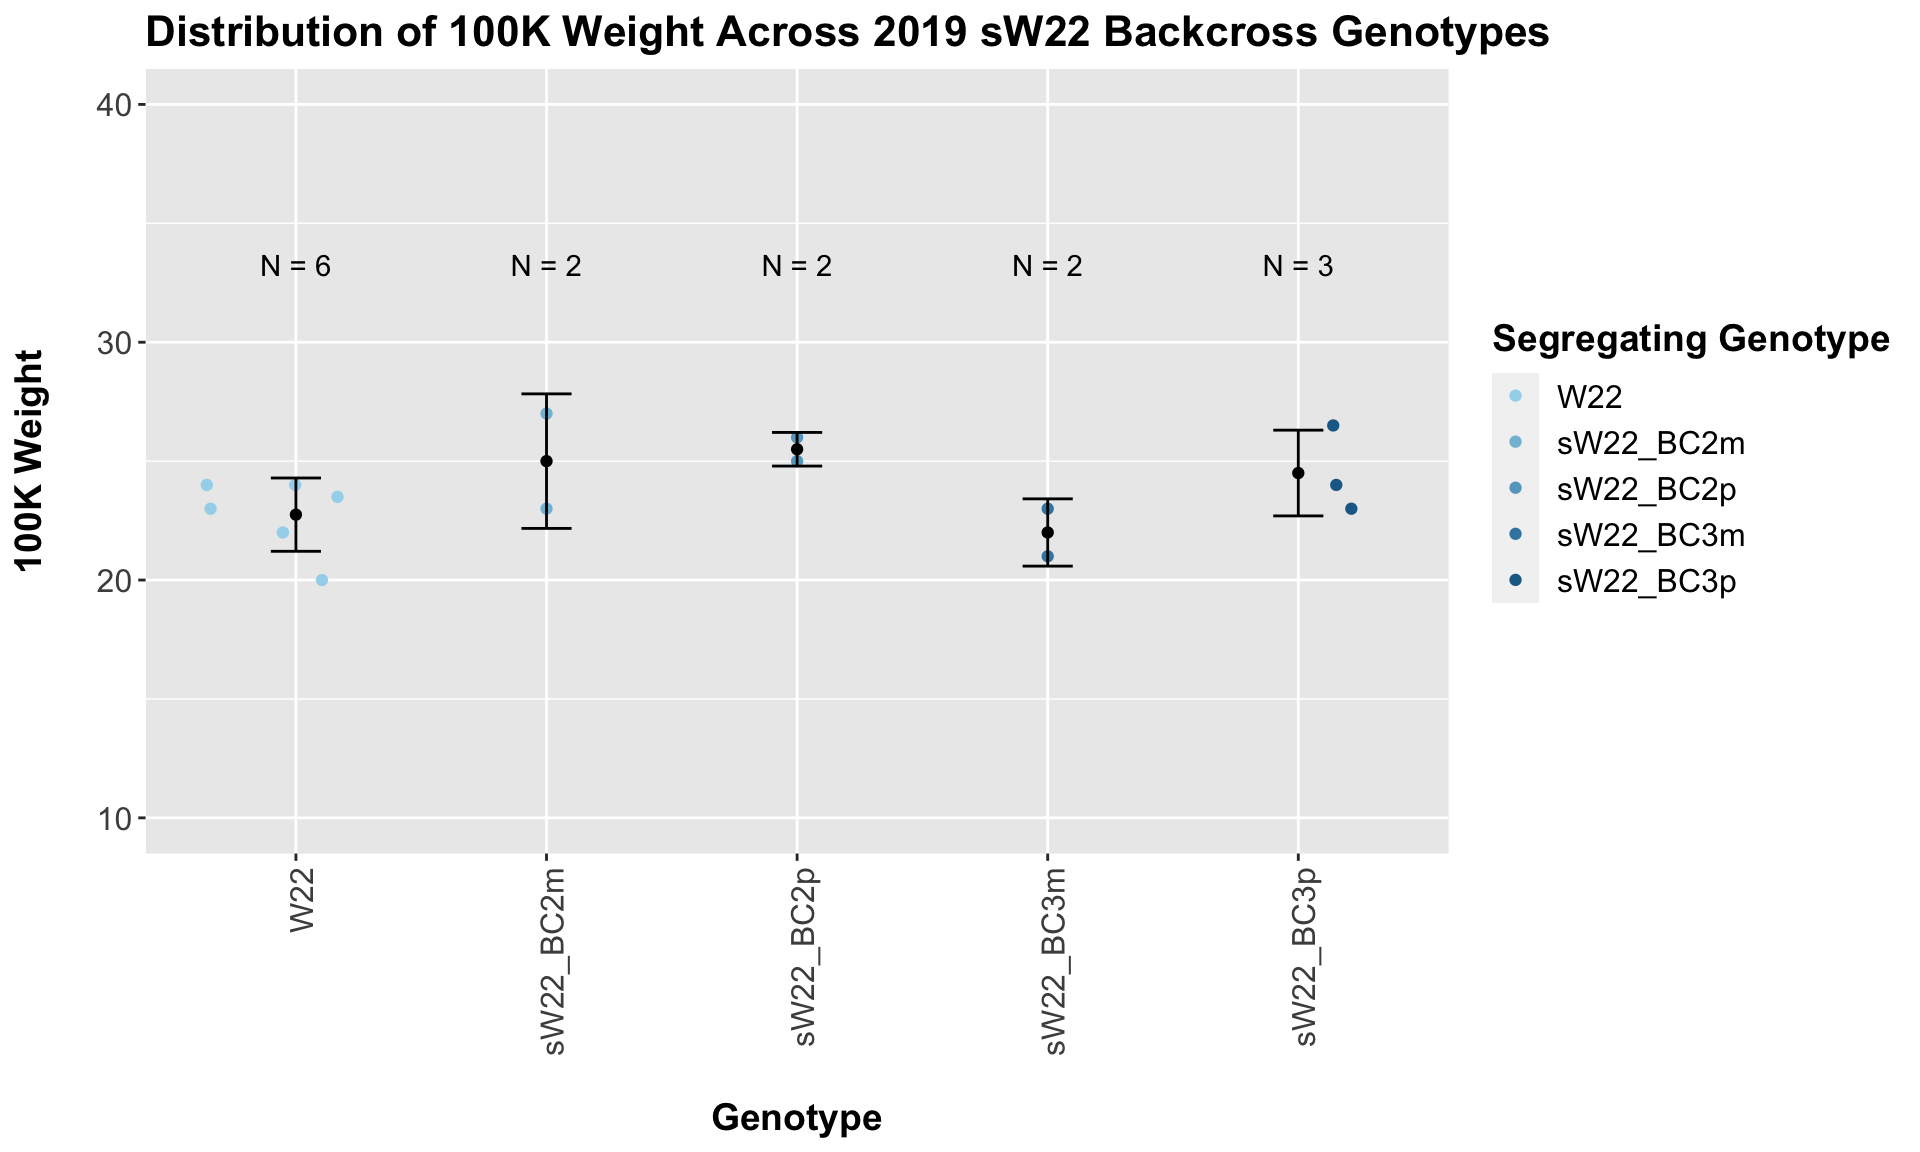
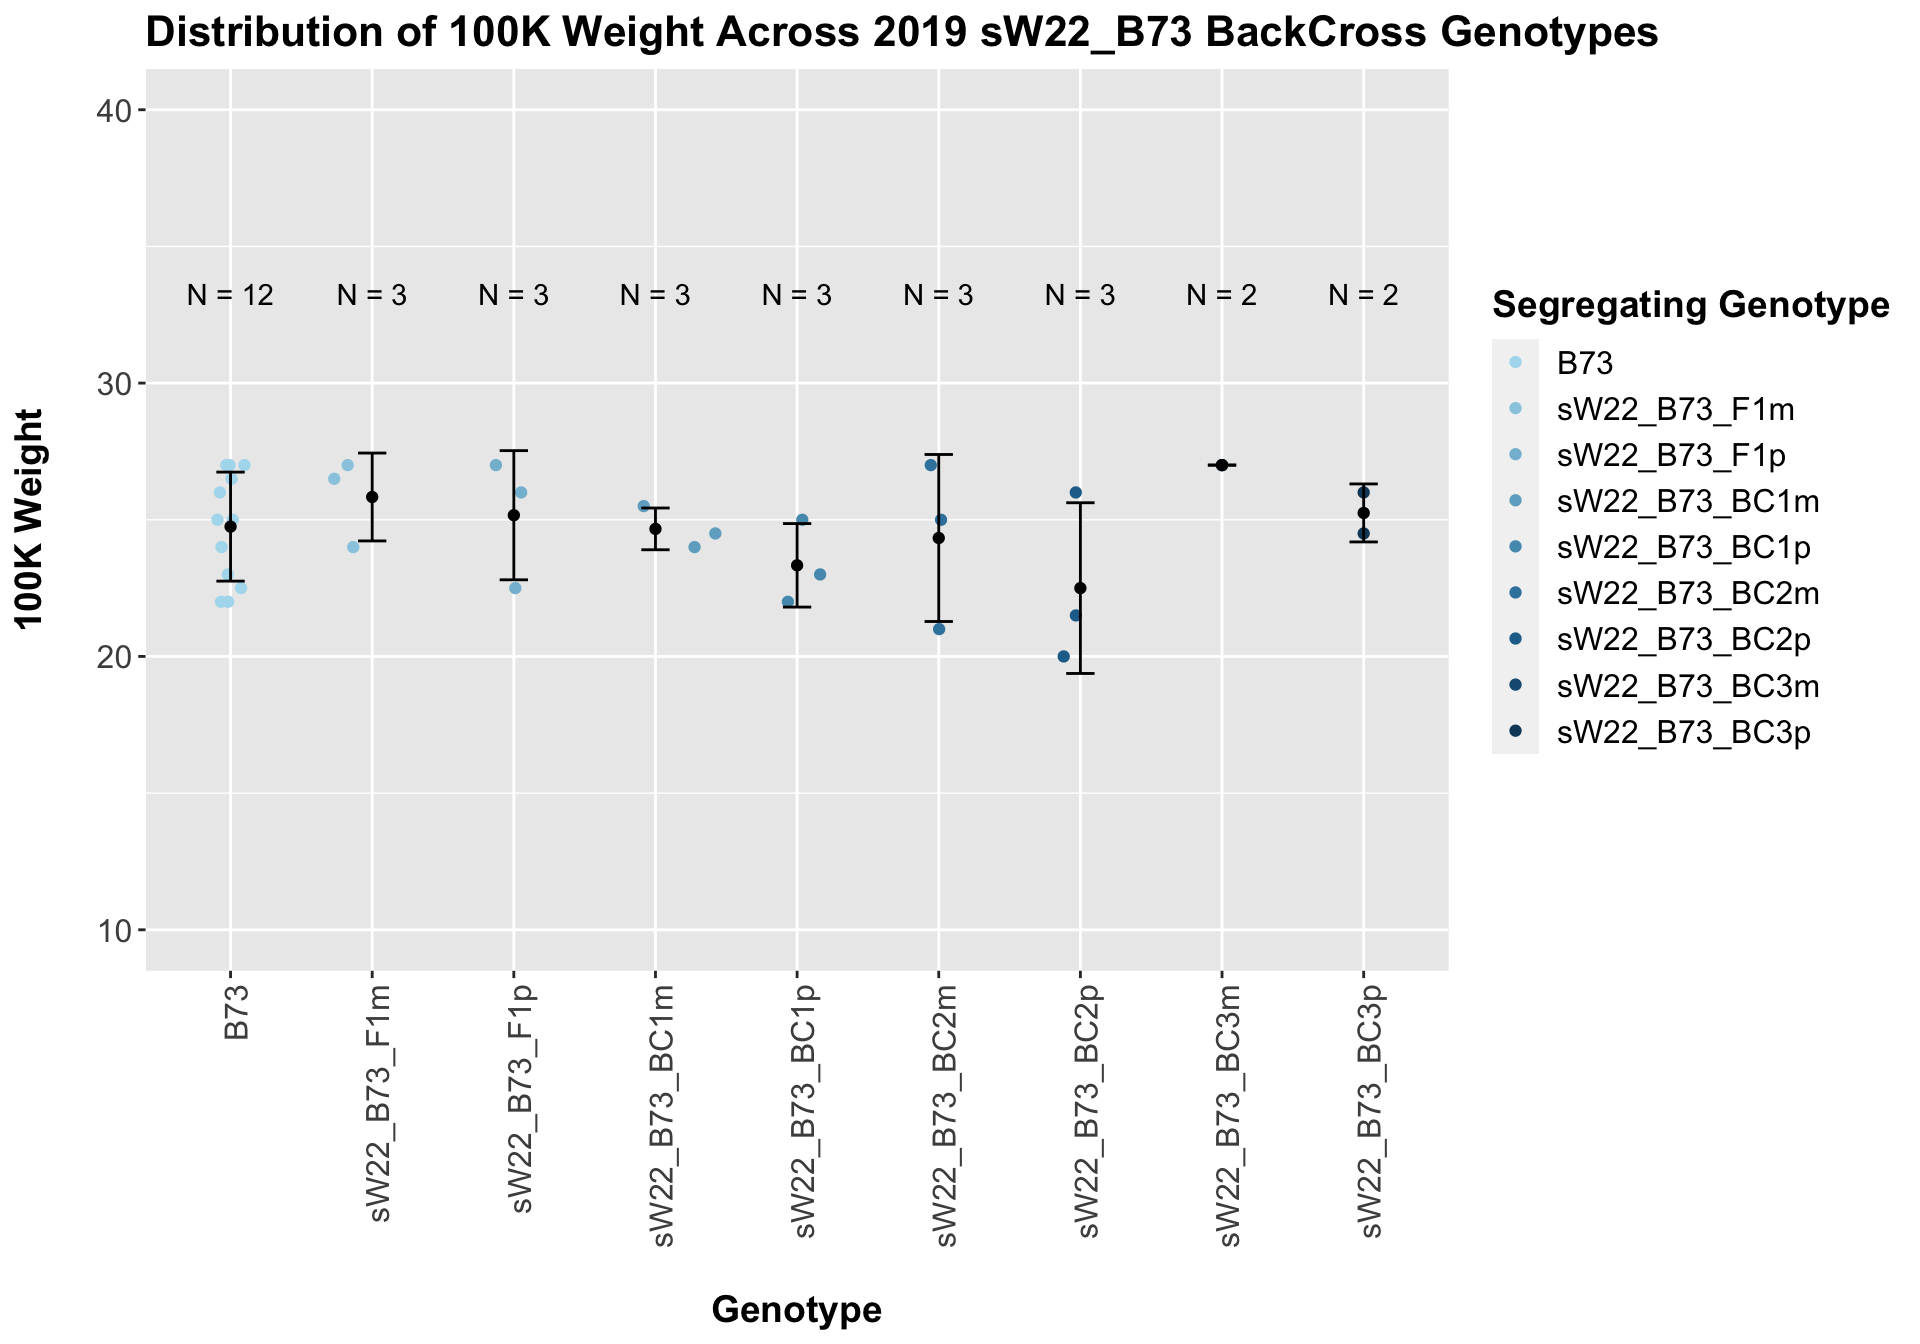
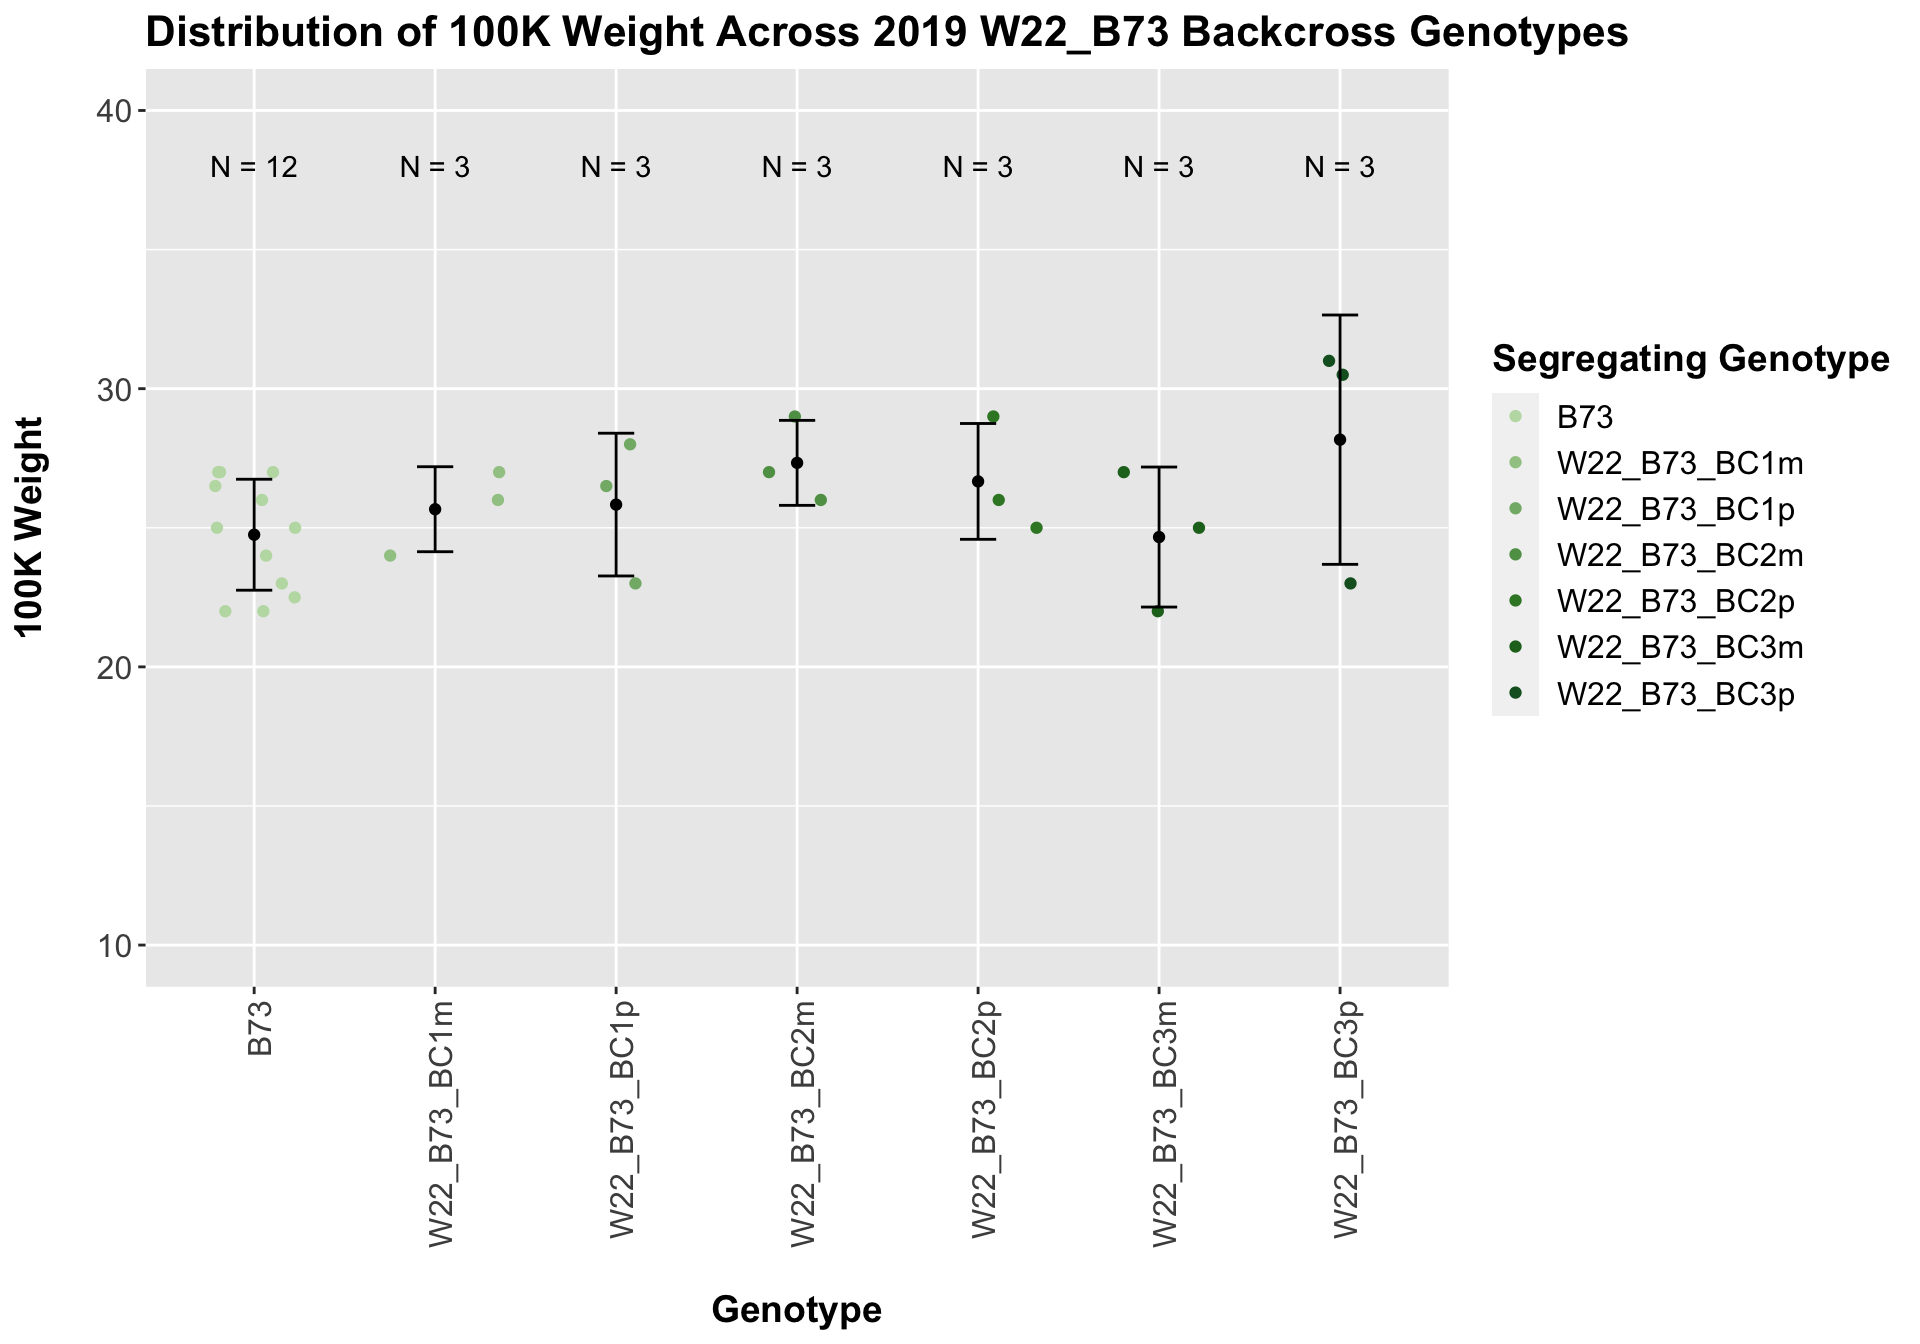
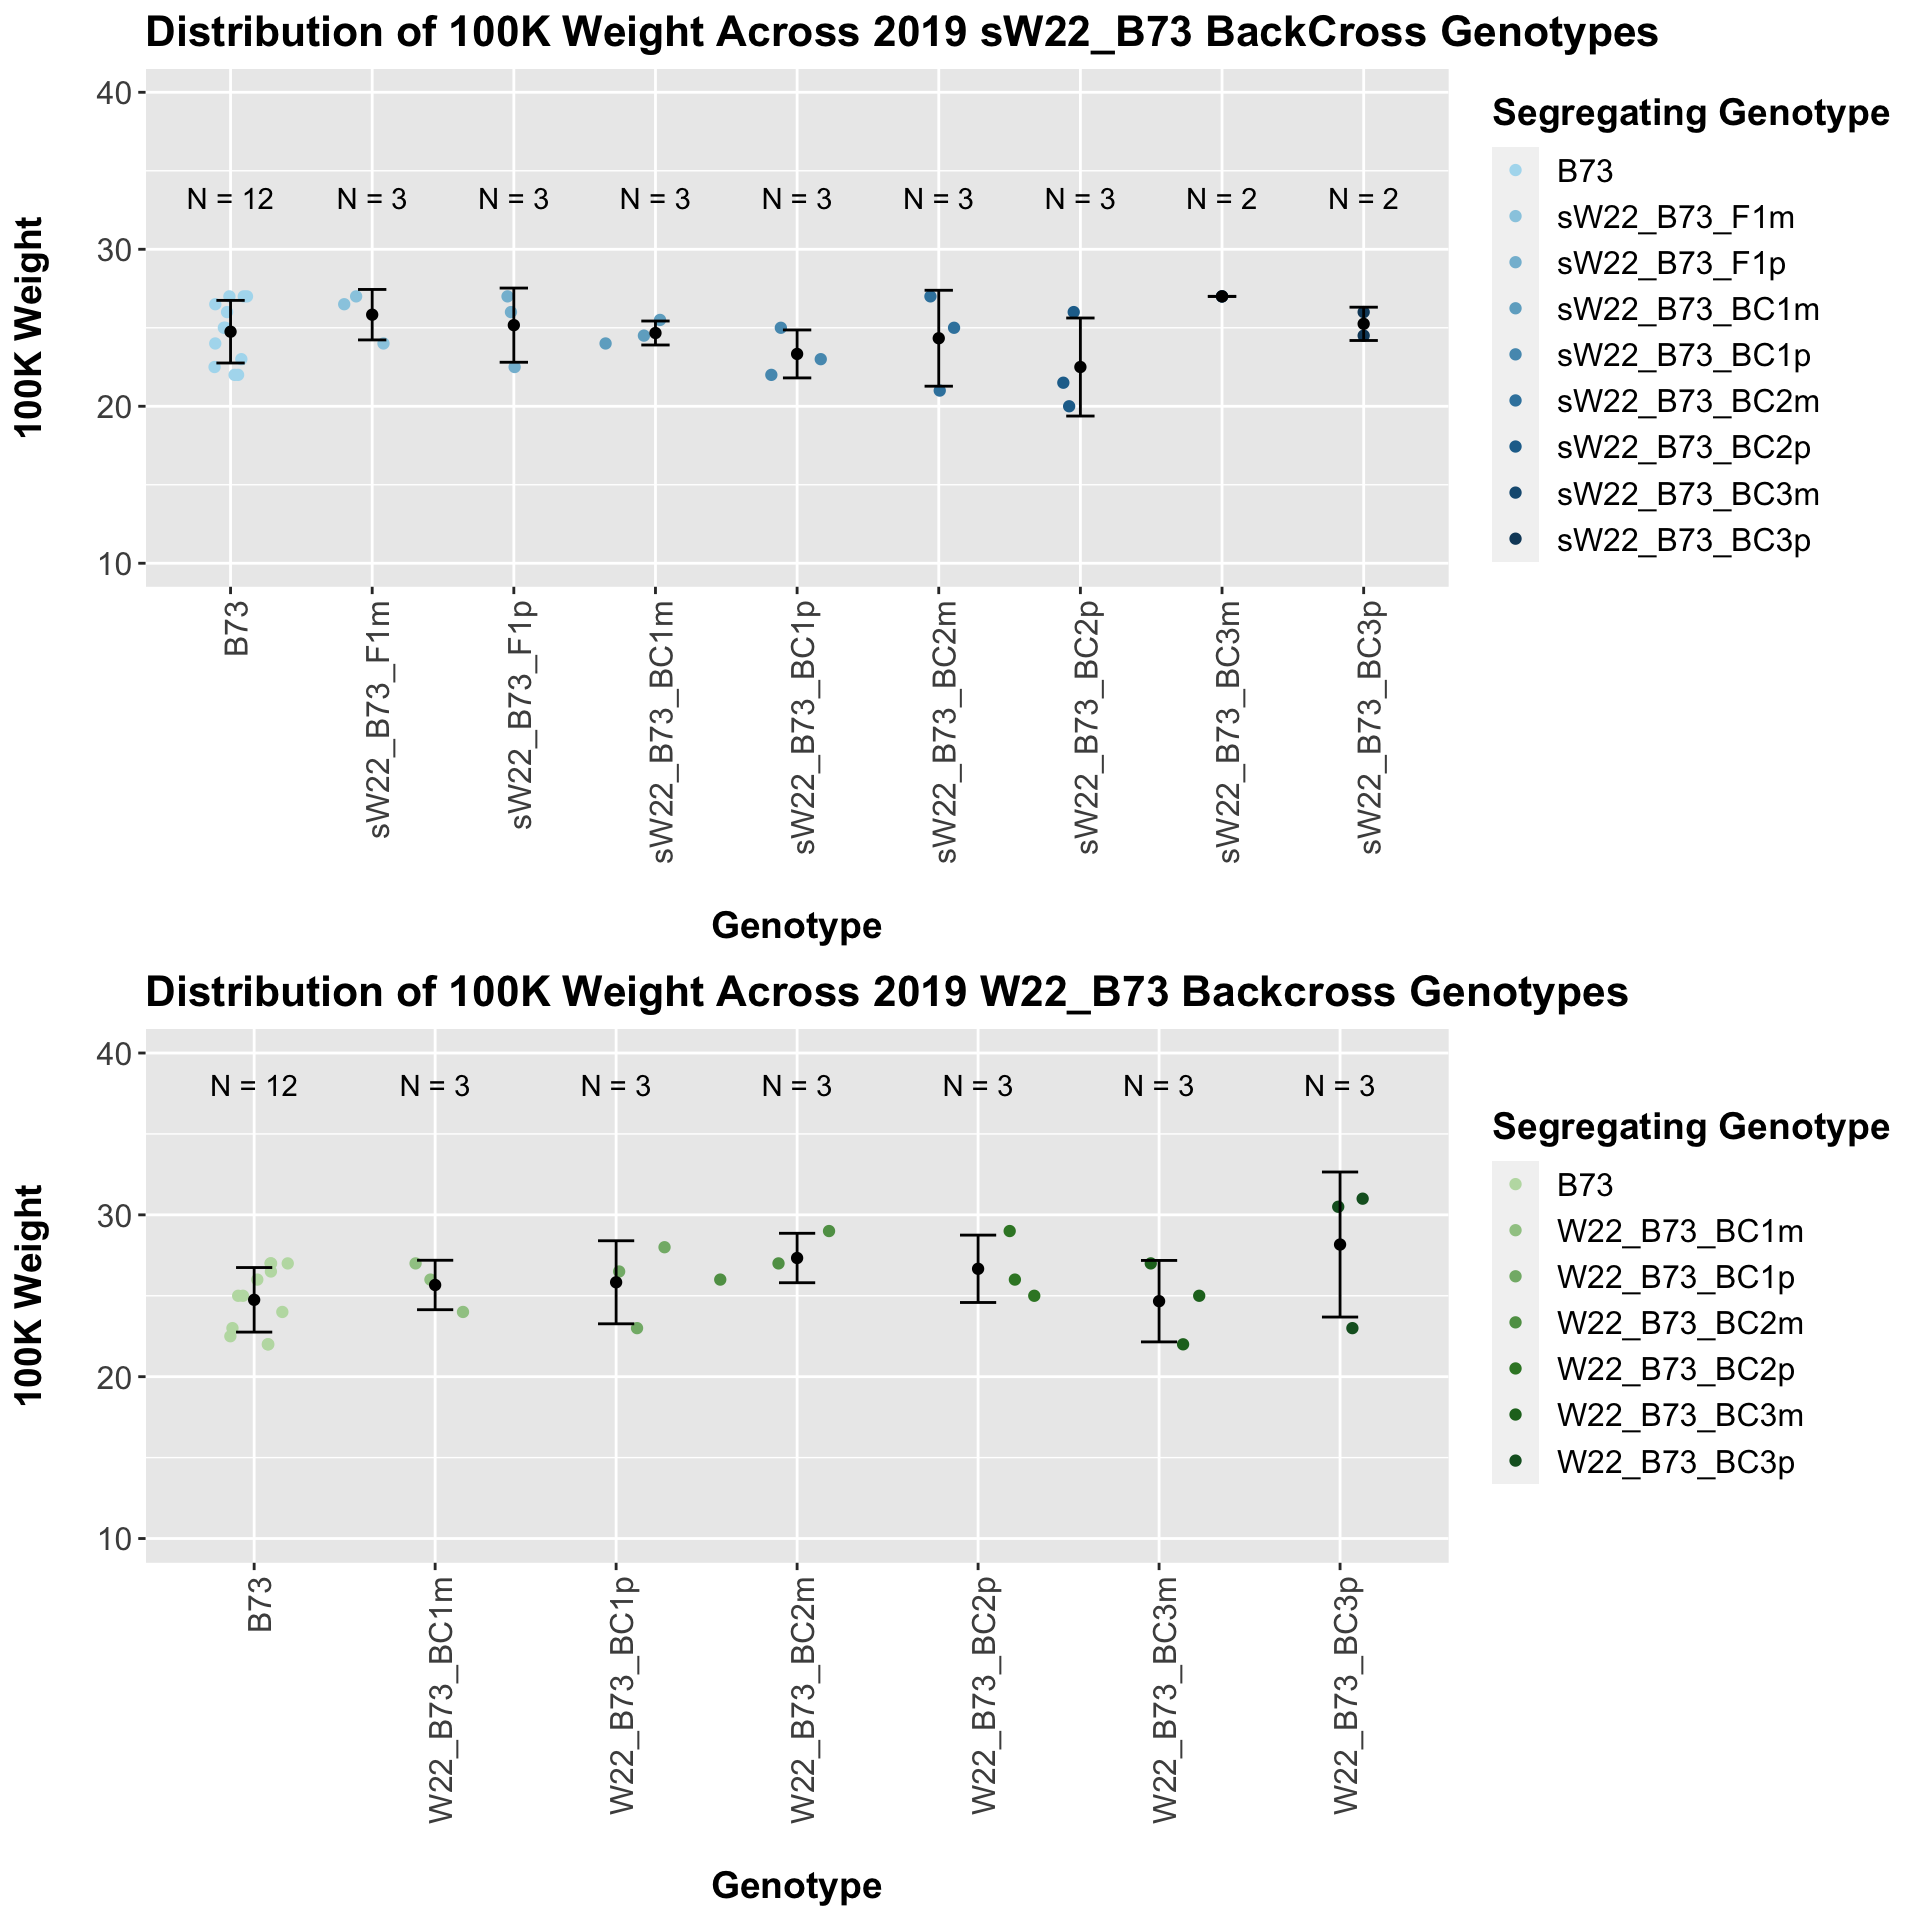
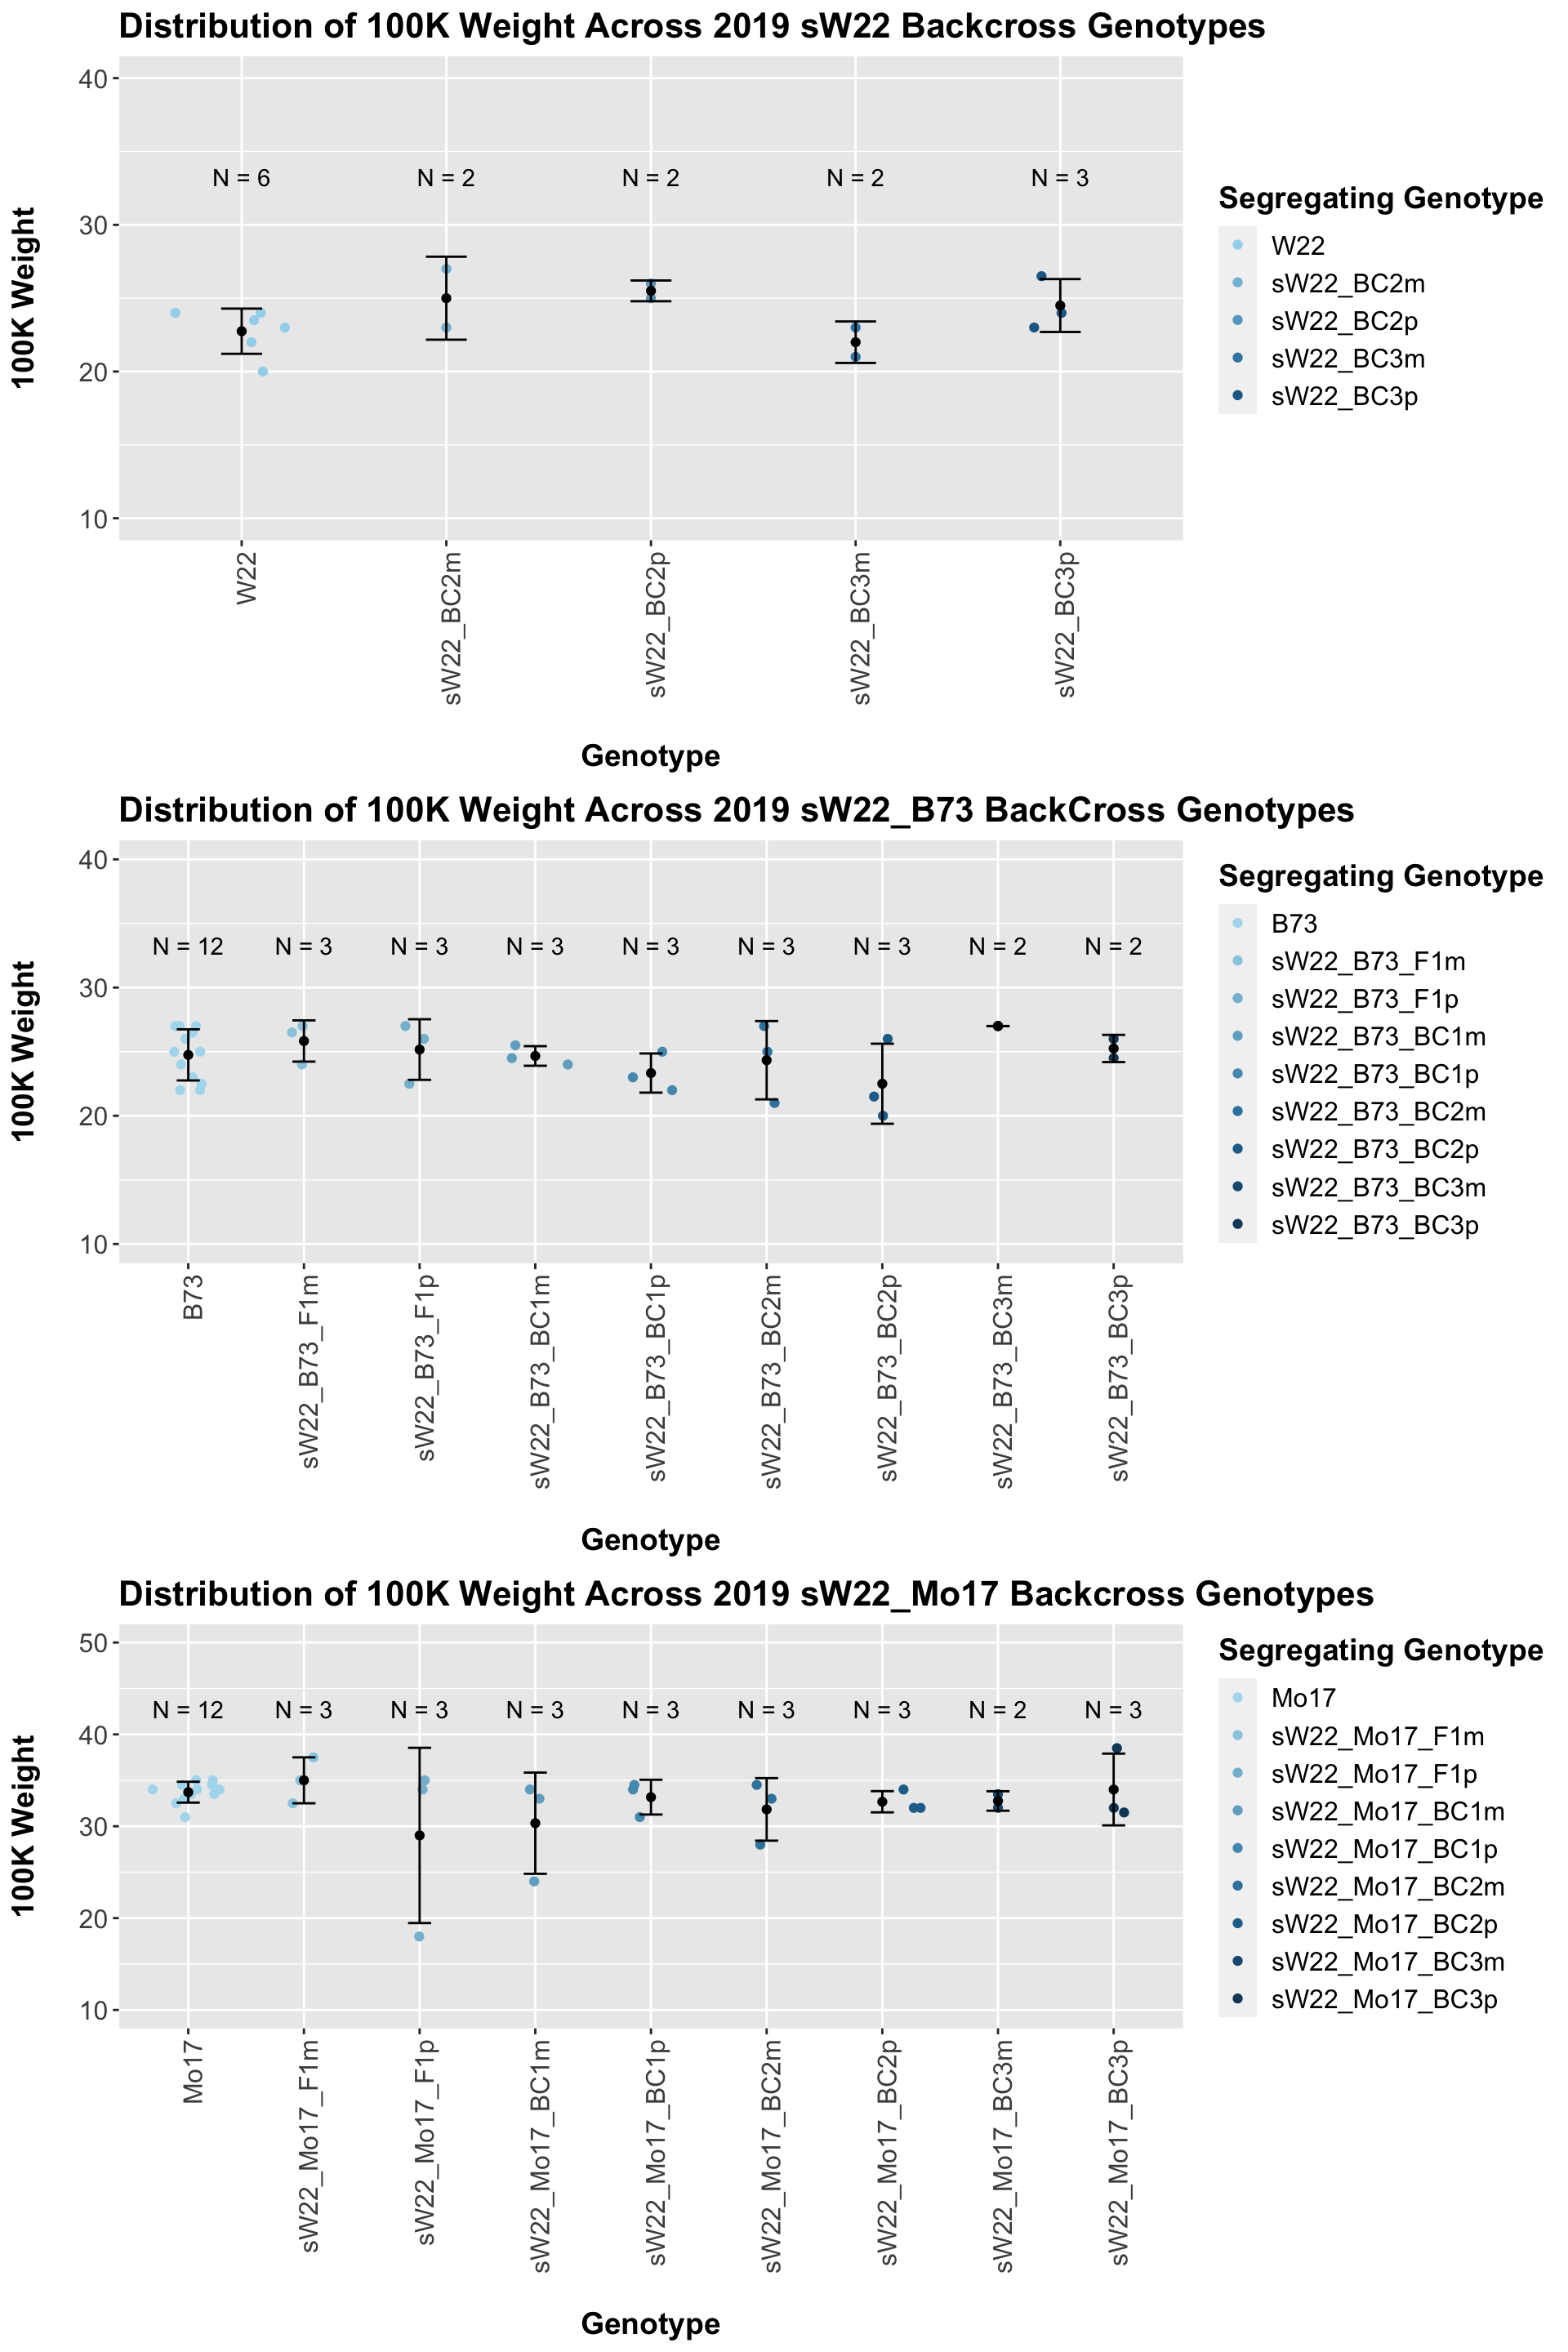
Across all of our lineages it seems as if there is a slight increase or no change as we continue backcrossing.
8.2 2019 Extimated Seed Number
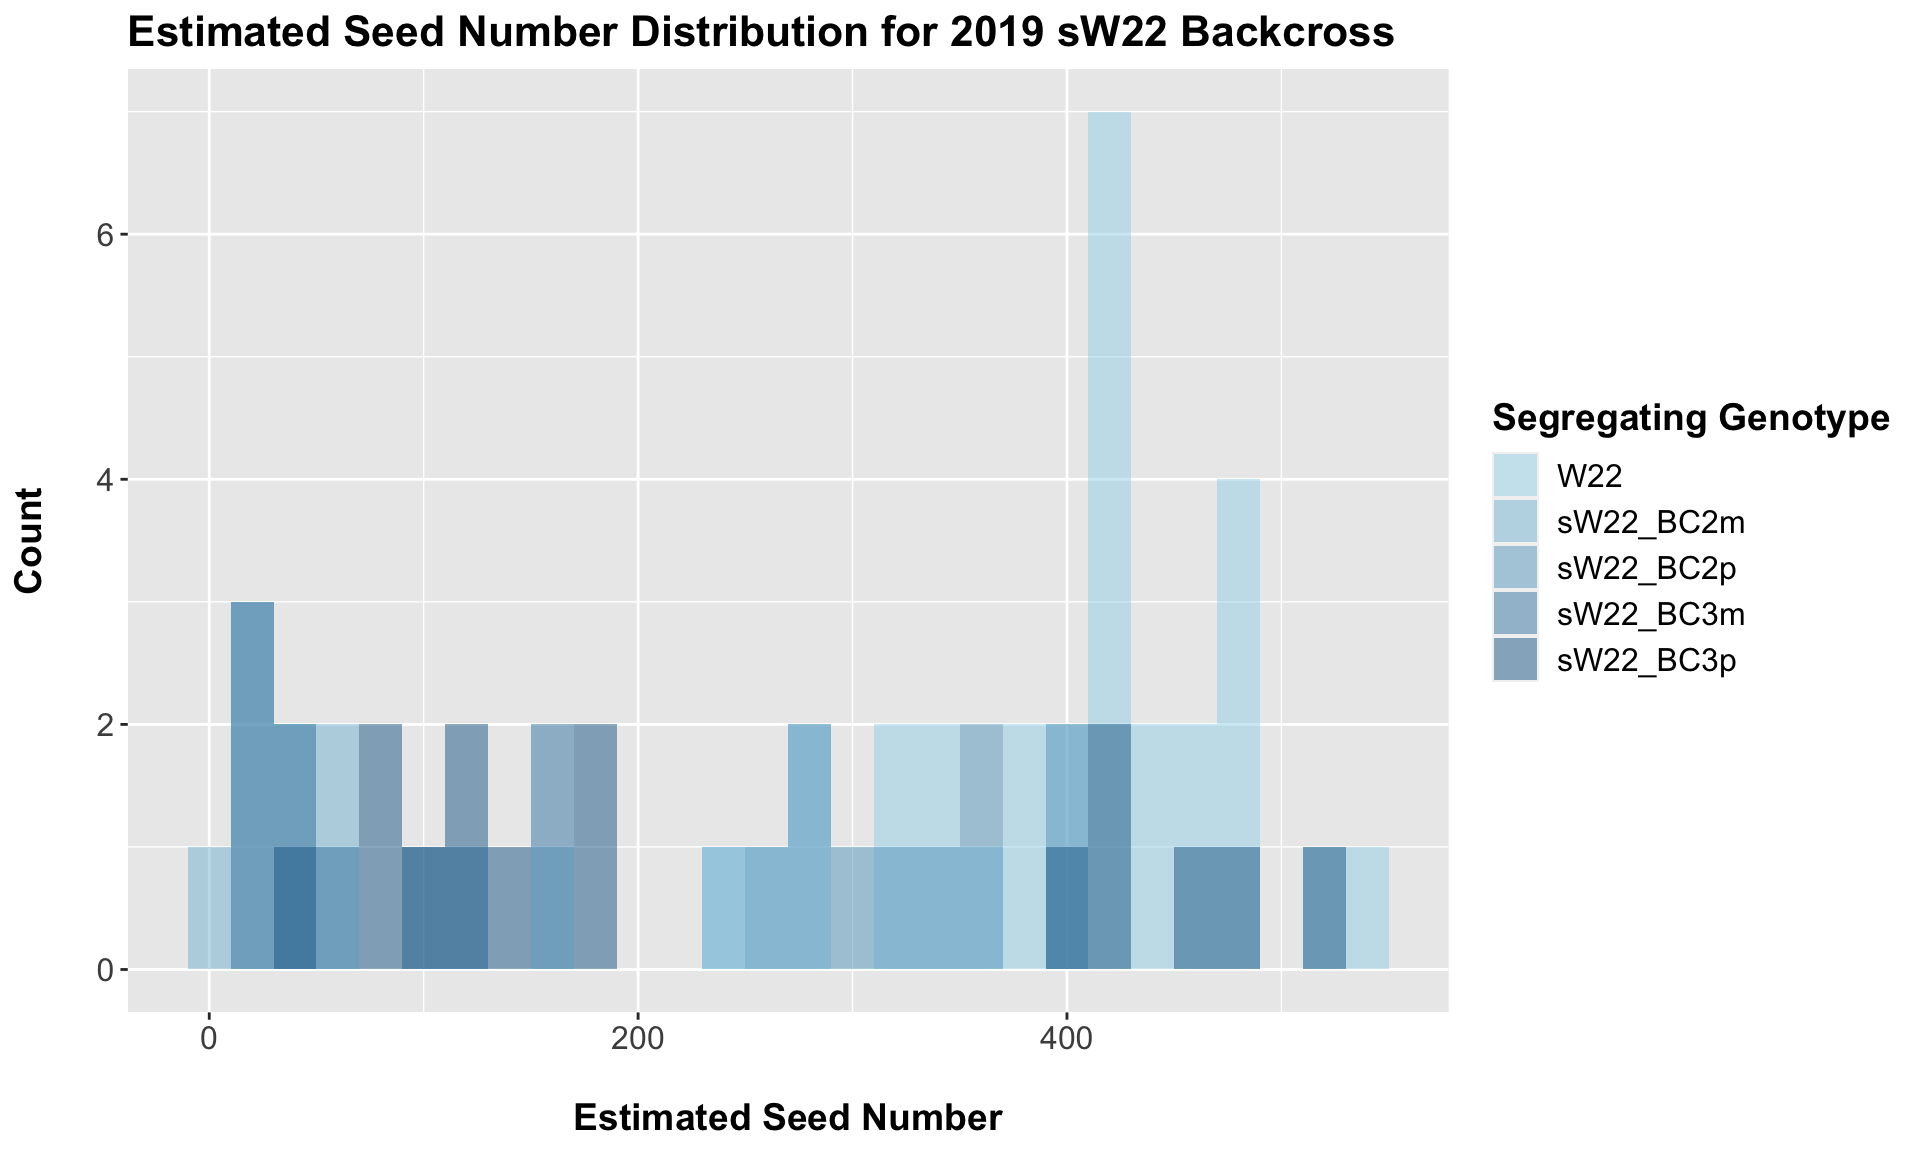
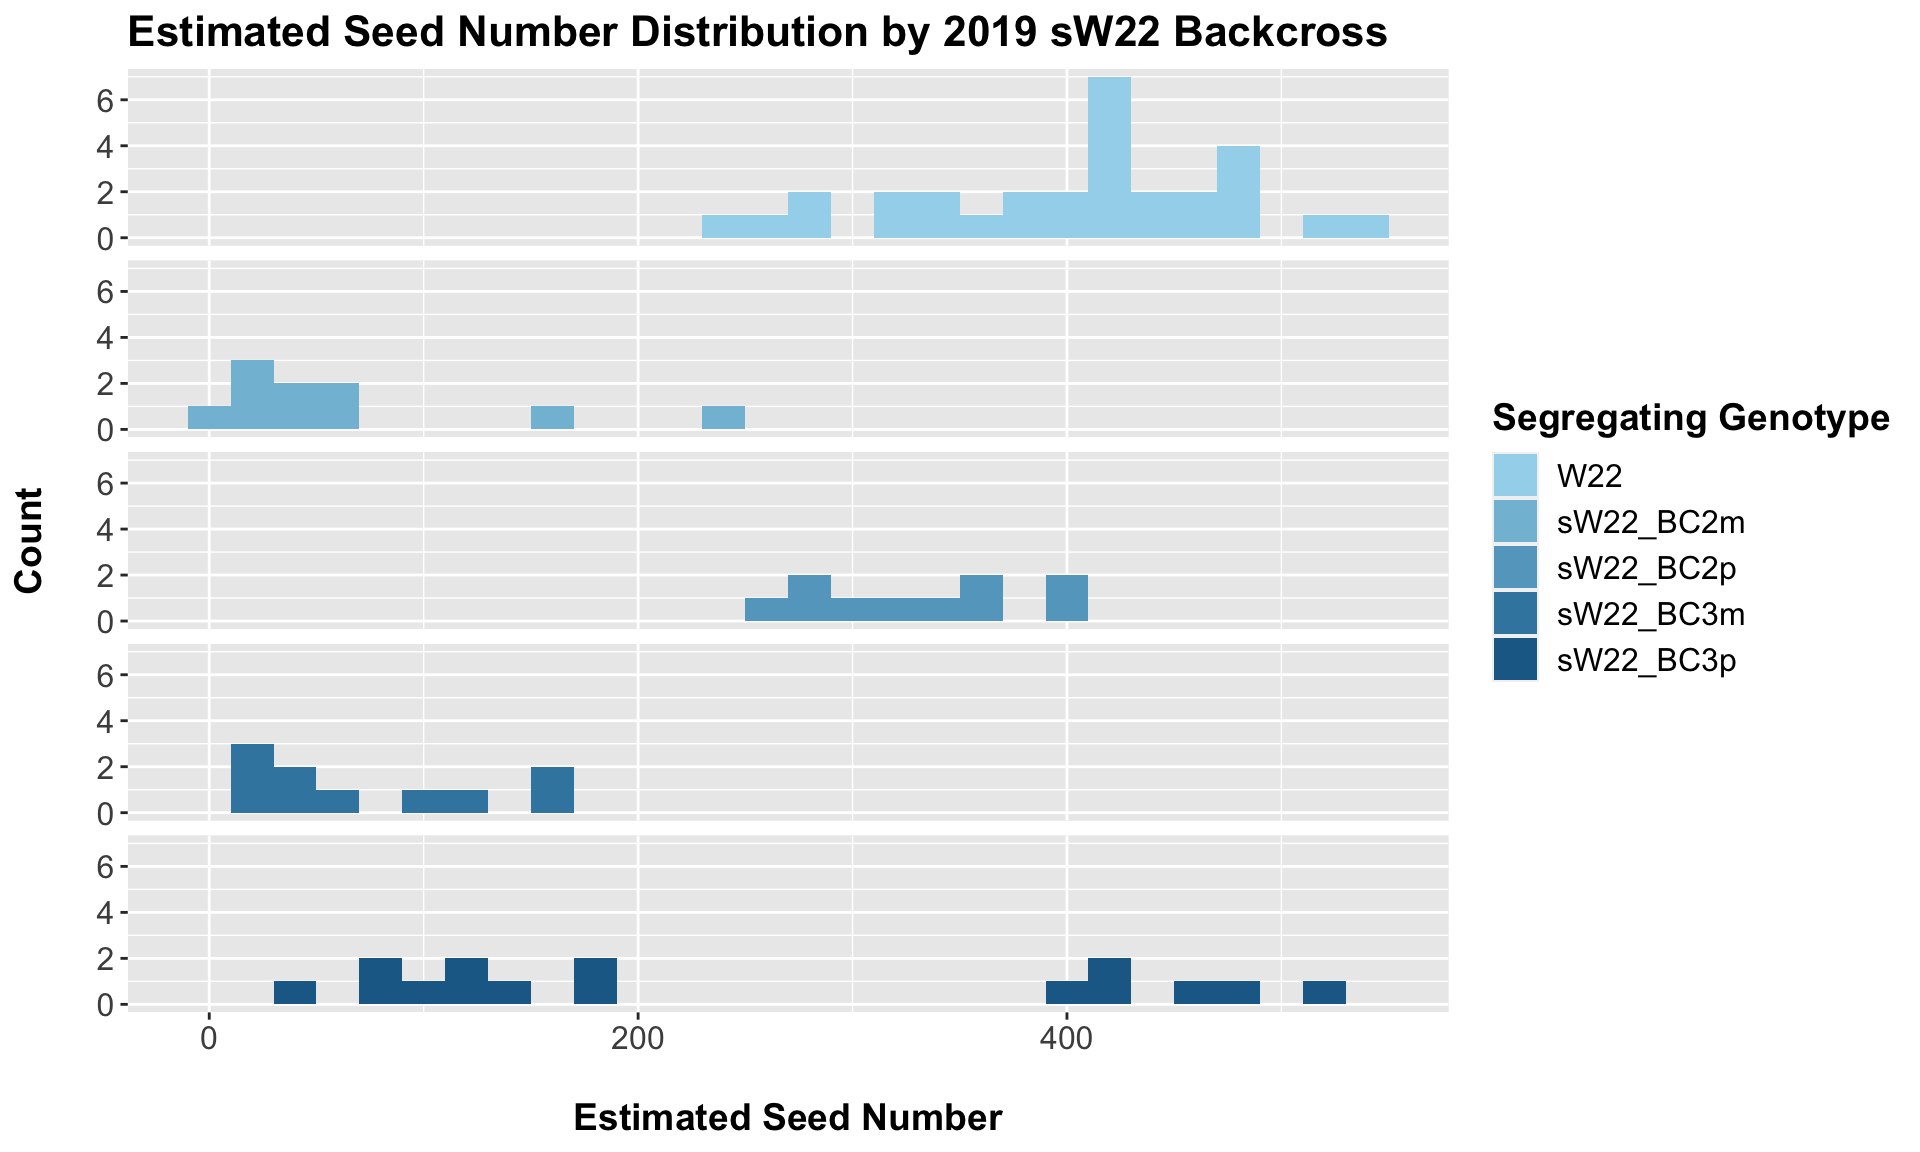
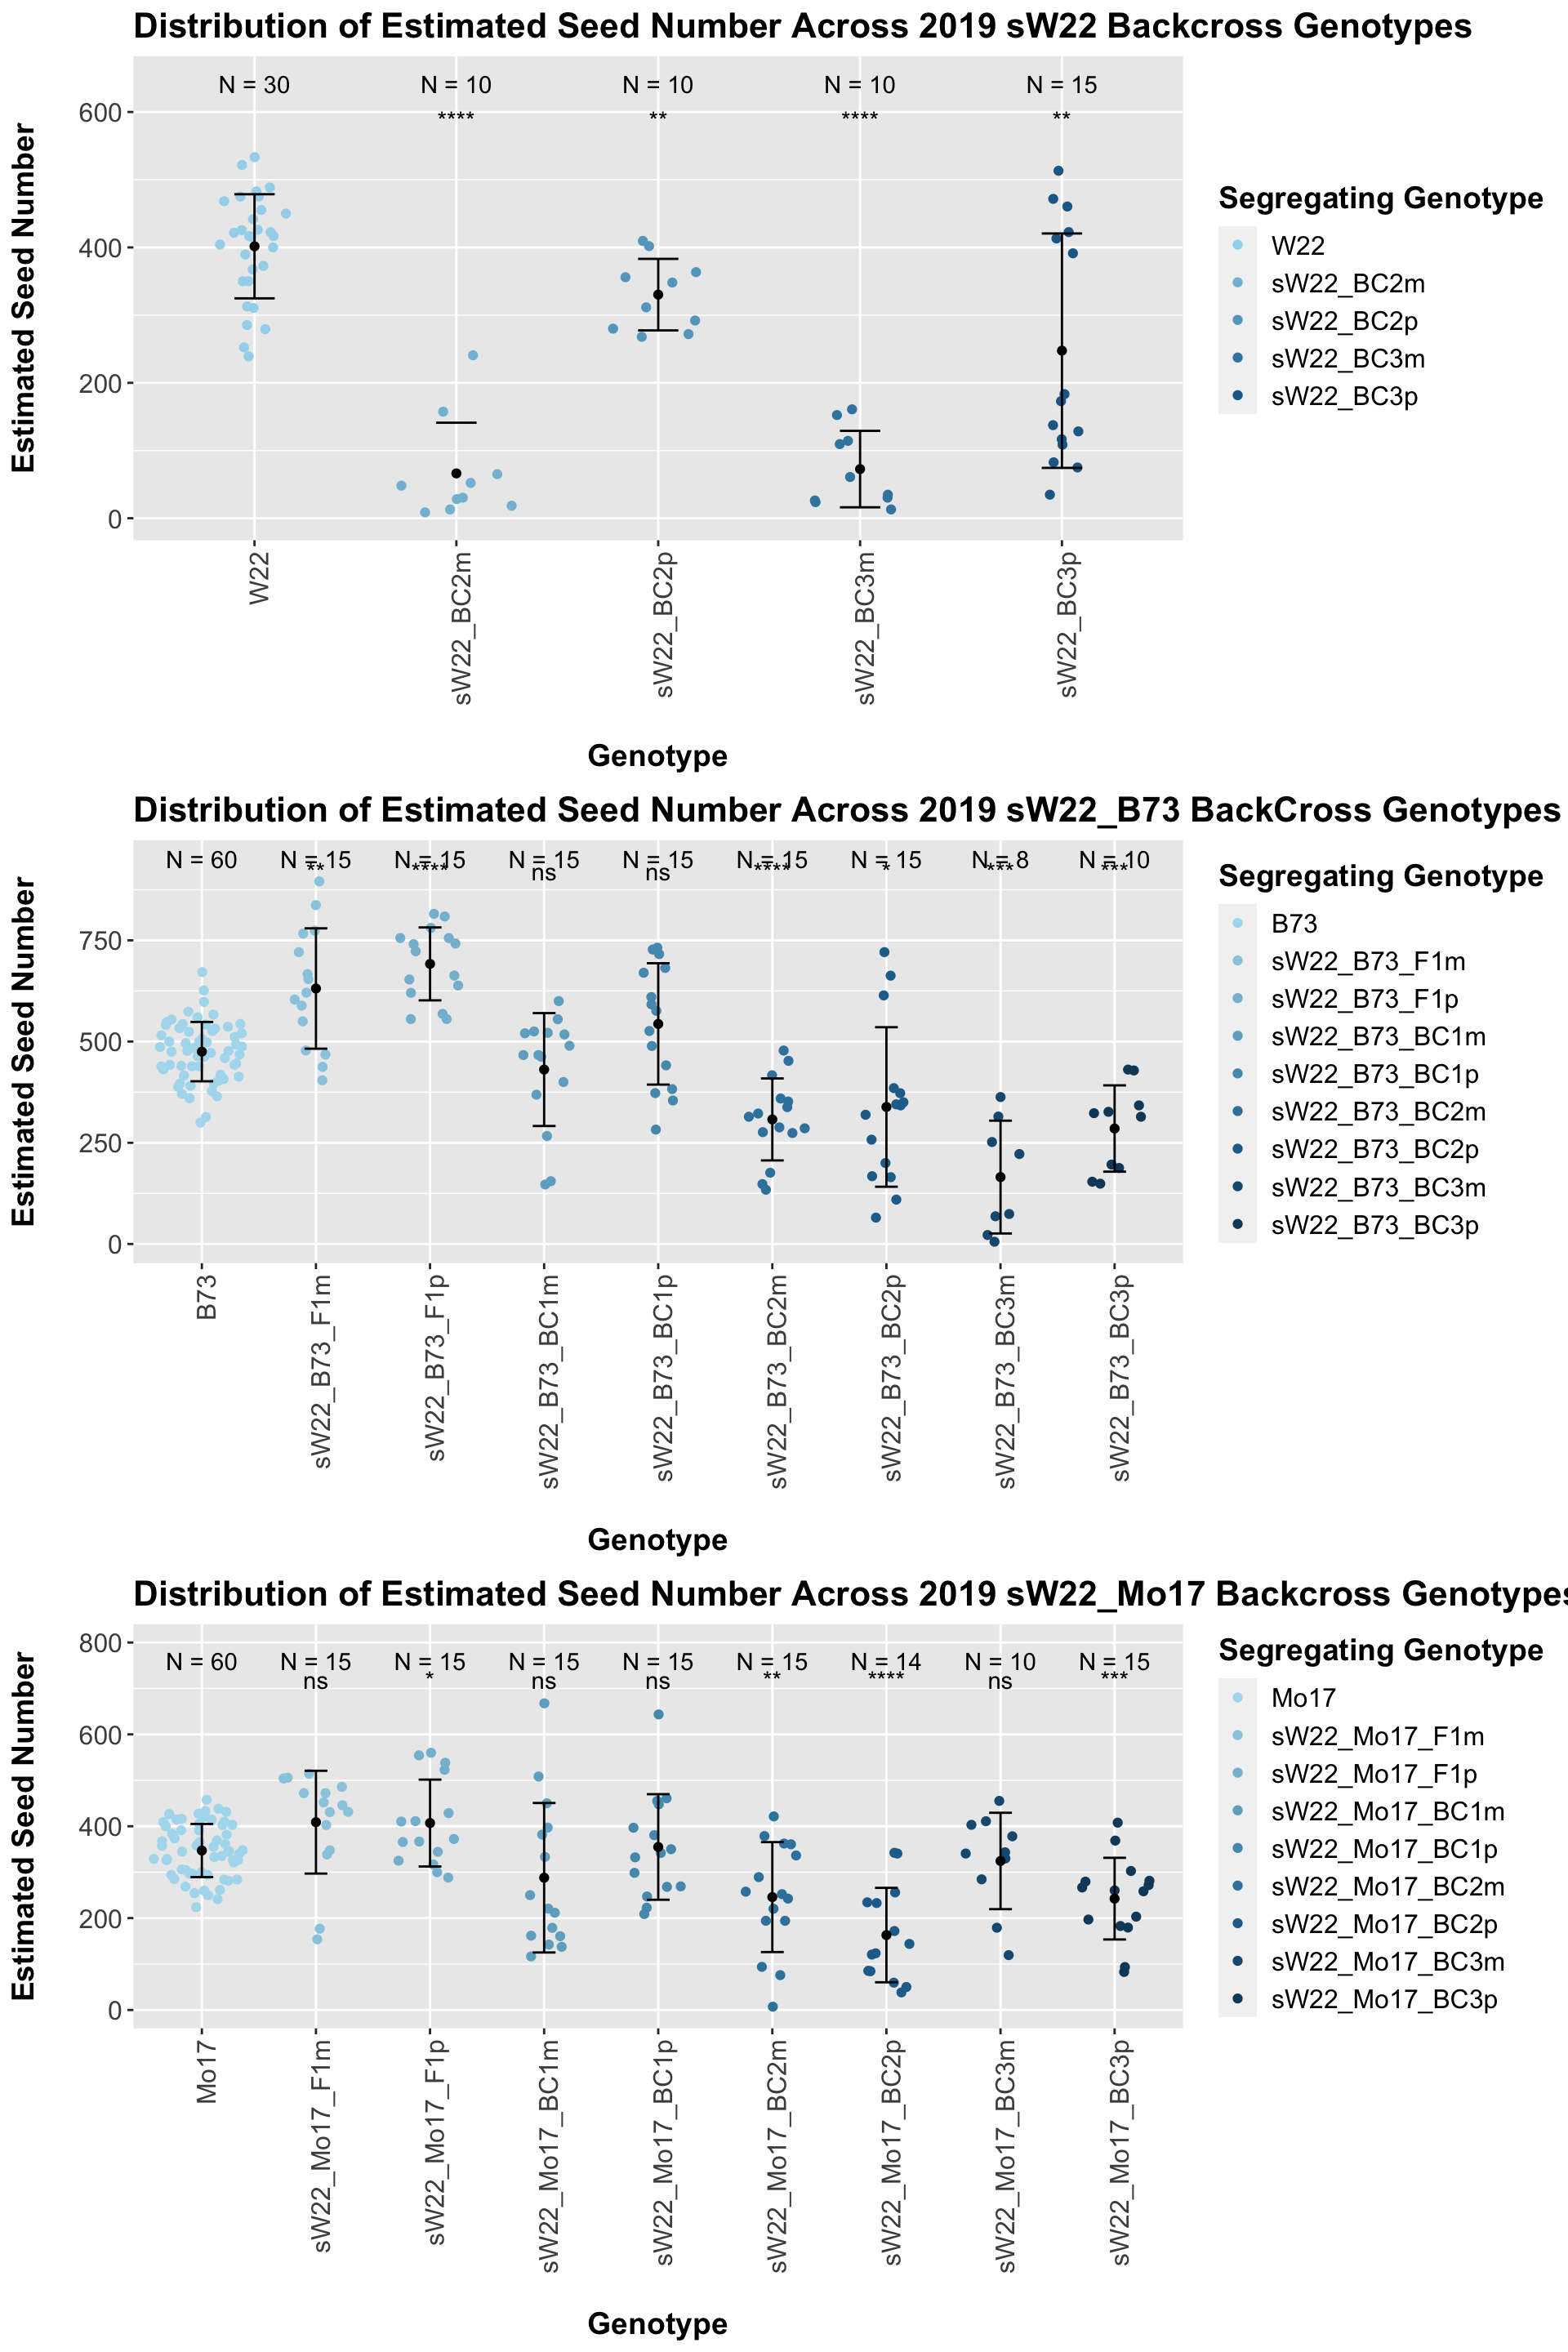
8.2.1 2019 sW22 backcrossed to W22
##
##  Mean, SD, and SE for each genotype
## Seg_Genotype N mean sd se
## 1 W22 30 401.6633 76.88782 14.03773
## 2 sW22_BC2m 10 66.2500 74.84956 23.66951
## 3 sW22_BC2p 10 330.2600 52.83644 16.70835
## 4 sW22_BC3m 10 72.6200 56.46883 17.85701
## 5 sW22_BC3p 15 247.4800 173.11073 44.69700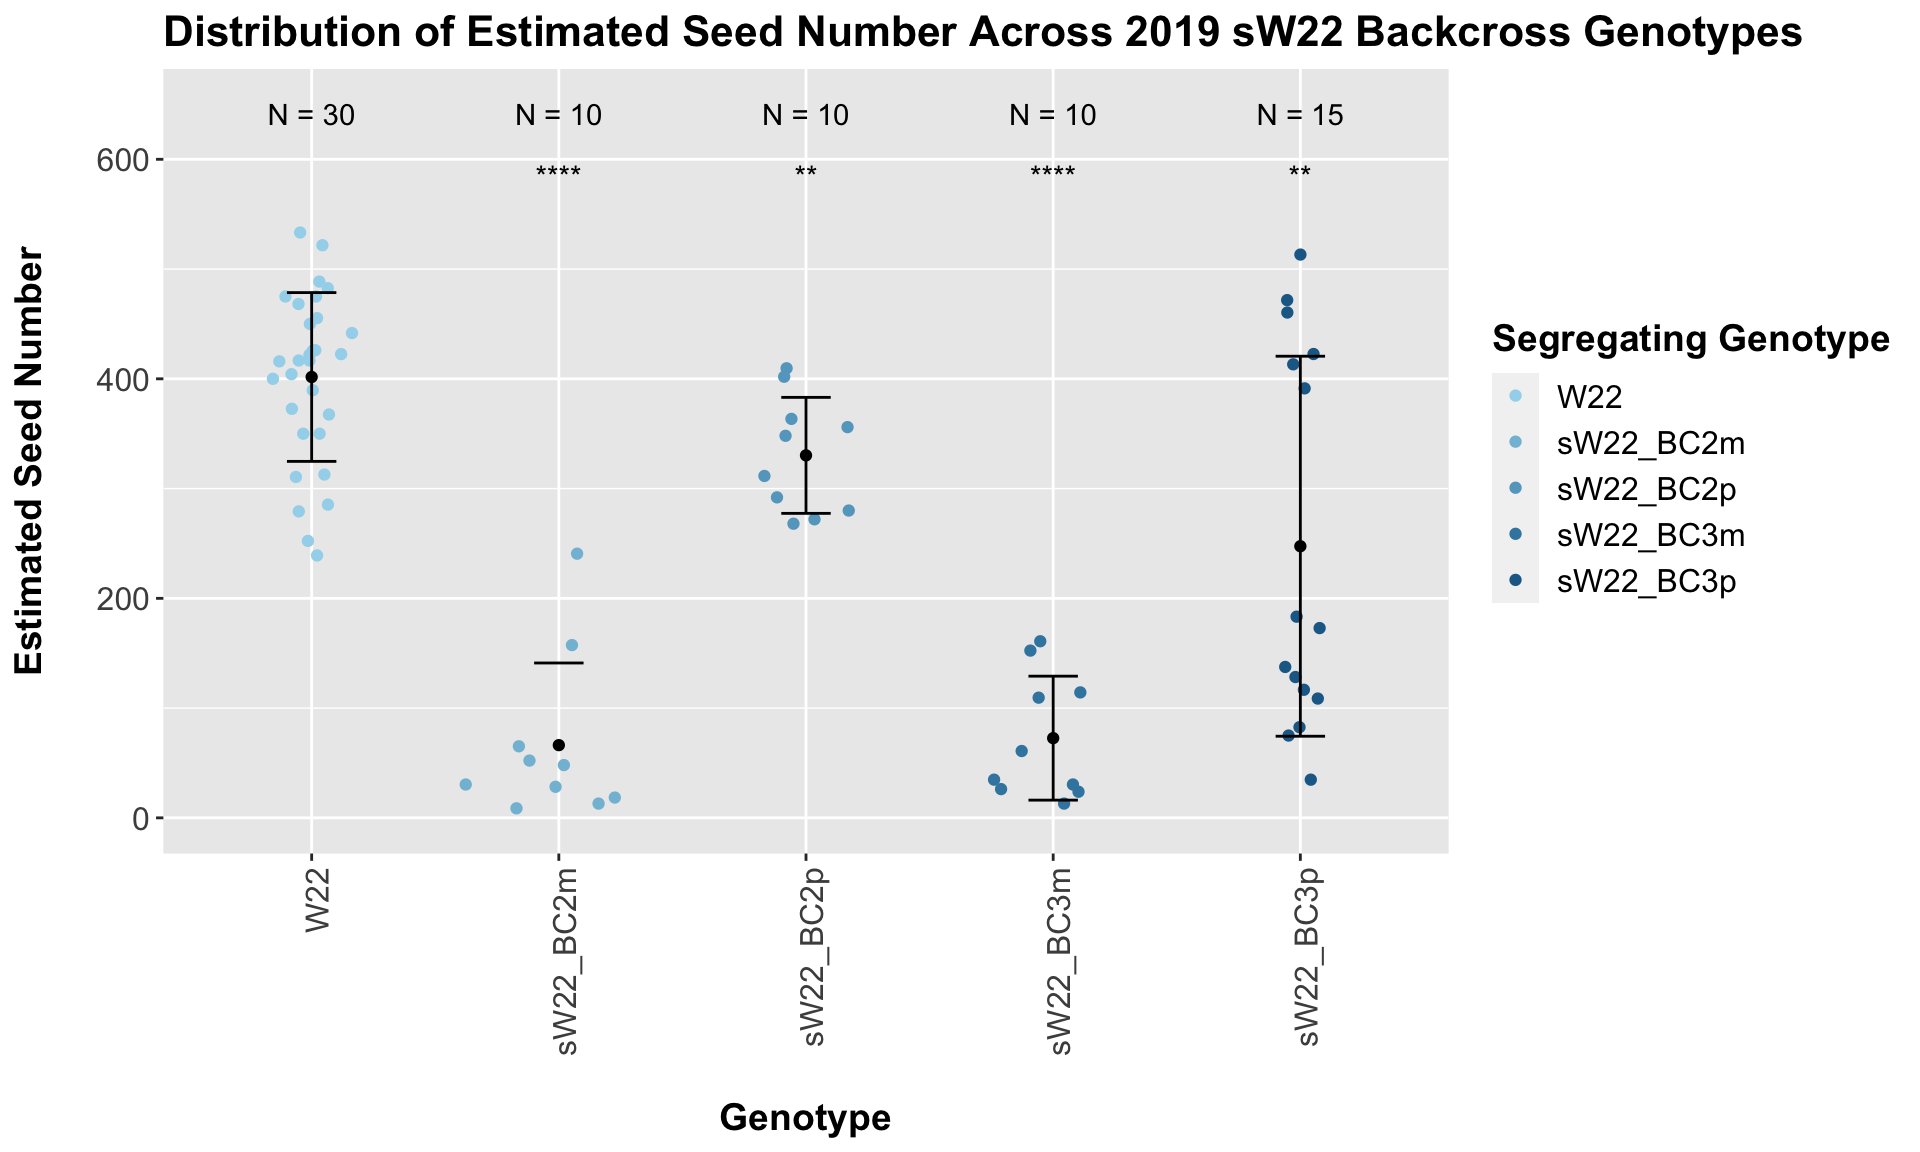
##
## Results of T-test used to obtain significance in the above plot
## # A tibble: 4 x 8
## .y. group1 group2 p p.adj p.format p.signif method
## <chr> <chr> <chr> <dbl> <dbl> <chr> <chr> <chr>
## 1 Ear_Trait W22 sW22_BC2m 1.85e- 9 5.60e- 9 1.9e-09 **** T-test
## 2 Ear_Trait W22 sW22_BC2p 3.39e- 3 6.80e- 3 0.0034 ** T-test
## 3 Ear_Trait W22 sW22_BC3m 2.00e-12 8.00e-12 2.0e-12 **** T-test
## 4 Ear_Trait W22 sW22_BC3p 4.36e- 3 6.80e- 3 0.0044 ** T-testWe see a very significant reduction in estimated seed number of the sW22 backcrosses when compared to the W22 seed number. The sick maternal crosses have notably fewer seeds than the sick paternal crosses.
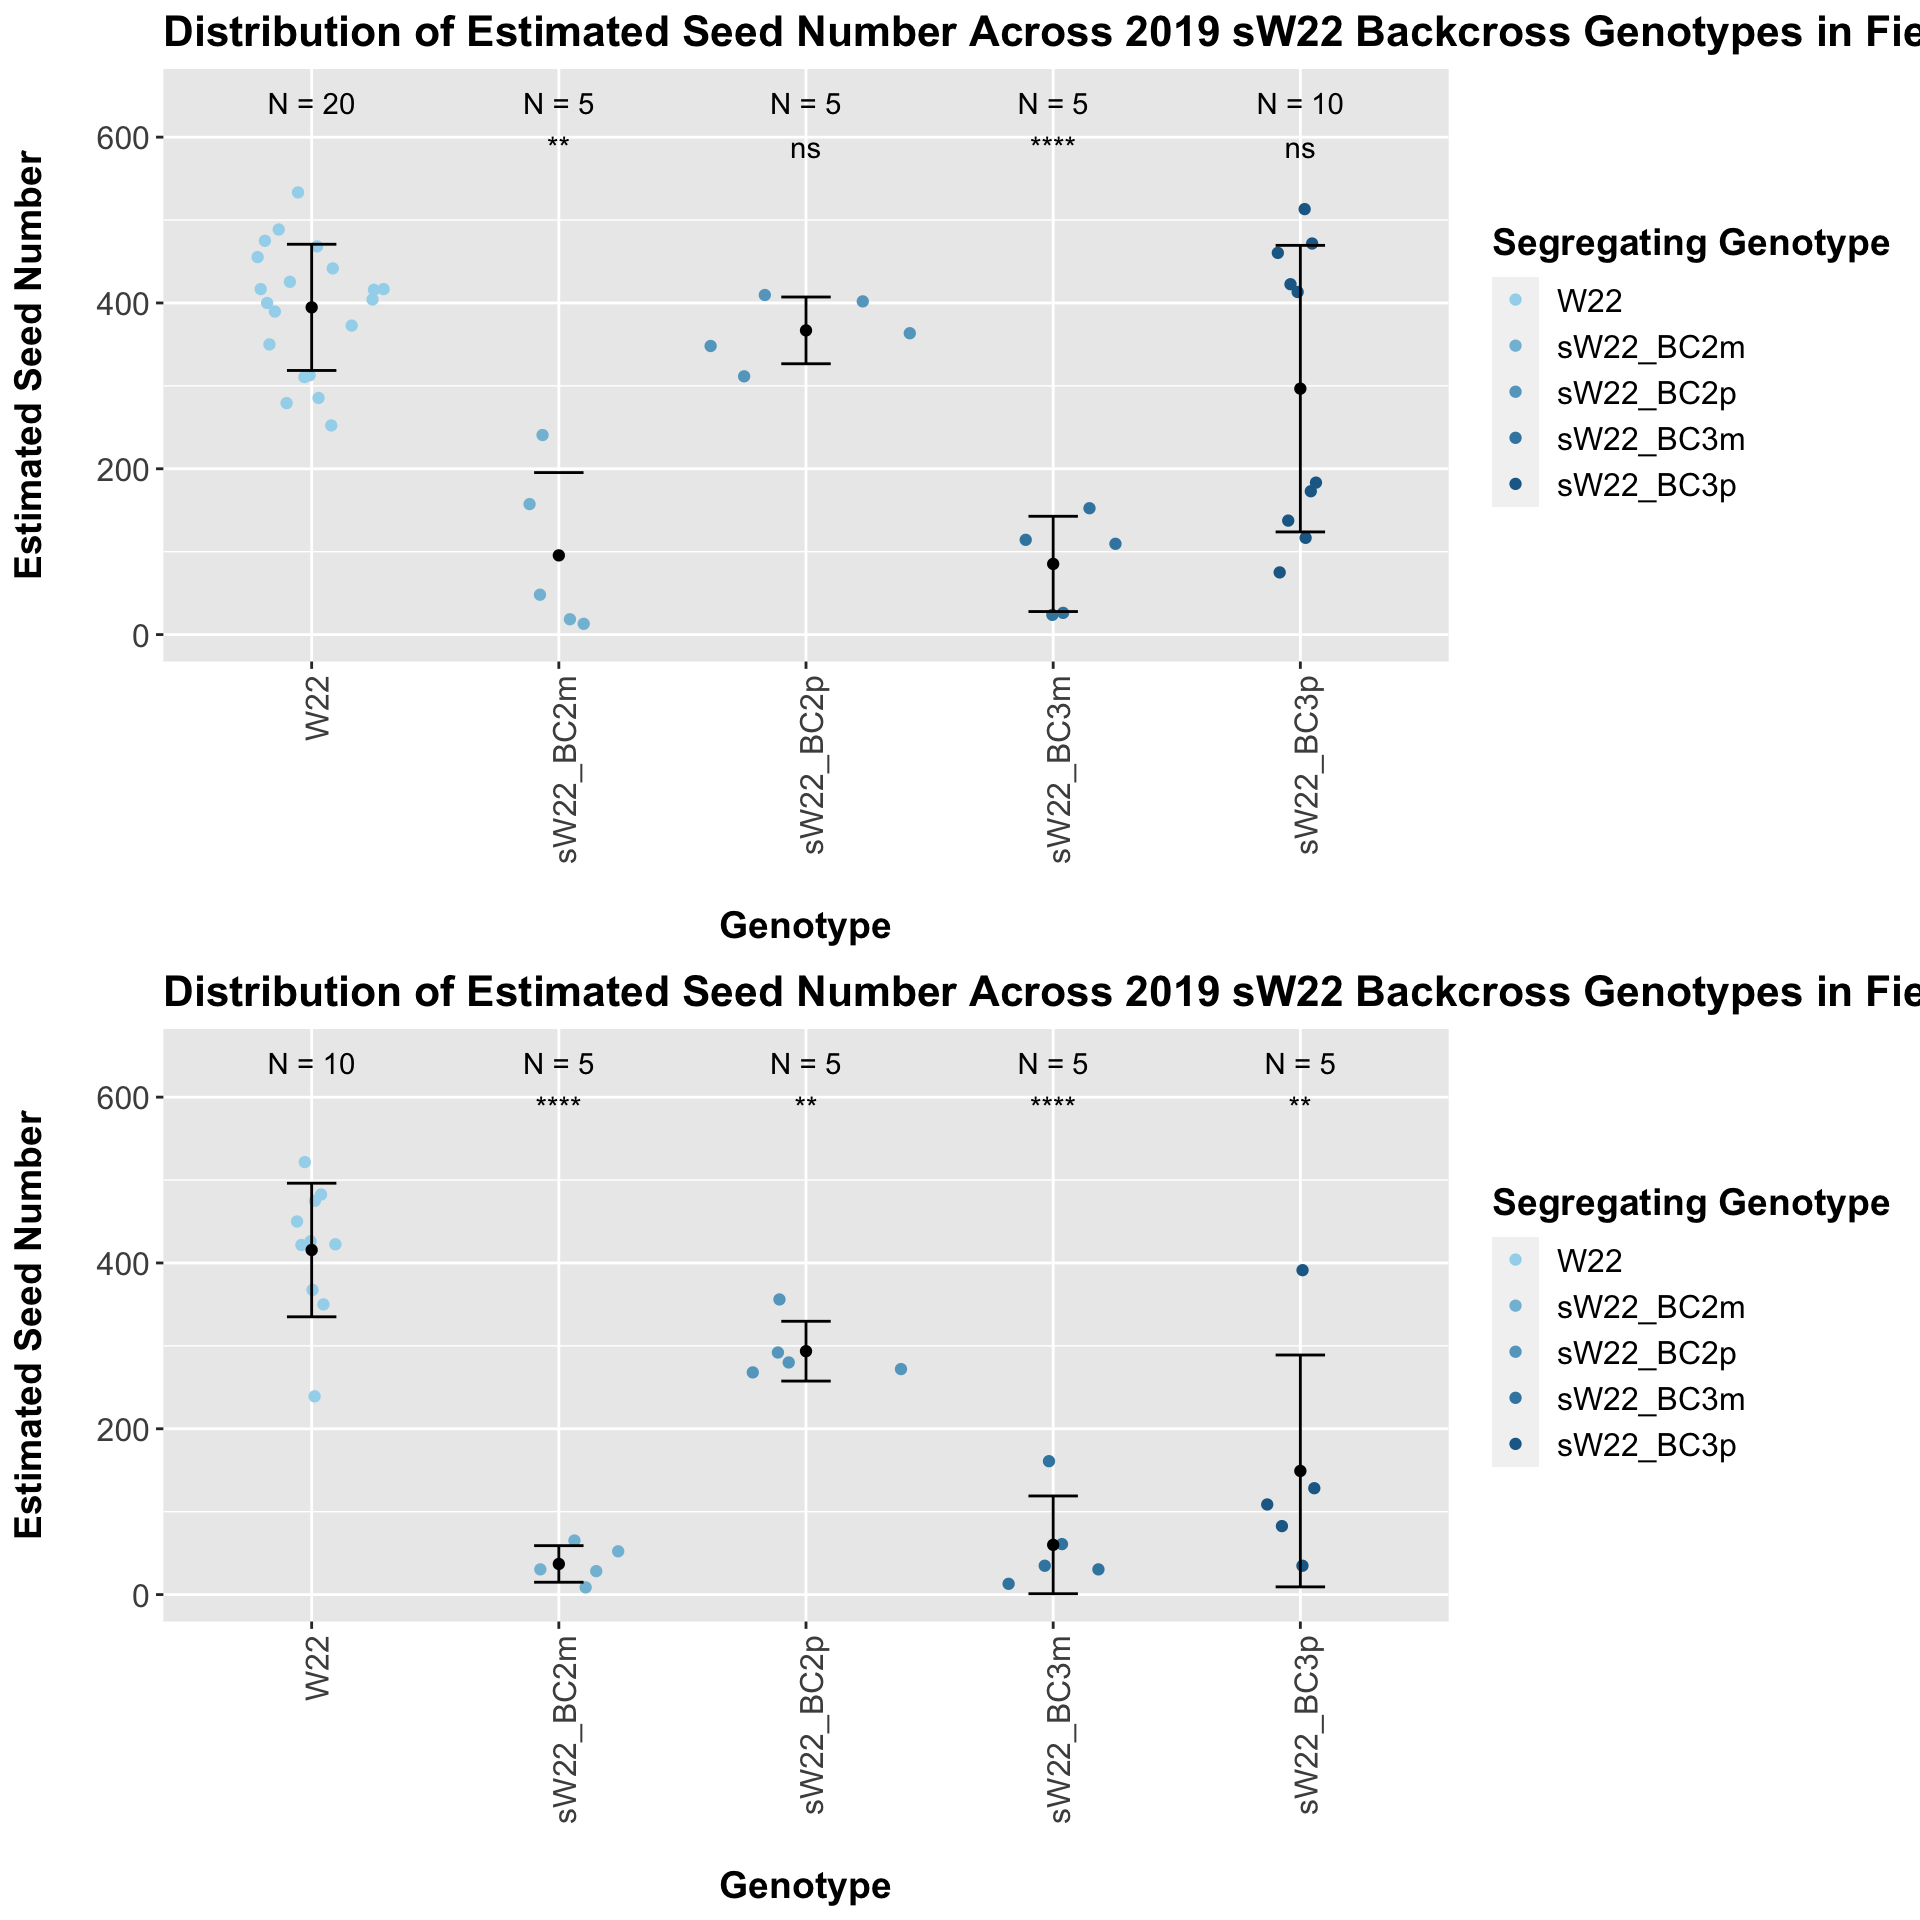
This trend once again holds if we stratify the data by field, but I would take the statistical test of the difference of means with a grain of salt due to the low sample sizes.
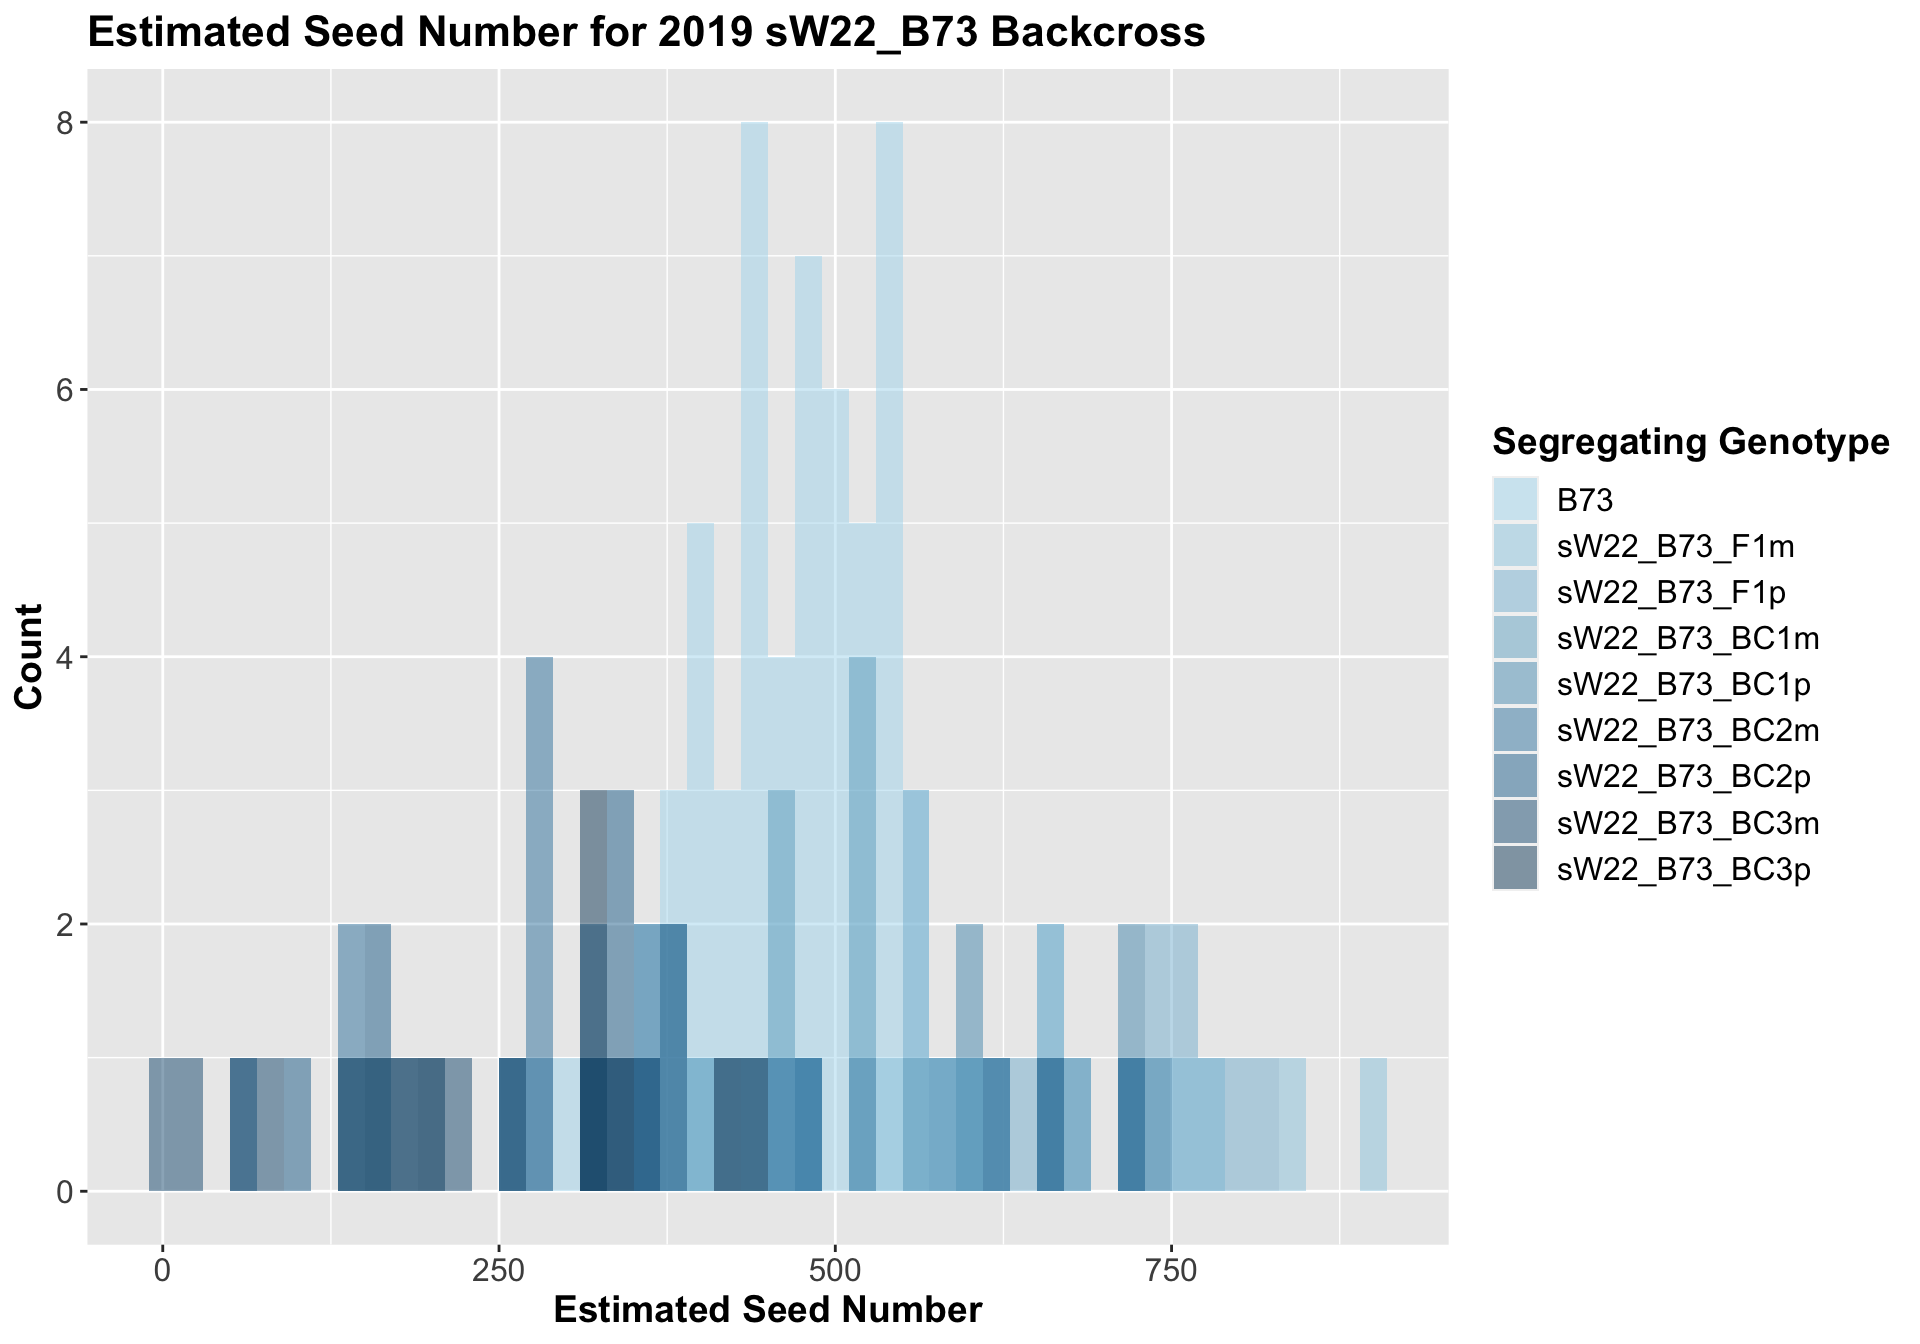
8.2.2 2019 sW22 and W22 backcrossed to B73
##
##  Mean, SD, and SE for each genotype
## Seg_Genotype N mean sd se
## 1 B73 60 475.1650 73.26589 9.458586
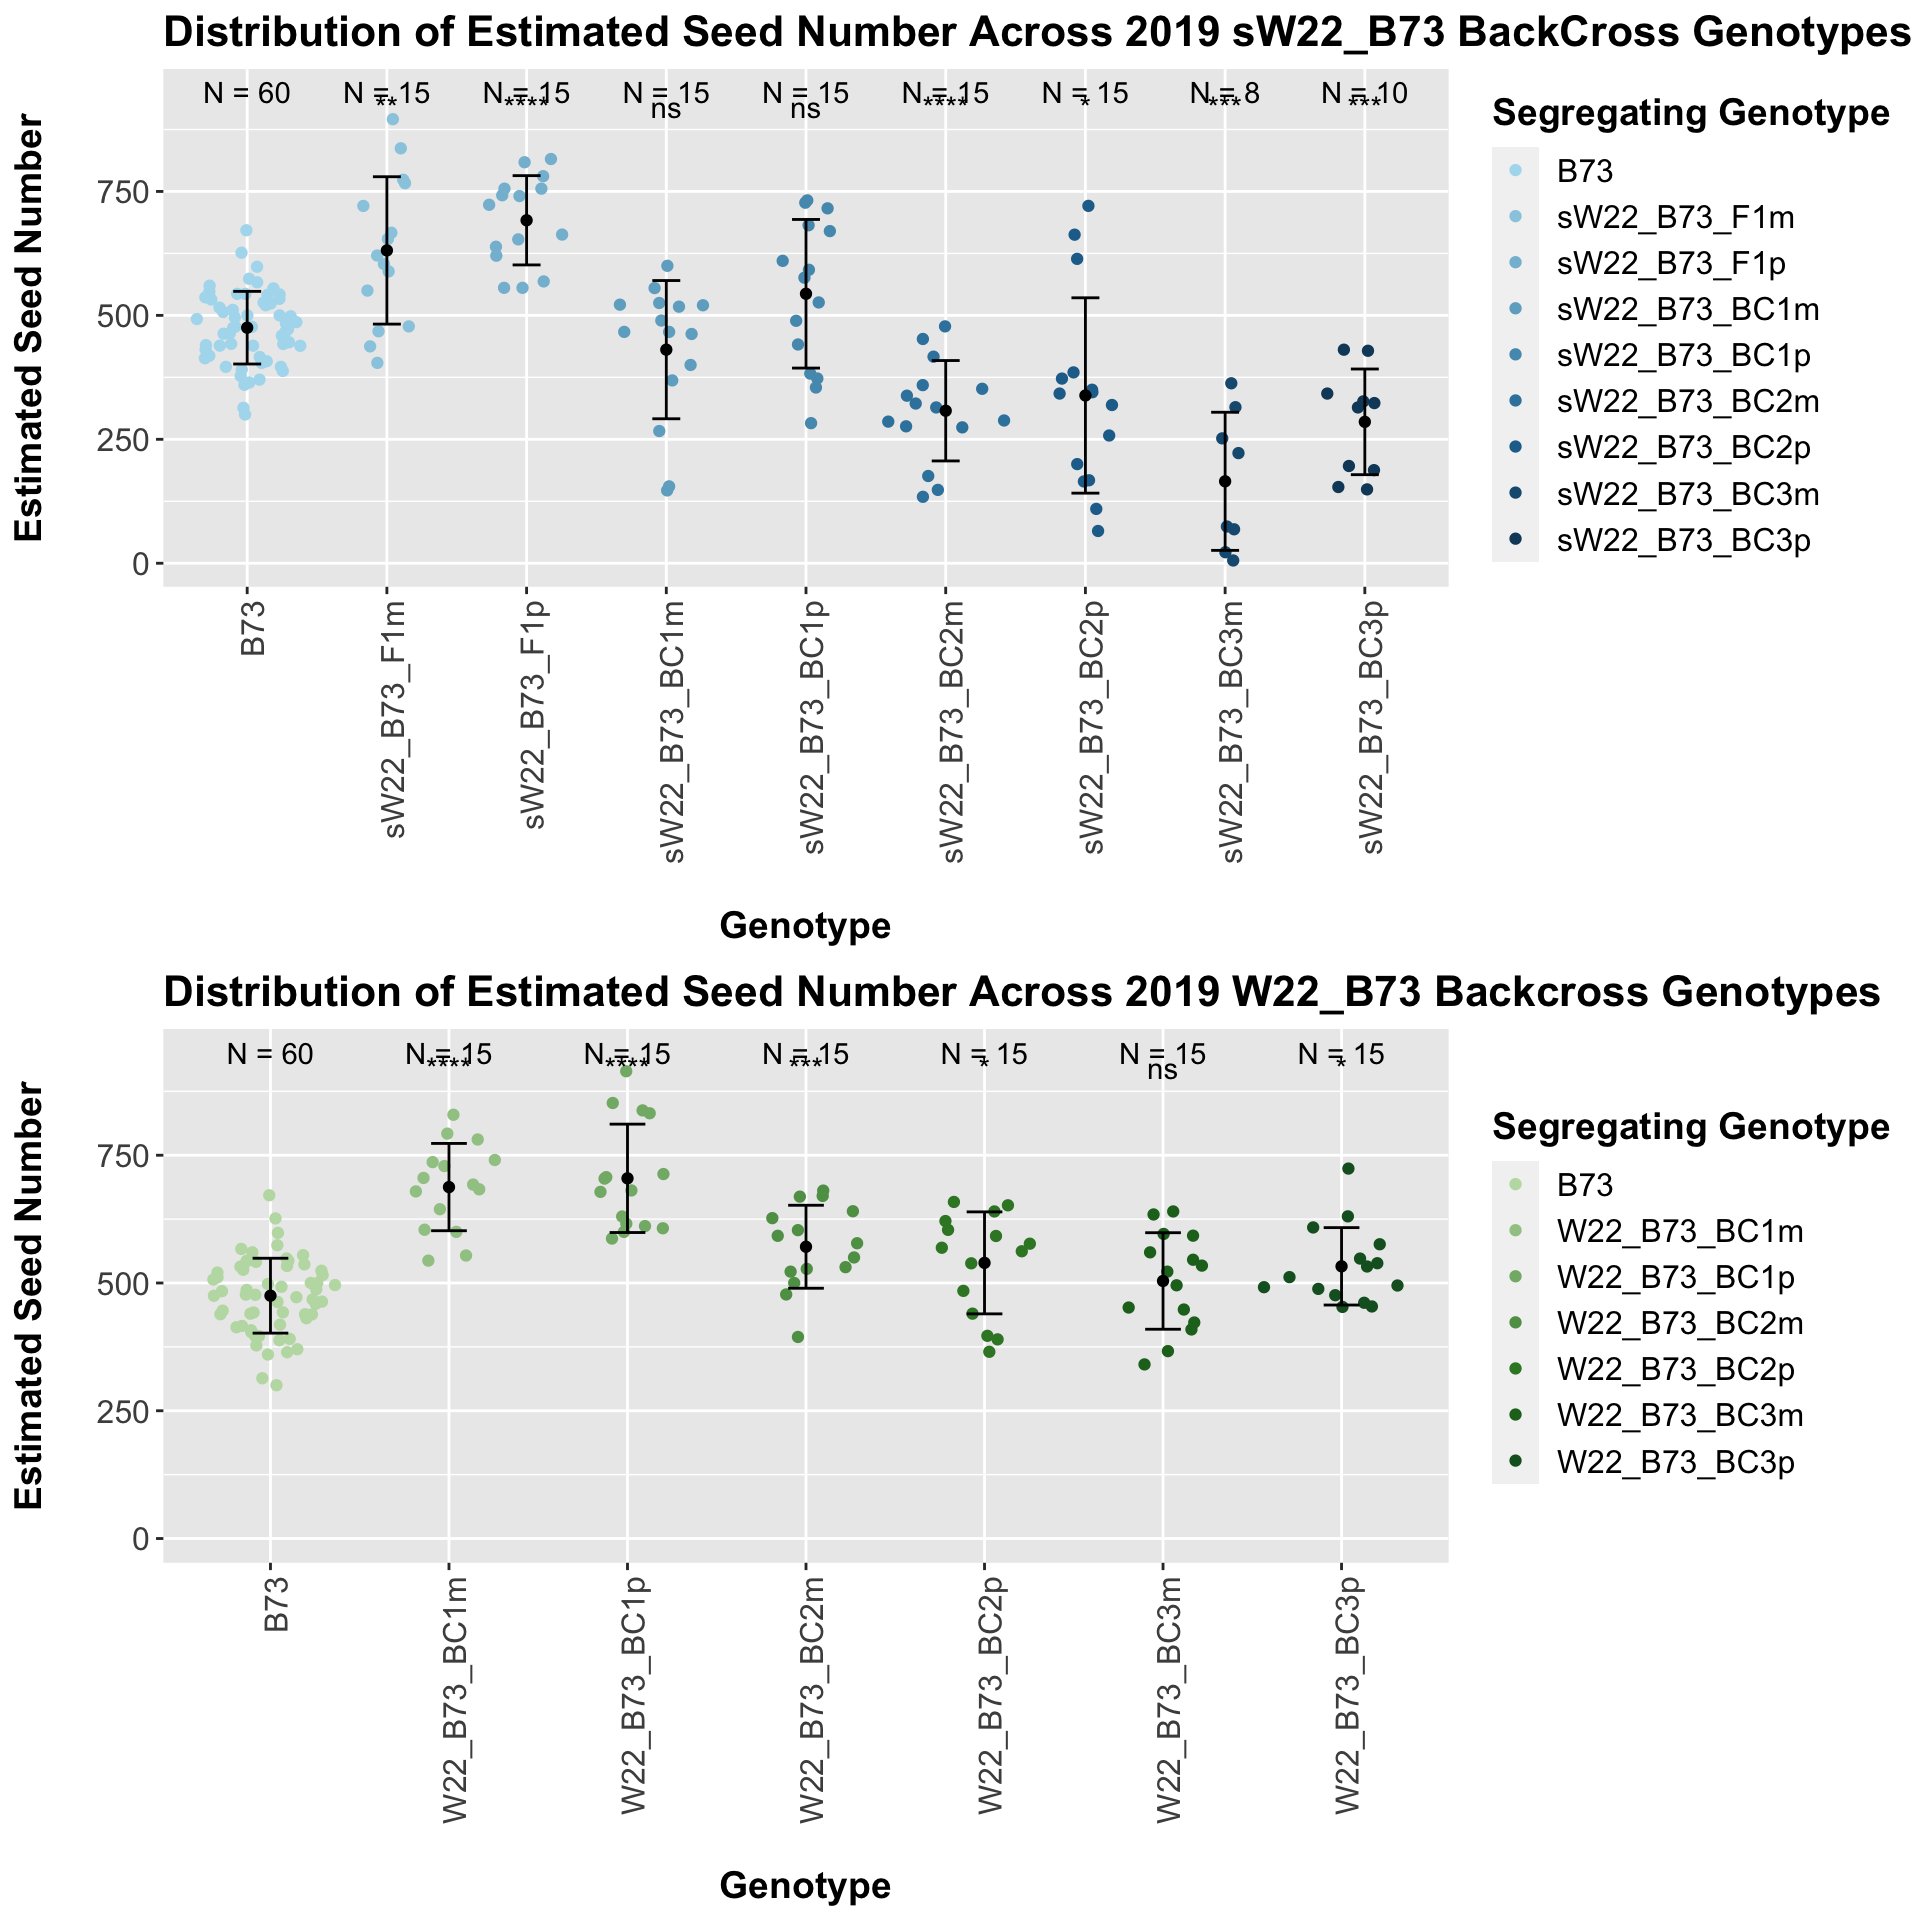
## 2 sW22_B73_F1m 15 631.0267 148.64459 38.379869
## 3 sW22_B73_F1p 15 691.8200 90.05027 23.250879
## 4 sW22_B73_BC1m 15 430.8467 139.41994 35.998074
## 5 sW22_B73_BC1p 15 543.5933 149.89387 38.702432
## 6 sW22_B73_BC2m 15 307.6400 101.26172 26.145665
## 7 sW22_B73_BC2p 15 338.4333 197.01545 50.869171
## 8 sW22_B73_BC3m 8 165.2875 139.30547 49.251920
## 9 sW22_B73_BC3p 10 285.2400 106.58142 33.704003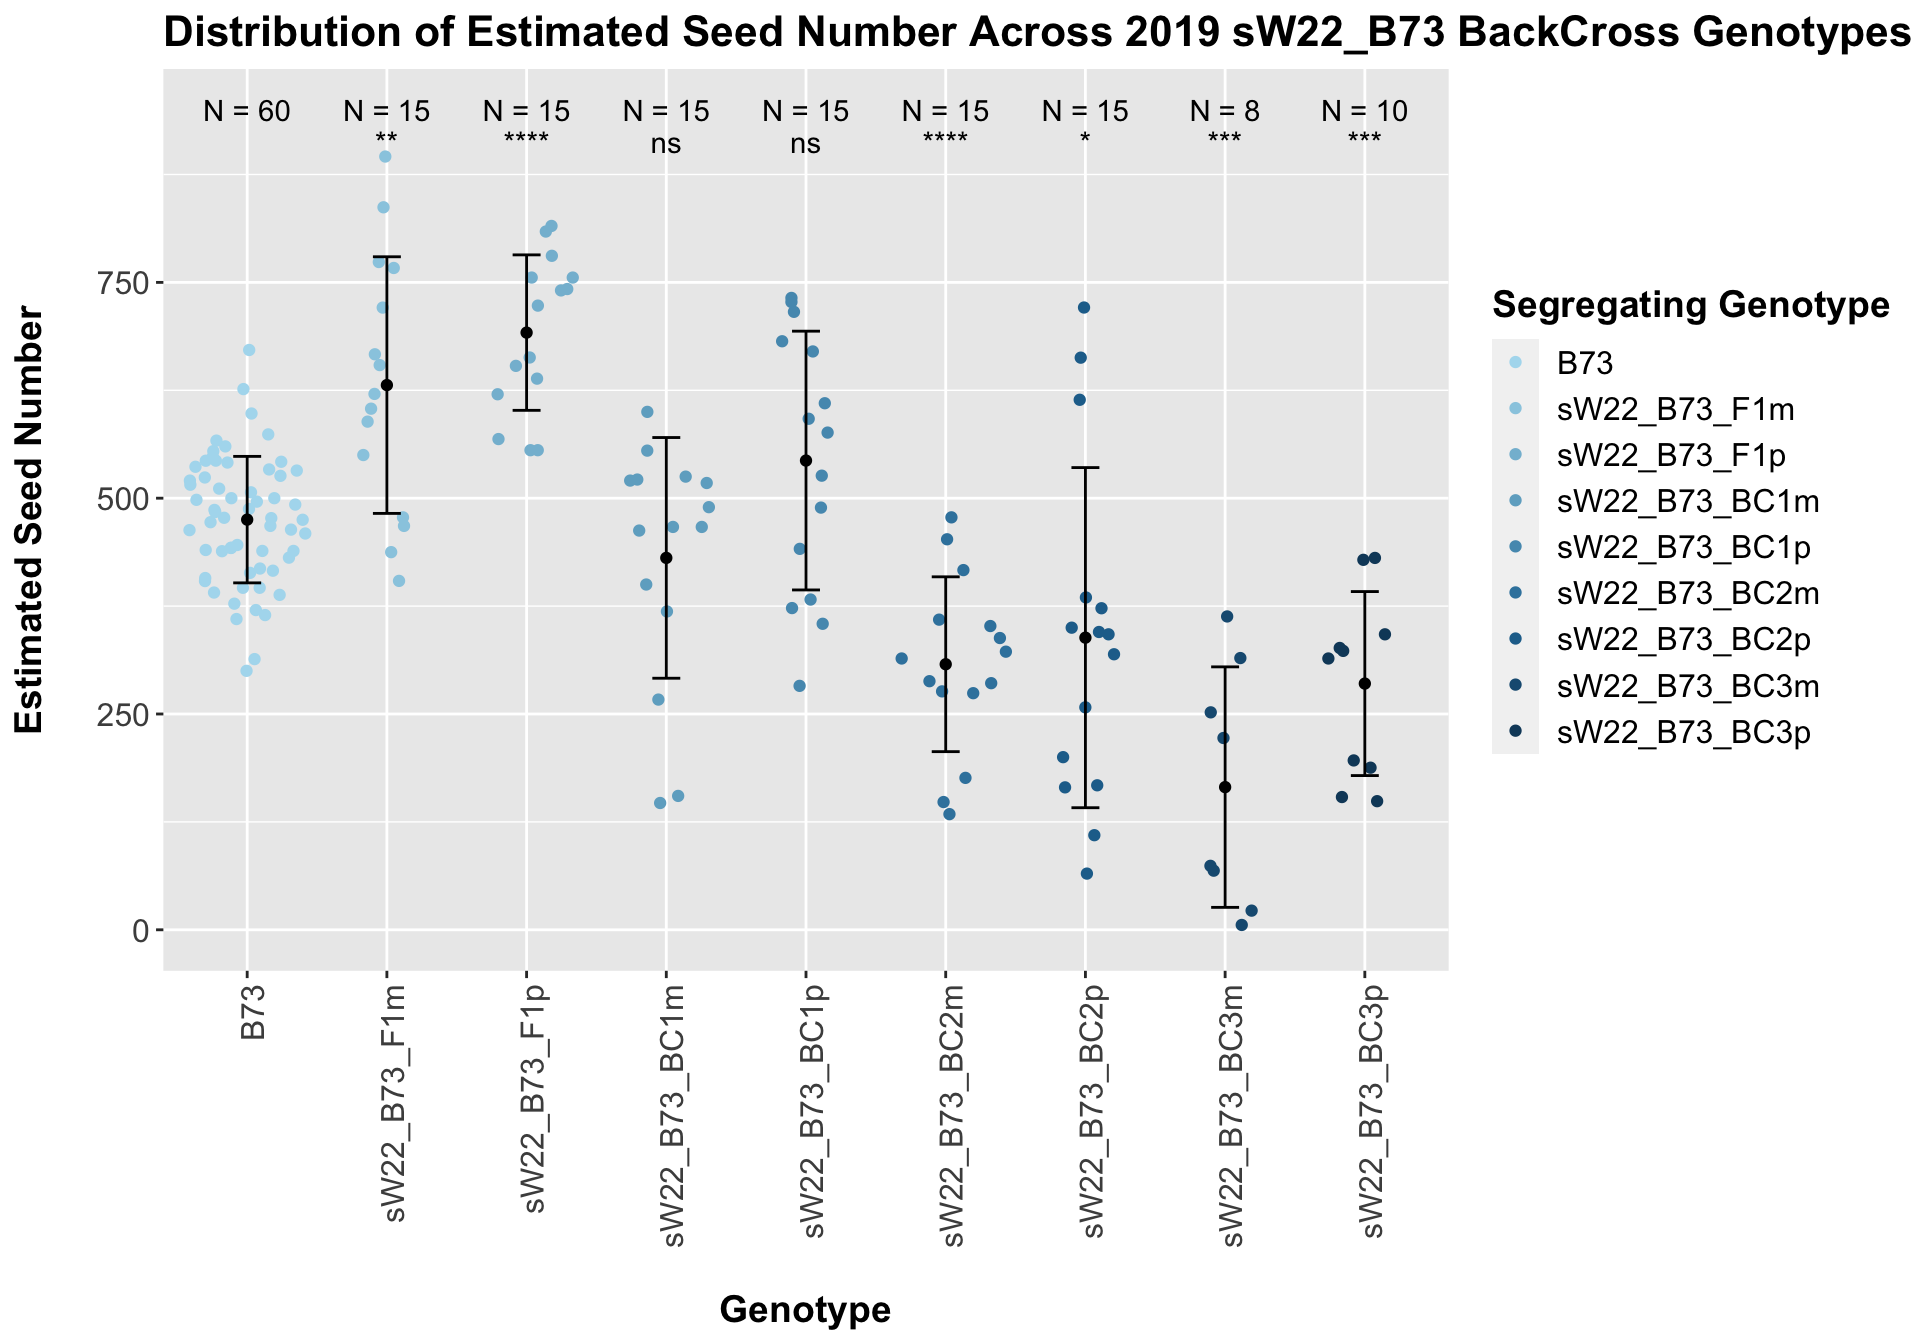
## # A tibble: 8 x 8
## .y. group1 group2 p p.adj p.format p.signif method
## <chr> <chr> <chr> <dbl> <dbl> <chr> <chr> <chr>
## 1 Ear_Trait B73 sW22_B73_F1m 0.00120 4.80e-3 0.00120 ** T-test
## 2 Ear_Trait B73 sW22_B73_F1p 0.0000000557 4.50e-7 5.6e-08 **** T-test
## 3 Ear_Trait B73 sW22_B73_BC1m 0.251 2.50e-1 0.25115 ns T-test
## 4 Ear_Trait B73 sW22_B73_BC1p 0.106 2.10e-1 0.10553 ns T-test
## 5 Ear_Trait B73 sW22_B73_BC2m 0.0000111 7.80e-5 1.1e-05 **** T-test
## 6 Ear_Trait B73 sW22_B73_BC2p 0.0185 5.50e-2 0.01848 * T-test
## 7 Ear_Trait B73 sW22_B73_BC3m 0.000341 1.70e-3 0.00034 *** T-test
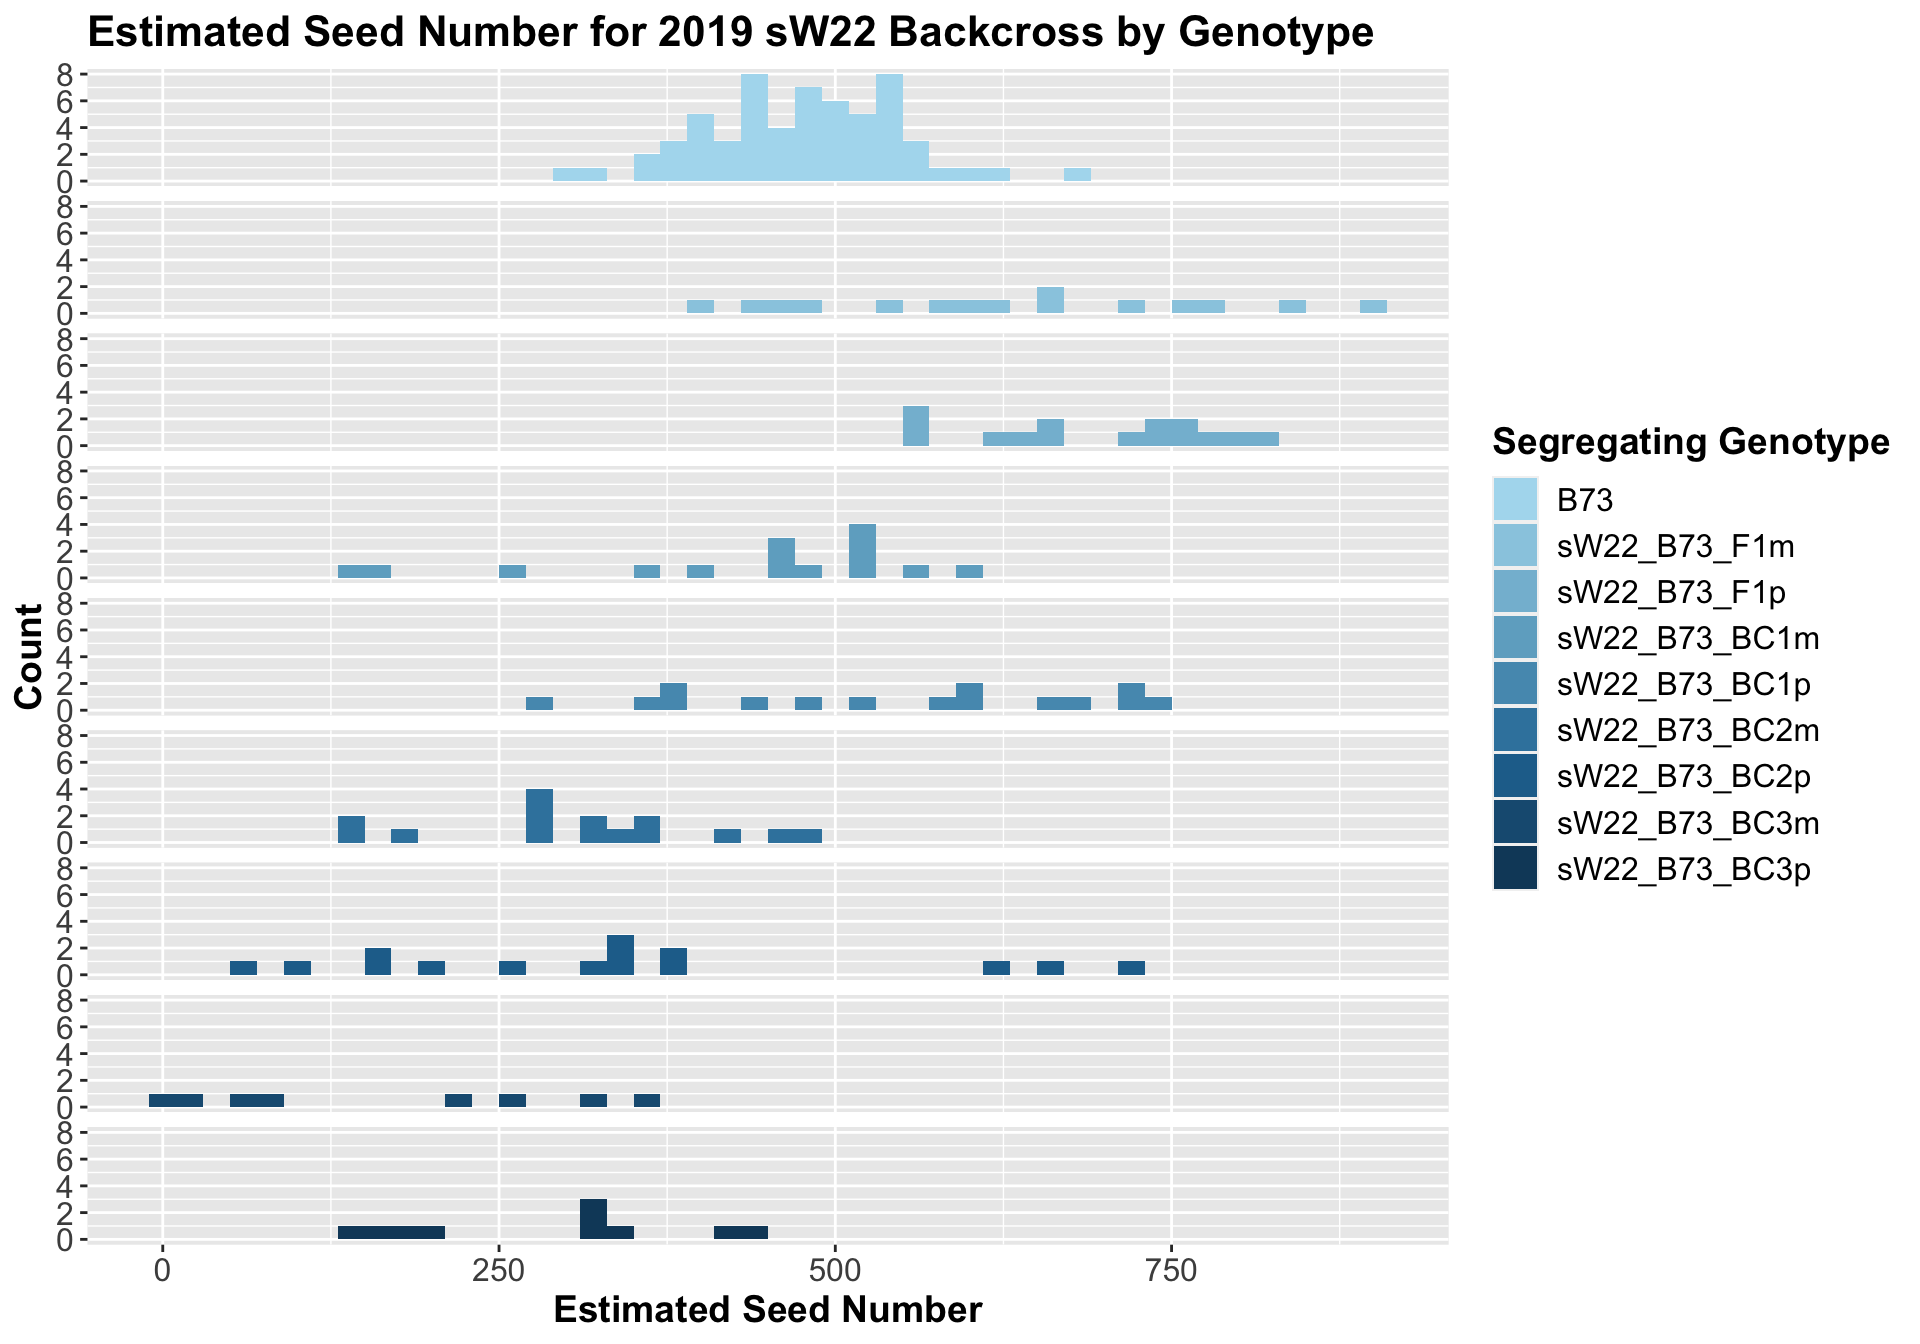
## 8 Ear_Trait B73 sW22_B73_BC3p 0.000248 1.50e-3 0.00025 *** T-testWe see an initial increase in the estimated seed number of the sW22_B73 F1s that continues to decline as we continue to backcross to B73. We also see that the sick paternal crosses have a higher seed number than the sick materal crosses. We can see if this holds if we separate the data by field.
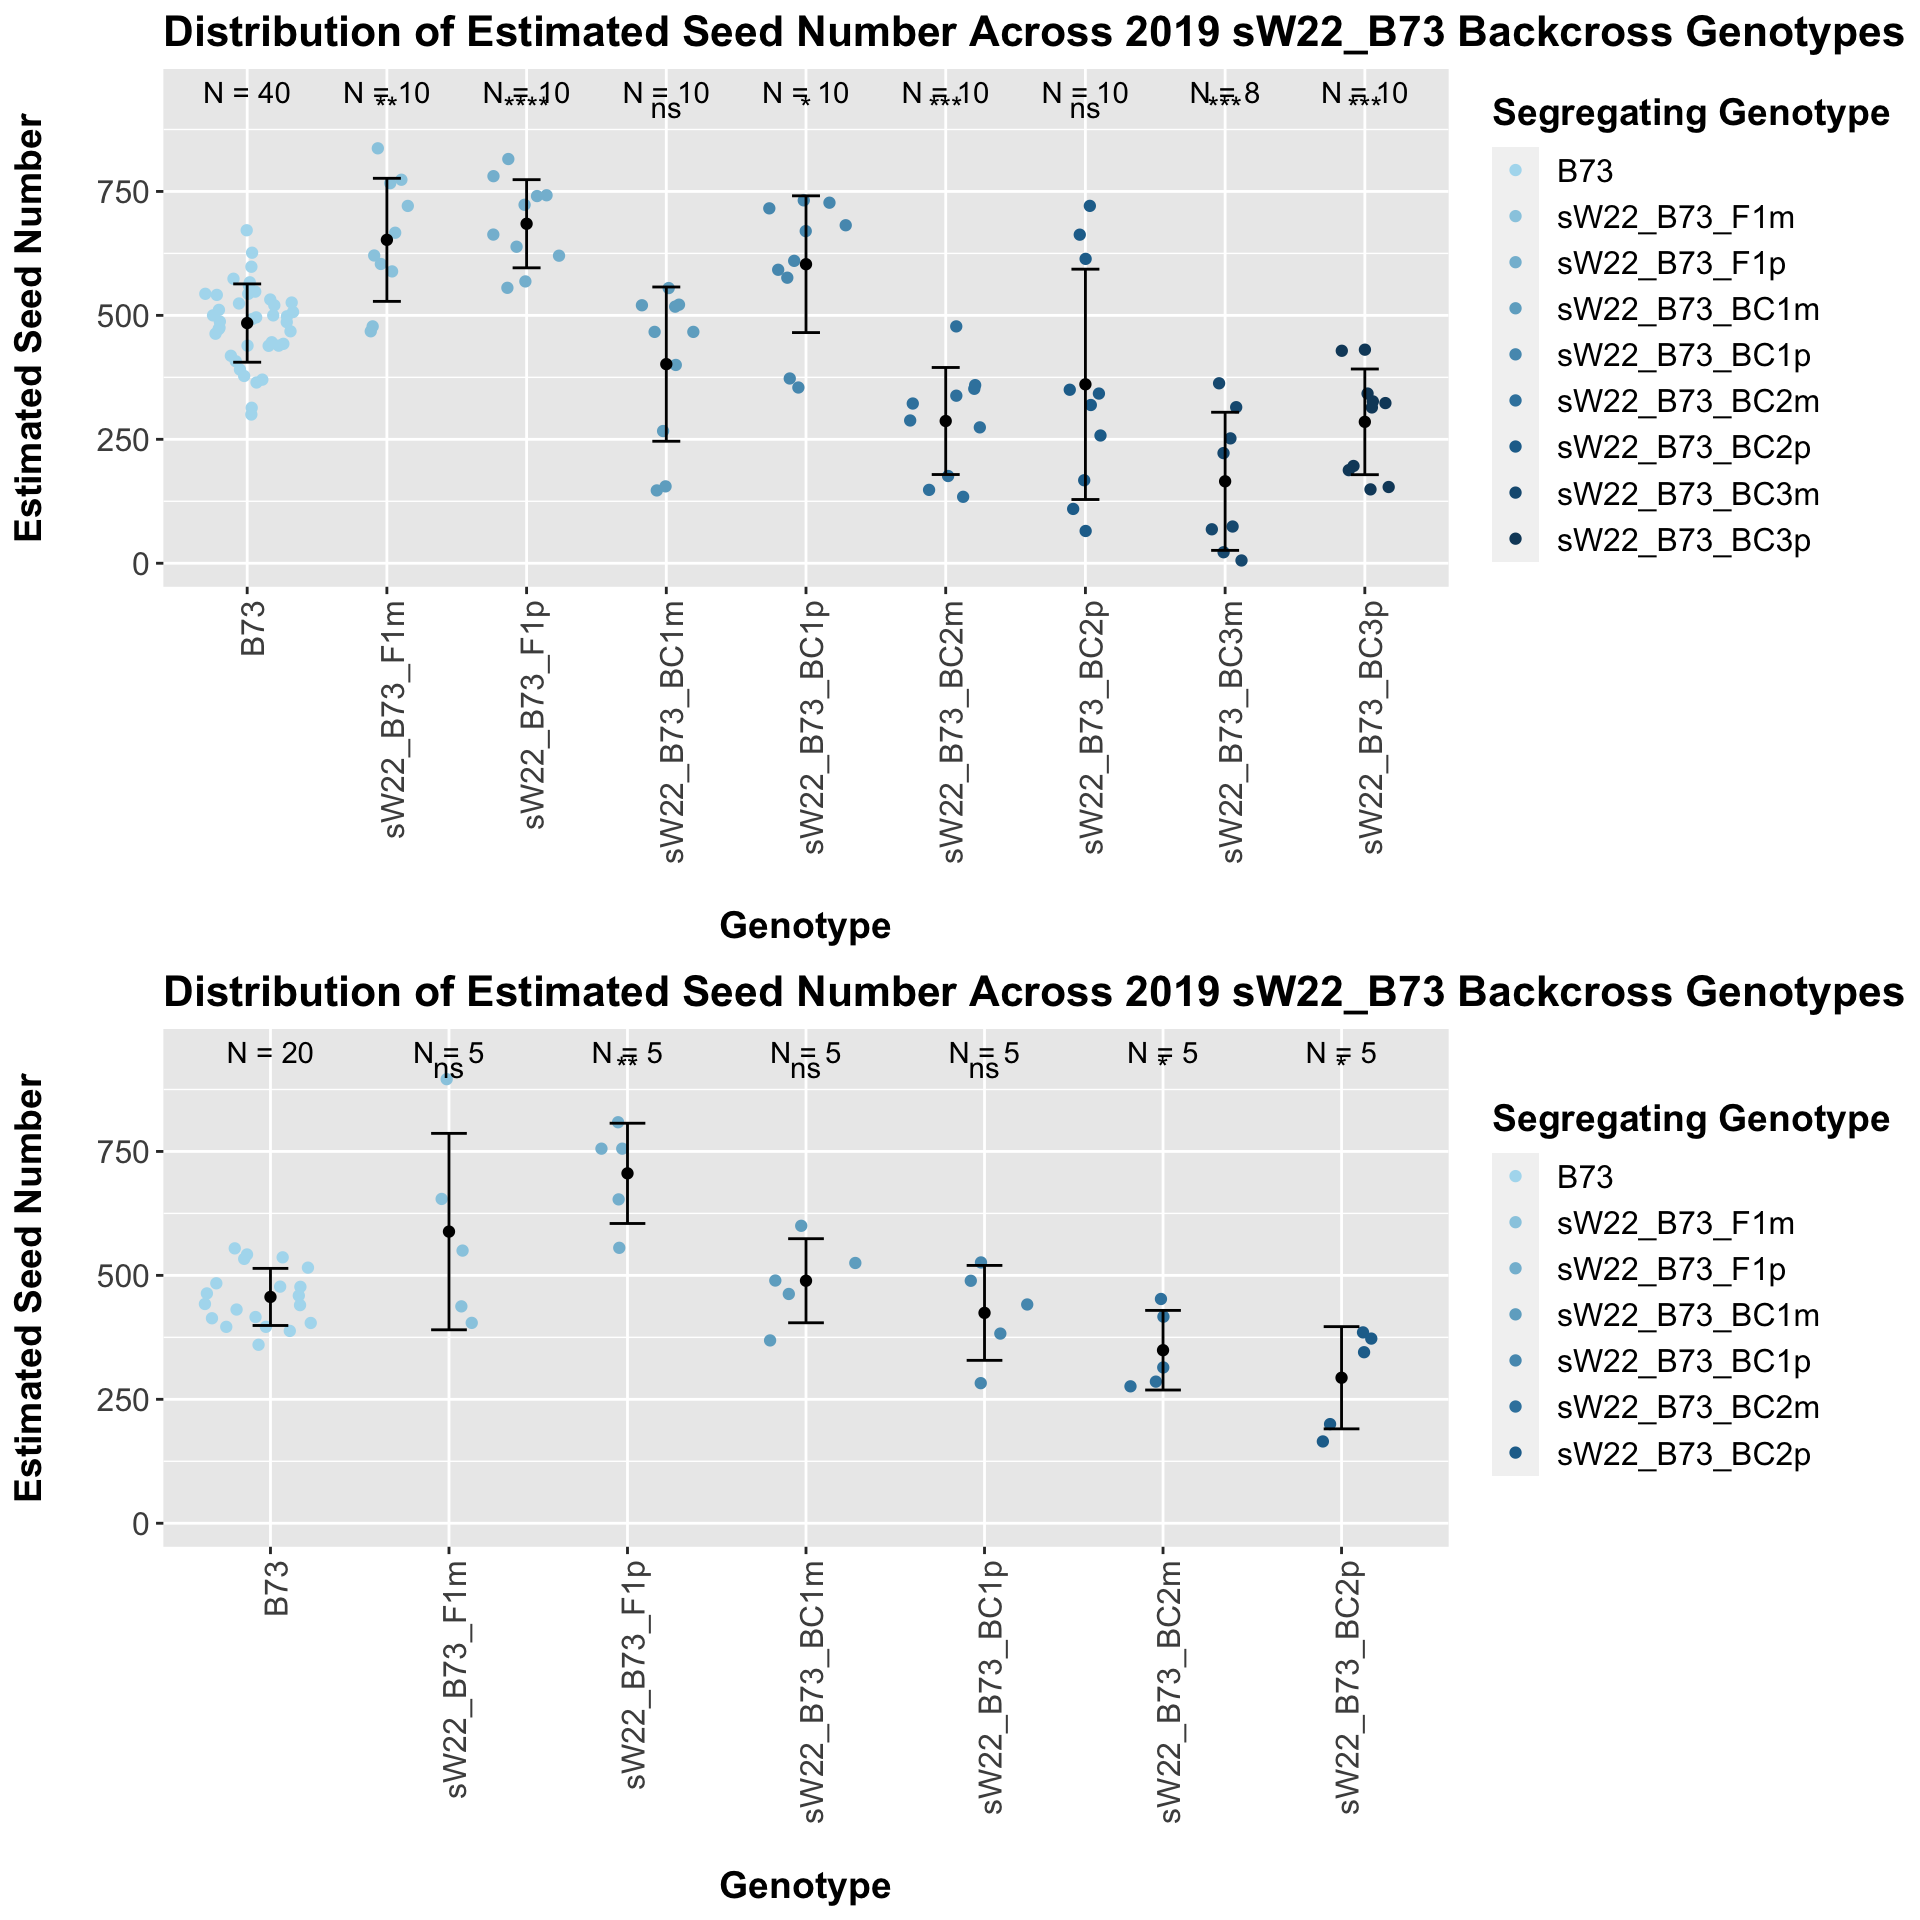
The general trend of an increase in seed number followed by a decline holds when we stratify the data by field. However, we do not see that the sick paternal crosses have a higher number than the sick maternal crosses in both fields. This trend holds in Field 1 but not in Field 2. We can compare the weight data across the W22 backcrossed to B73 rows to look at this set of controls.
##
##  Mean, SD, and SE for each genotype
## Seg_Genotype N mean sd se
## 1 B73 60 475.1650 73.26589 9.458586
## 2 W22_B73_BC1m 15 687.6800 85.40724 22.052054
## 3 W22_B73_BC1p 15 704.8000 106.03403 27.377869
## 4 W22_B73_BC2m 15 570.9200 81.19170 20.963606
## 5 W22_B73_BC2p 15 539.3733 99.78504 25.764386
## 6 W22_B73_BC3m 15 503.9467 94.43832 24.383870
## 7 W22_B73_BC3p 15 532.6133 75.72968 19.553319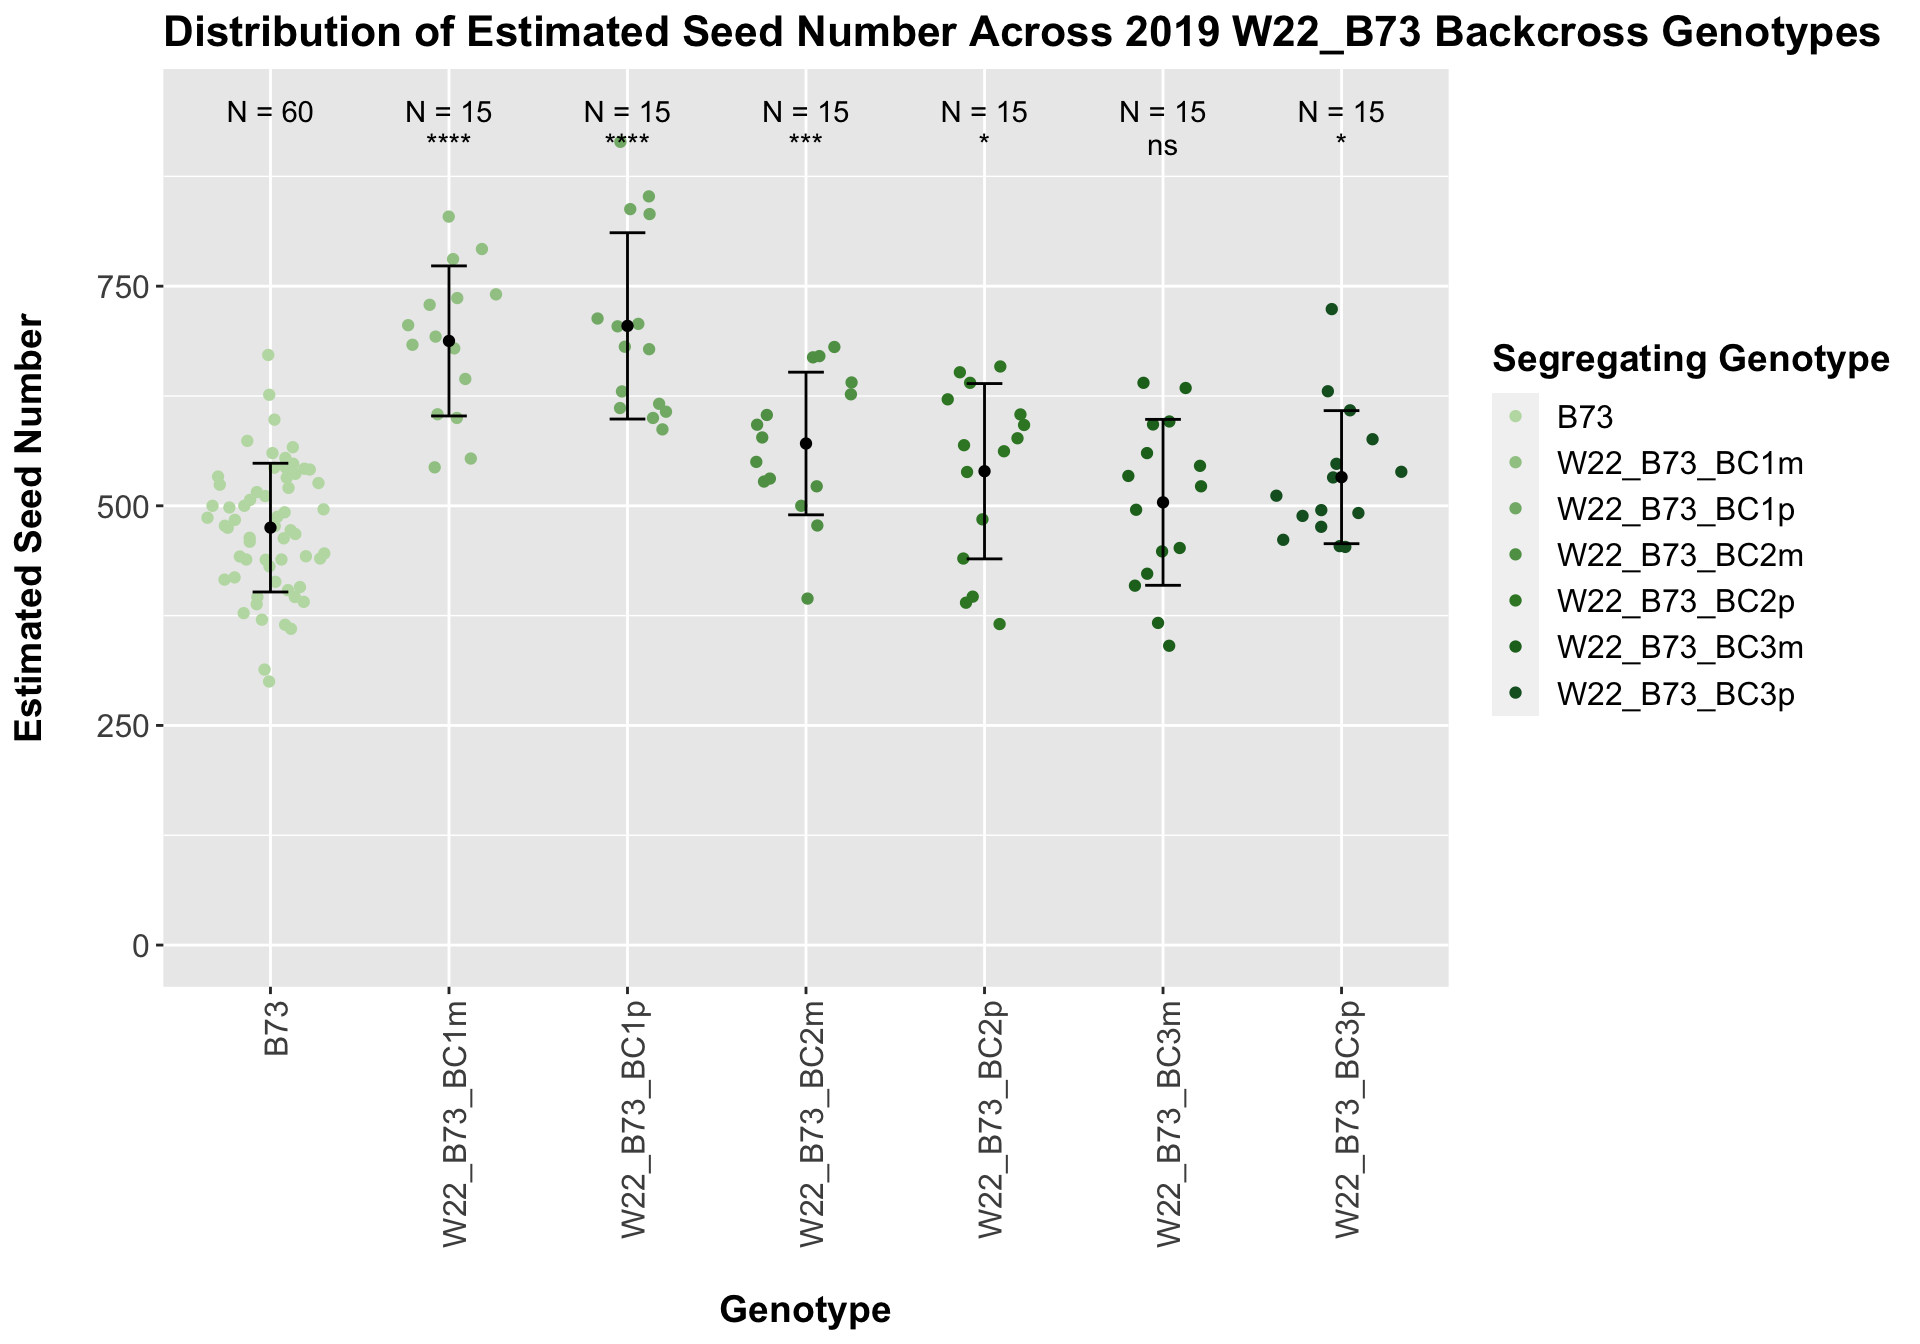
## # A tibble: 6 x 8
##   .y.       group1 group2                  p      p.adj p.format p.signif method
##   <chr>     <chr>  <chr>               <dbl>      <dbl> <chr>    <chr>    <chr>
## 1 Ear_Trait B73    W22_B73_BC1m 0.0000000293 0.00000018 2.9e-08  ****     T-test
## 2 Ear_Trait B73    W22_B73_BC1p 0.000000341  0.0000017  3.4e-07  ****     T-test
## 3 Ear_Trait B73    W22_B73_BC2m 0.000476     0.0019     0.00048  ***      T-test
## 4 Ear_Trait B73    W22_B73_BC2p 0.0311       0.062      0.03107  *        T-test
## 5 Ear_Trait B73    W22_B73_BC3m 0.285        0.290      0.28530  ns       T-test
## 6 Ear_Trait B73    W22_B73_BC3p 0.0151       0.045      0.01513  *        T-test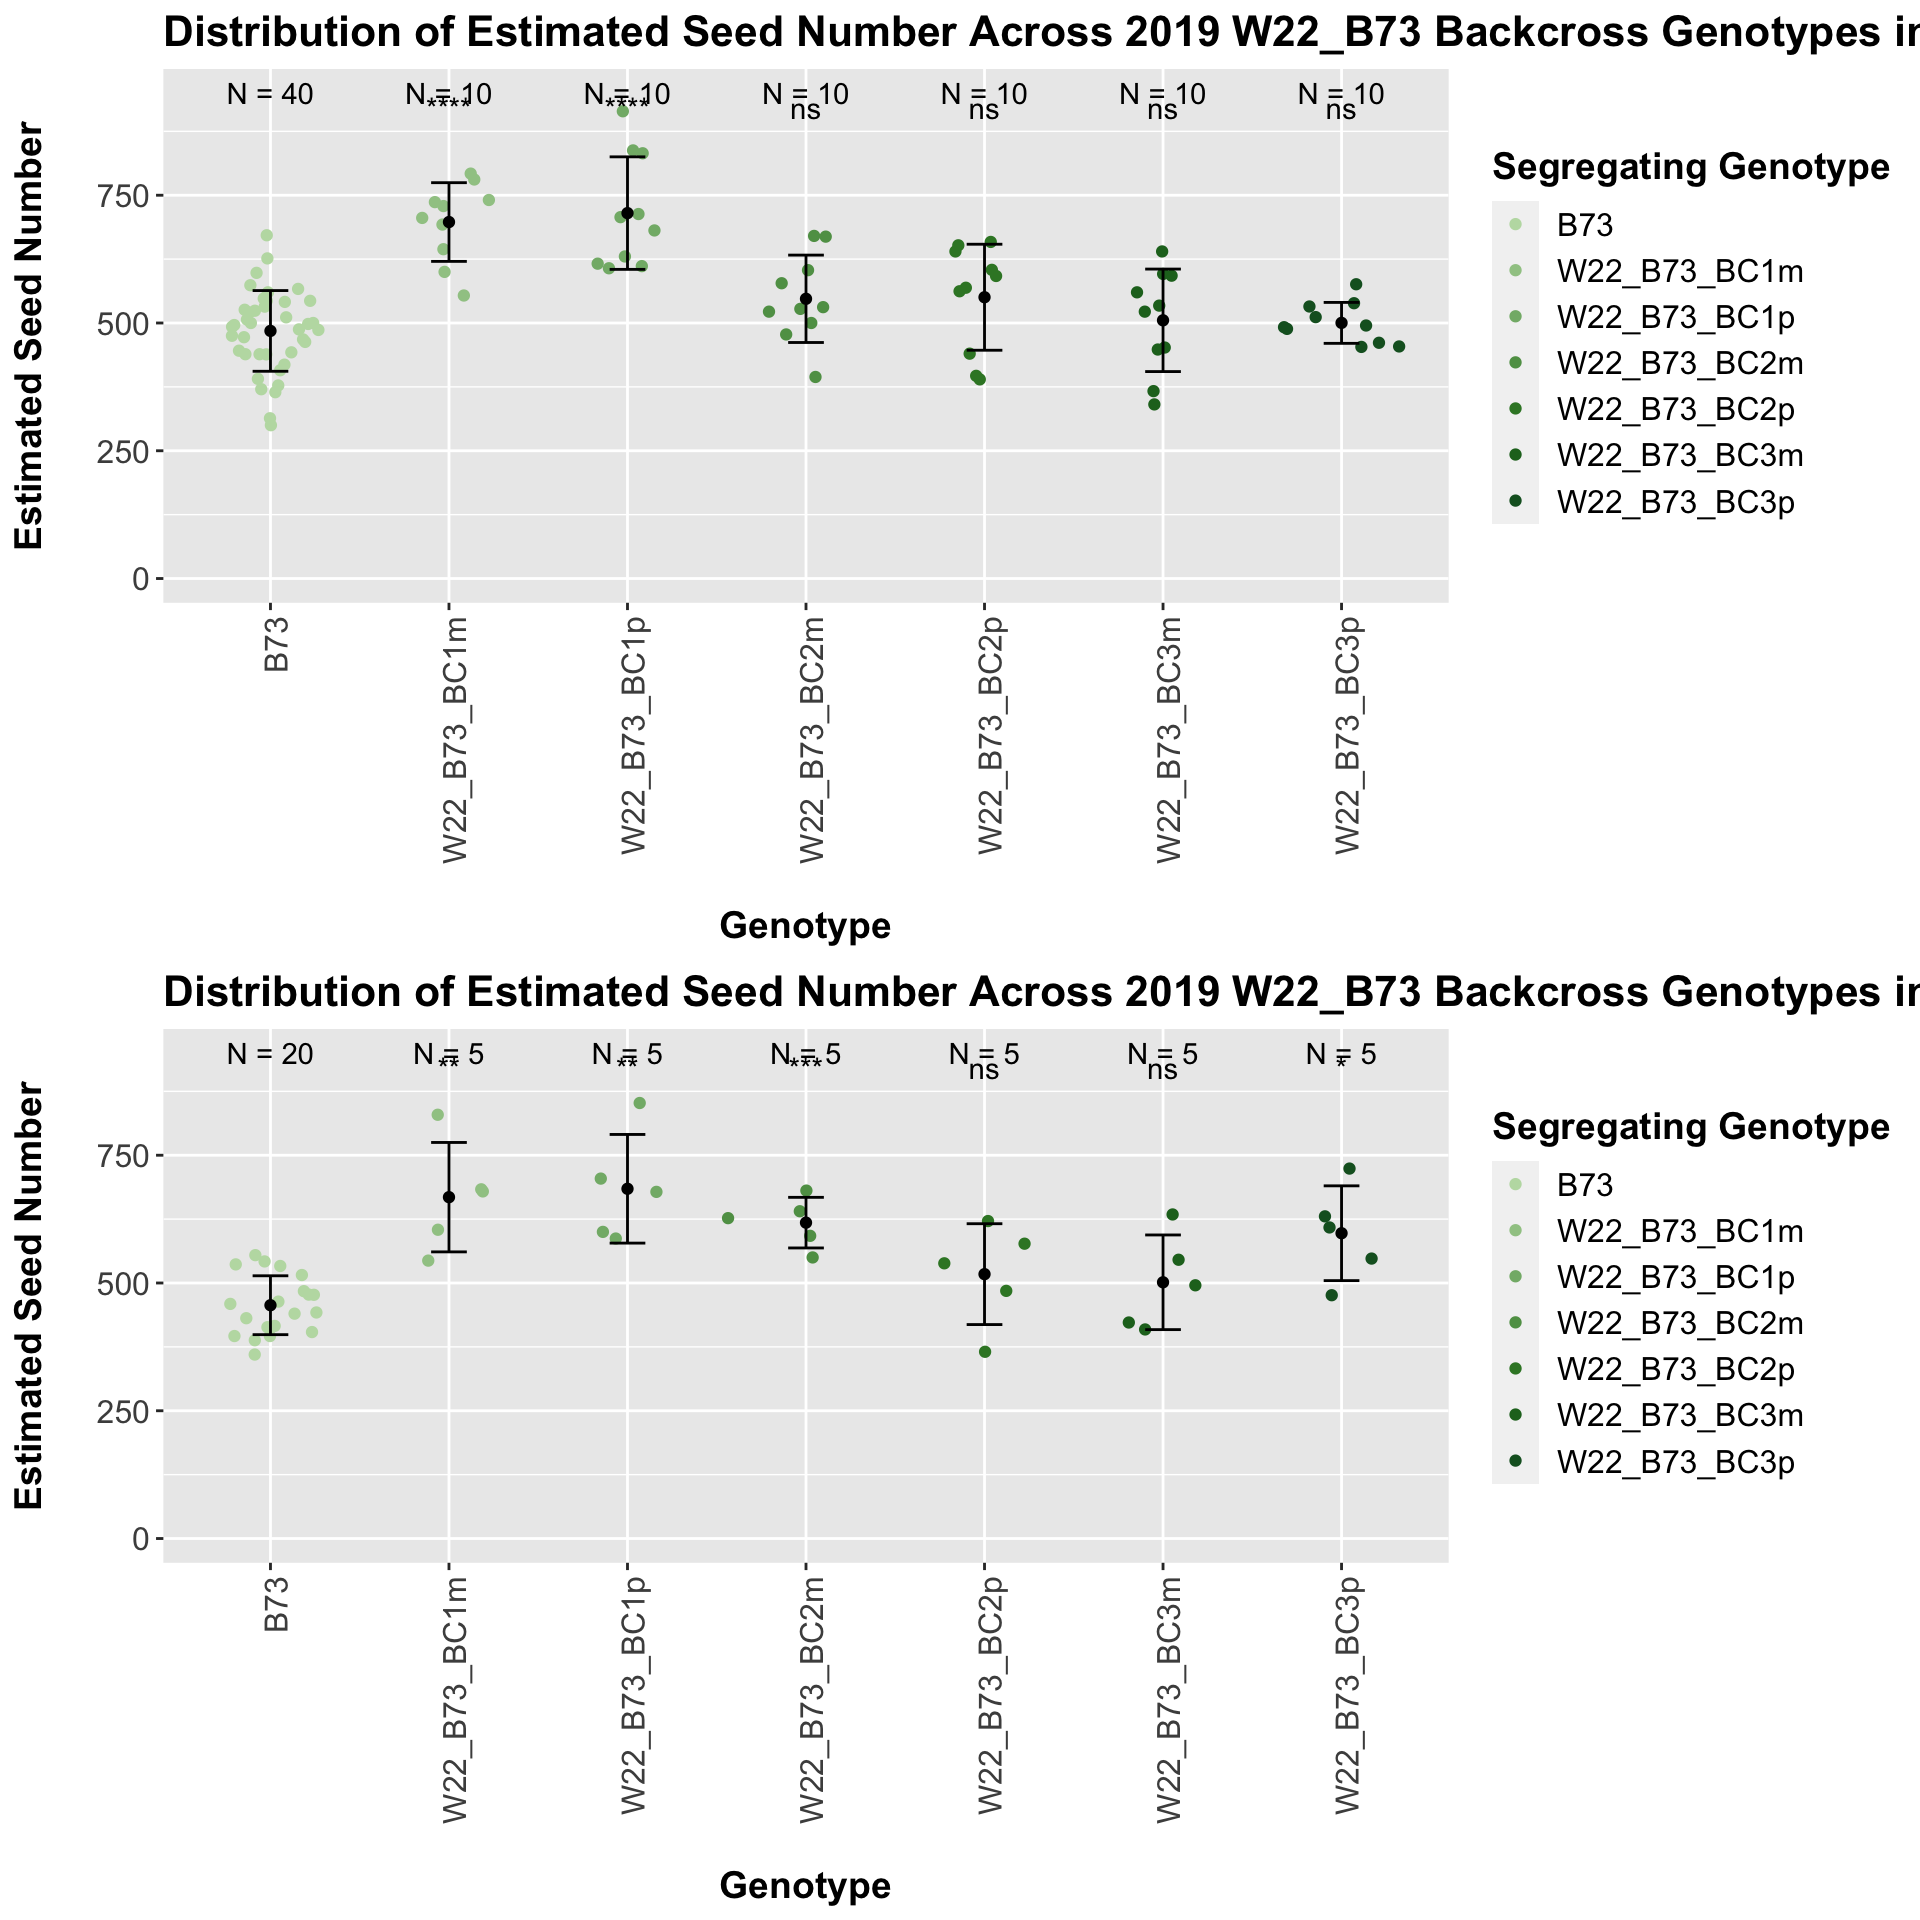
We see a similar increase in estimated seed number for the W22_B73 F1s that declines as we keep backcrossing until there is little difference between the estimated seed number of the later generation backcrosses and B73.
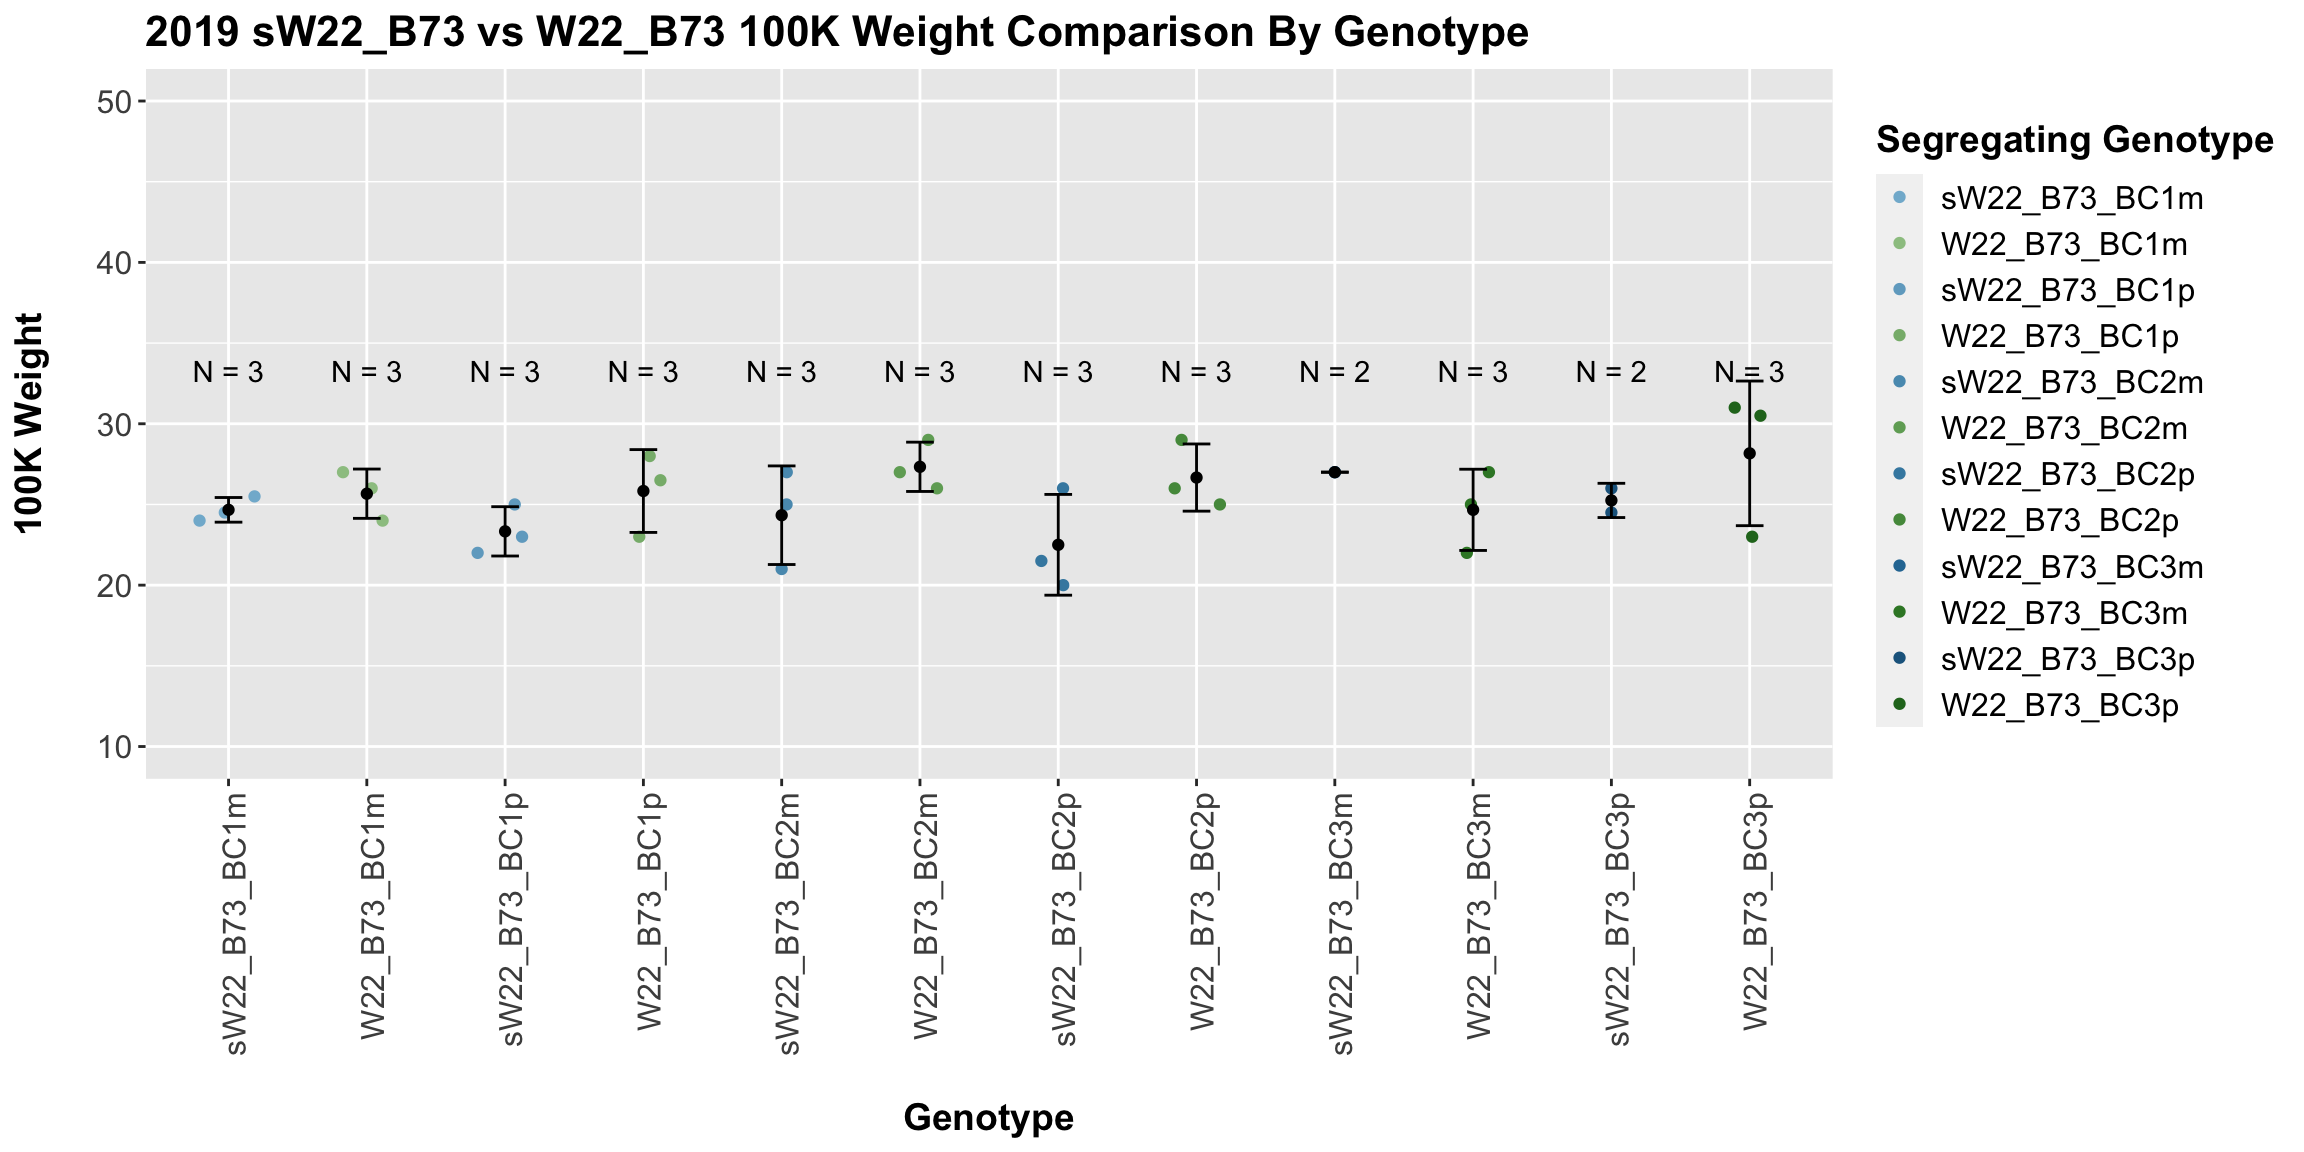
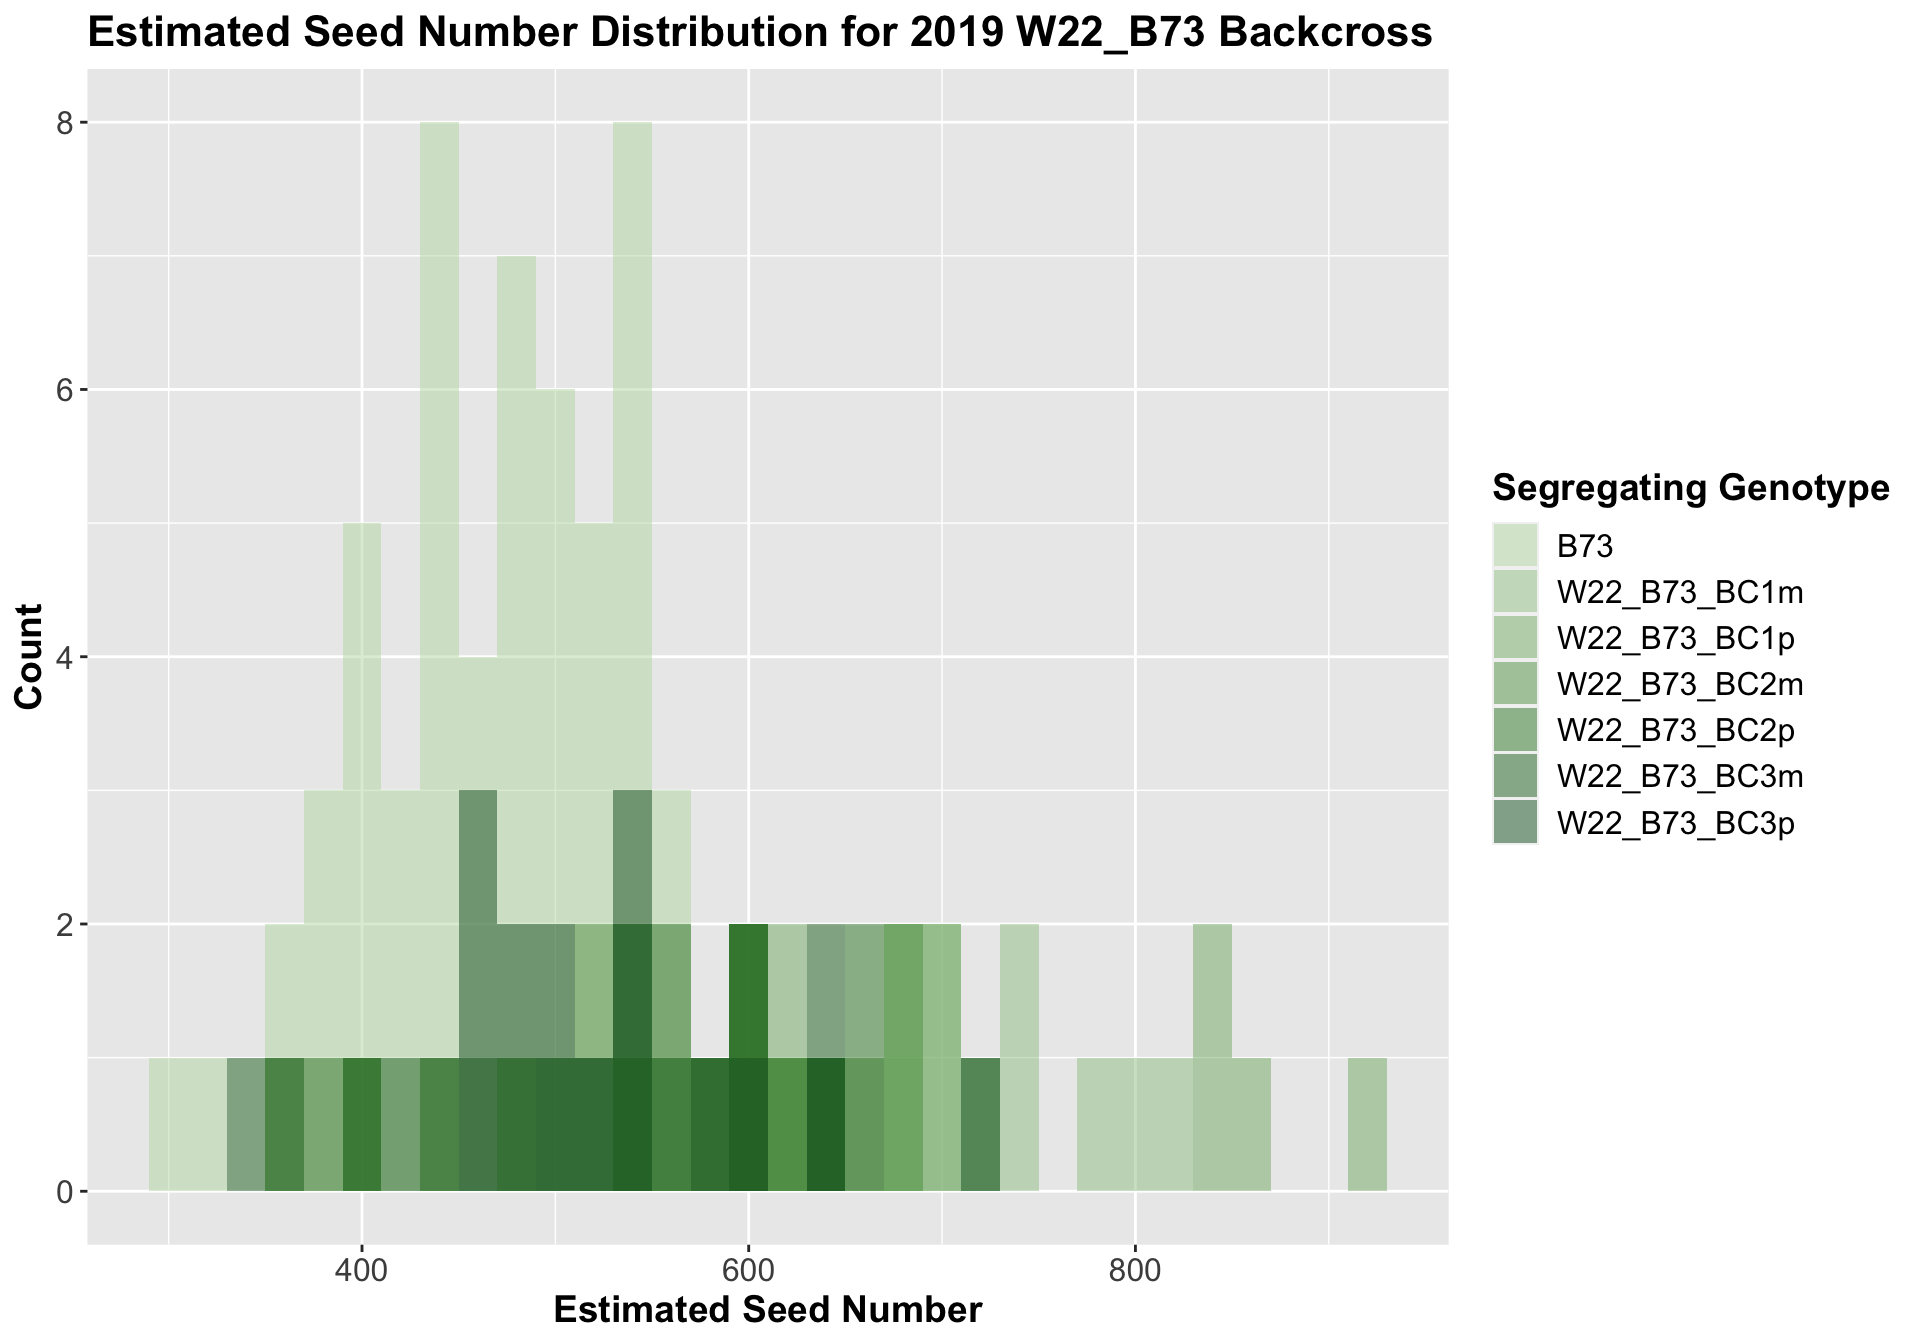
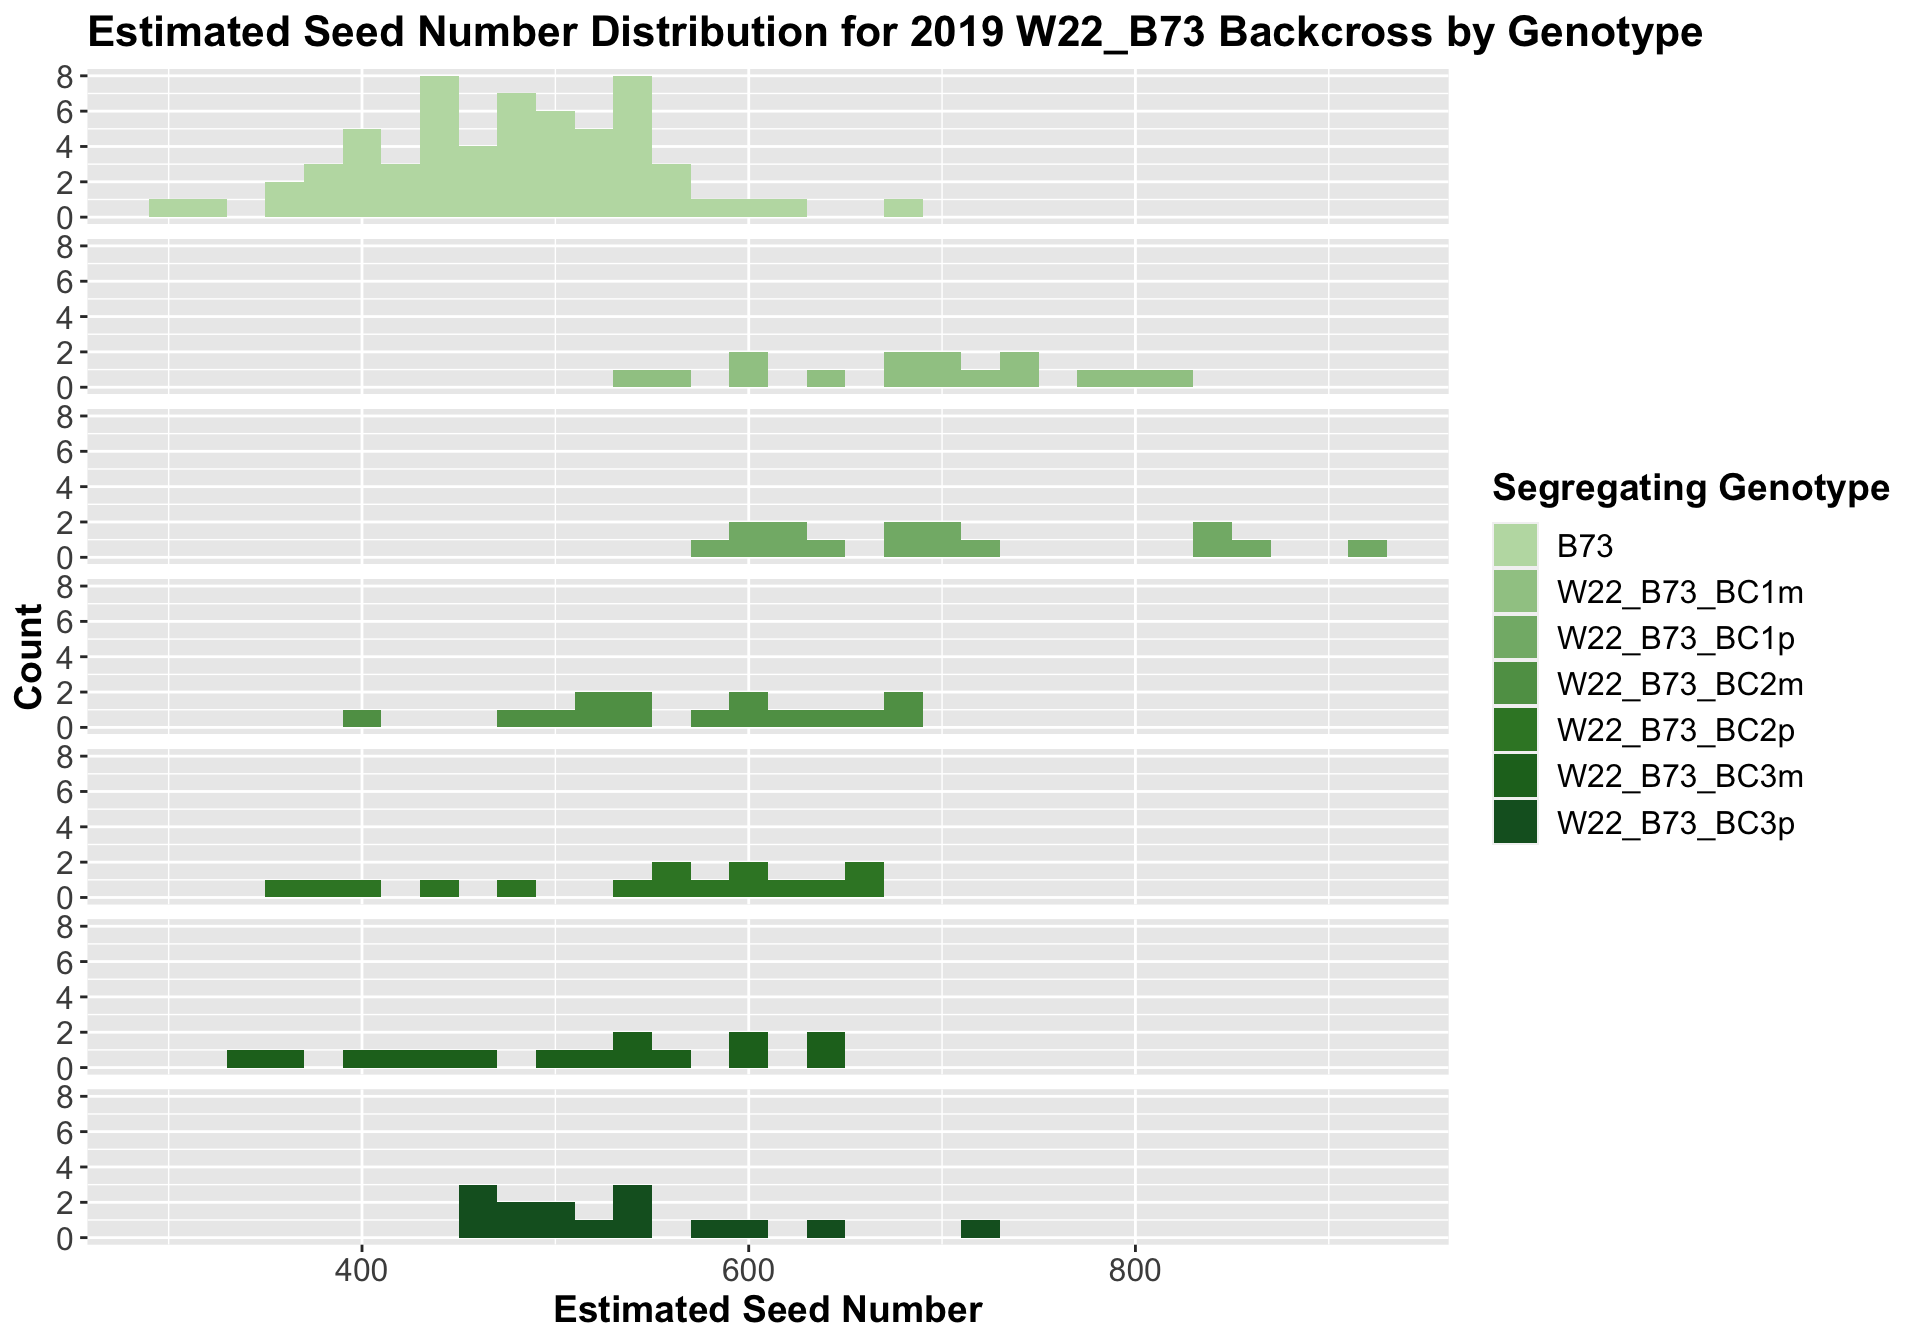
We may also compare the distribution for sW22_B73 backcrosses to W22_B73 backcrosses and each generation compares across these two sets. Note: when looking at these plots, just be aware that the genotypes don't align perfectly across backcrosses because we don't have a few crosses for the W22_B73 genotypes.
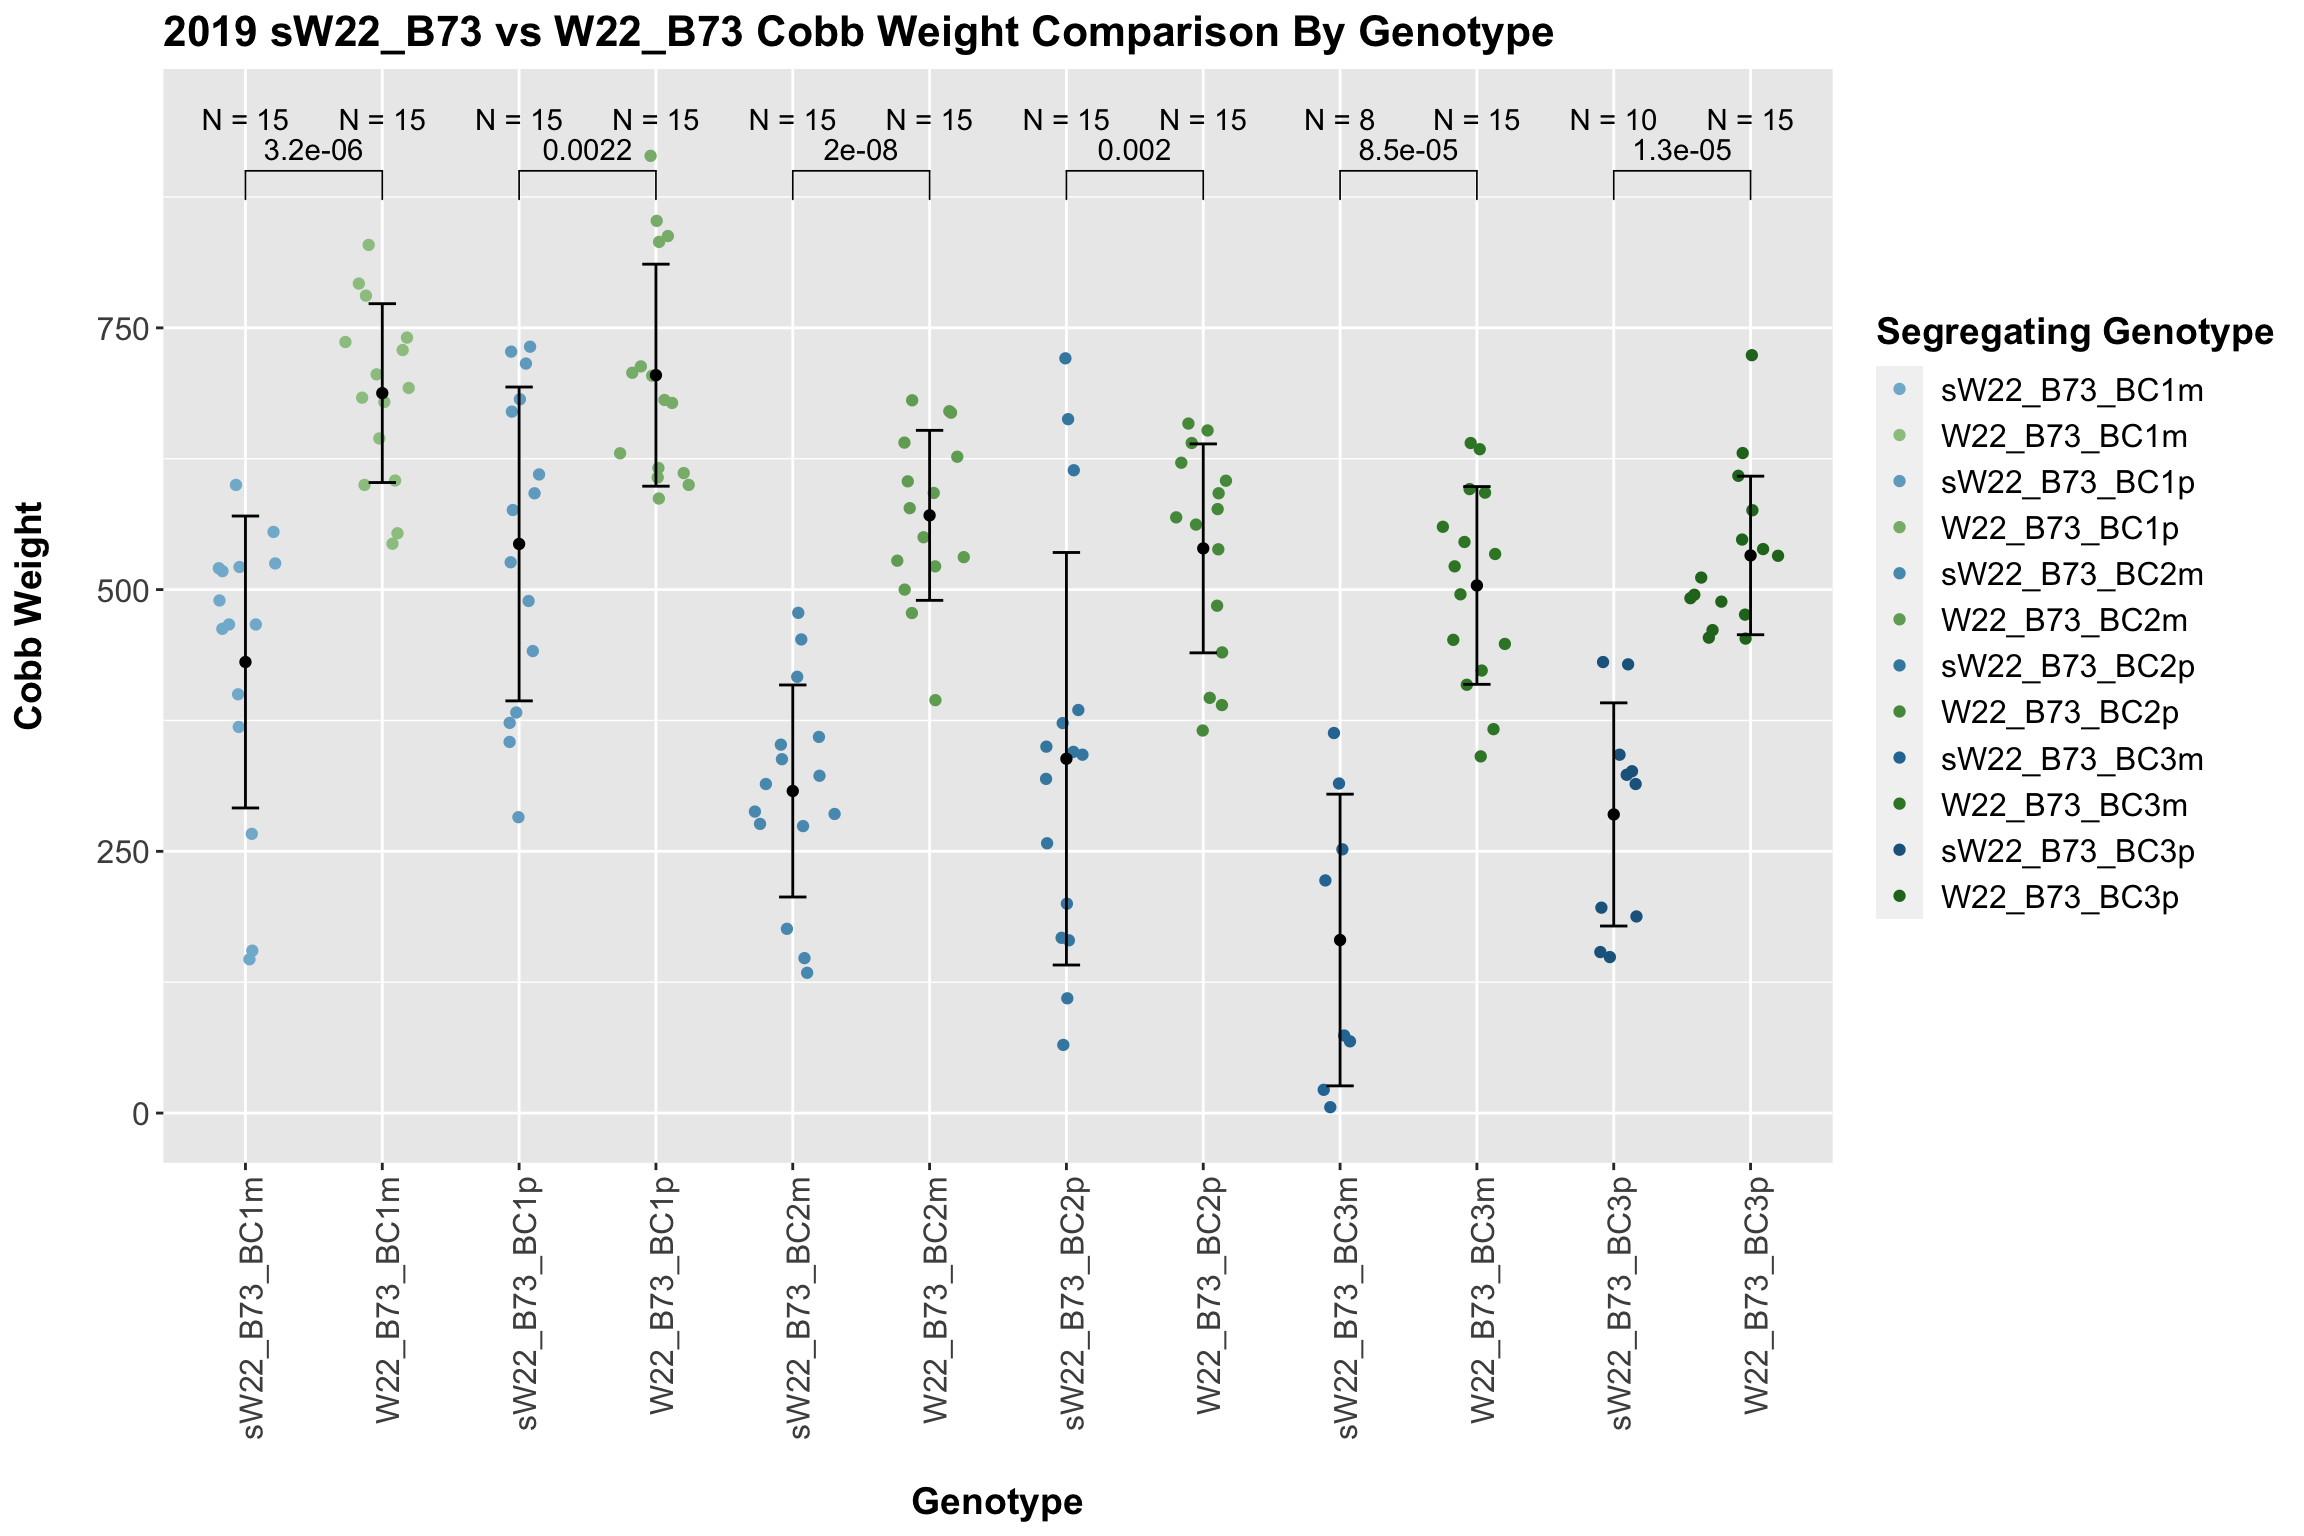
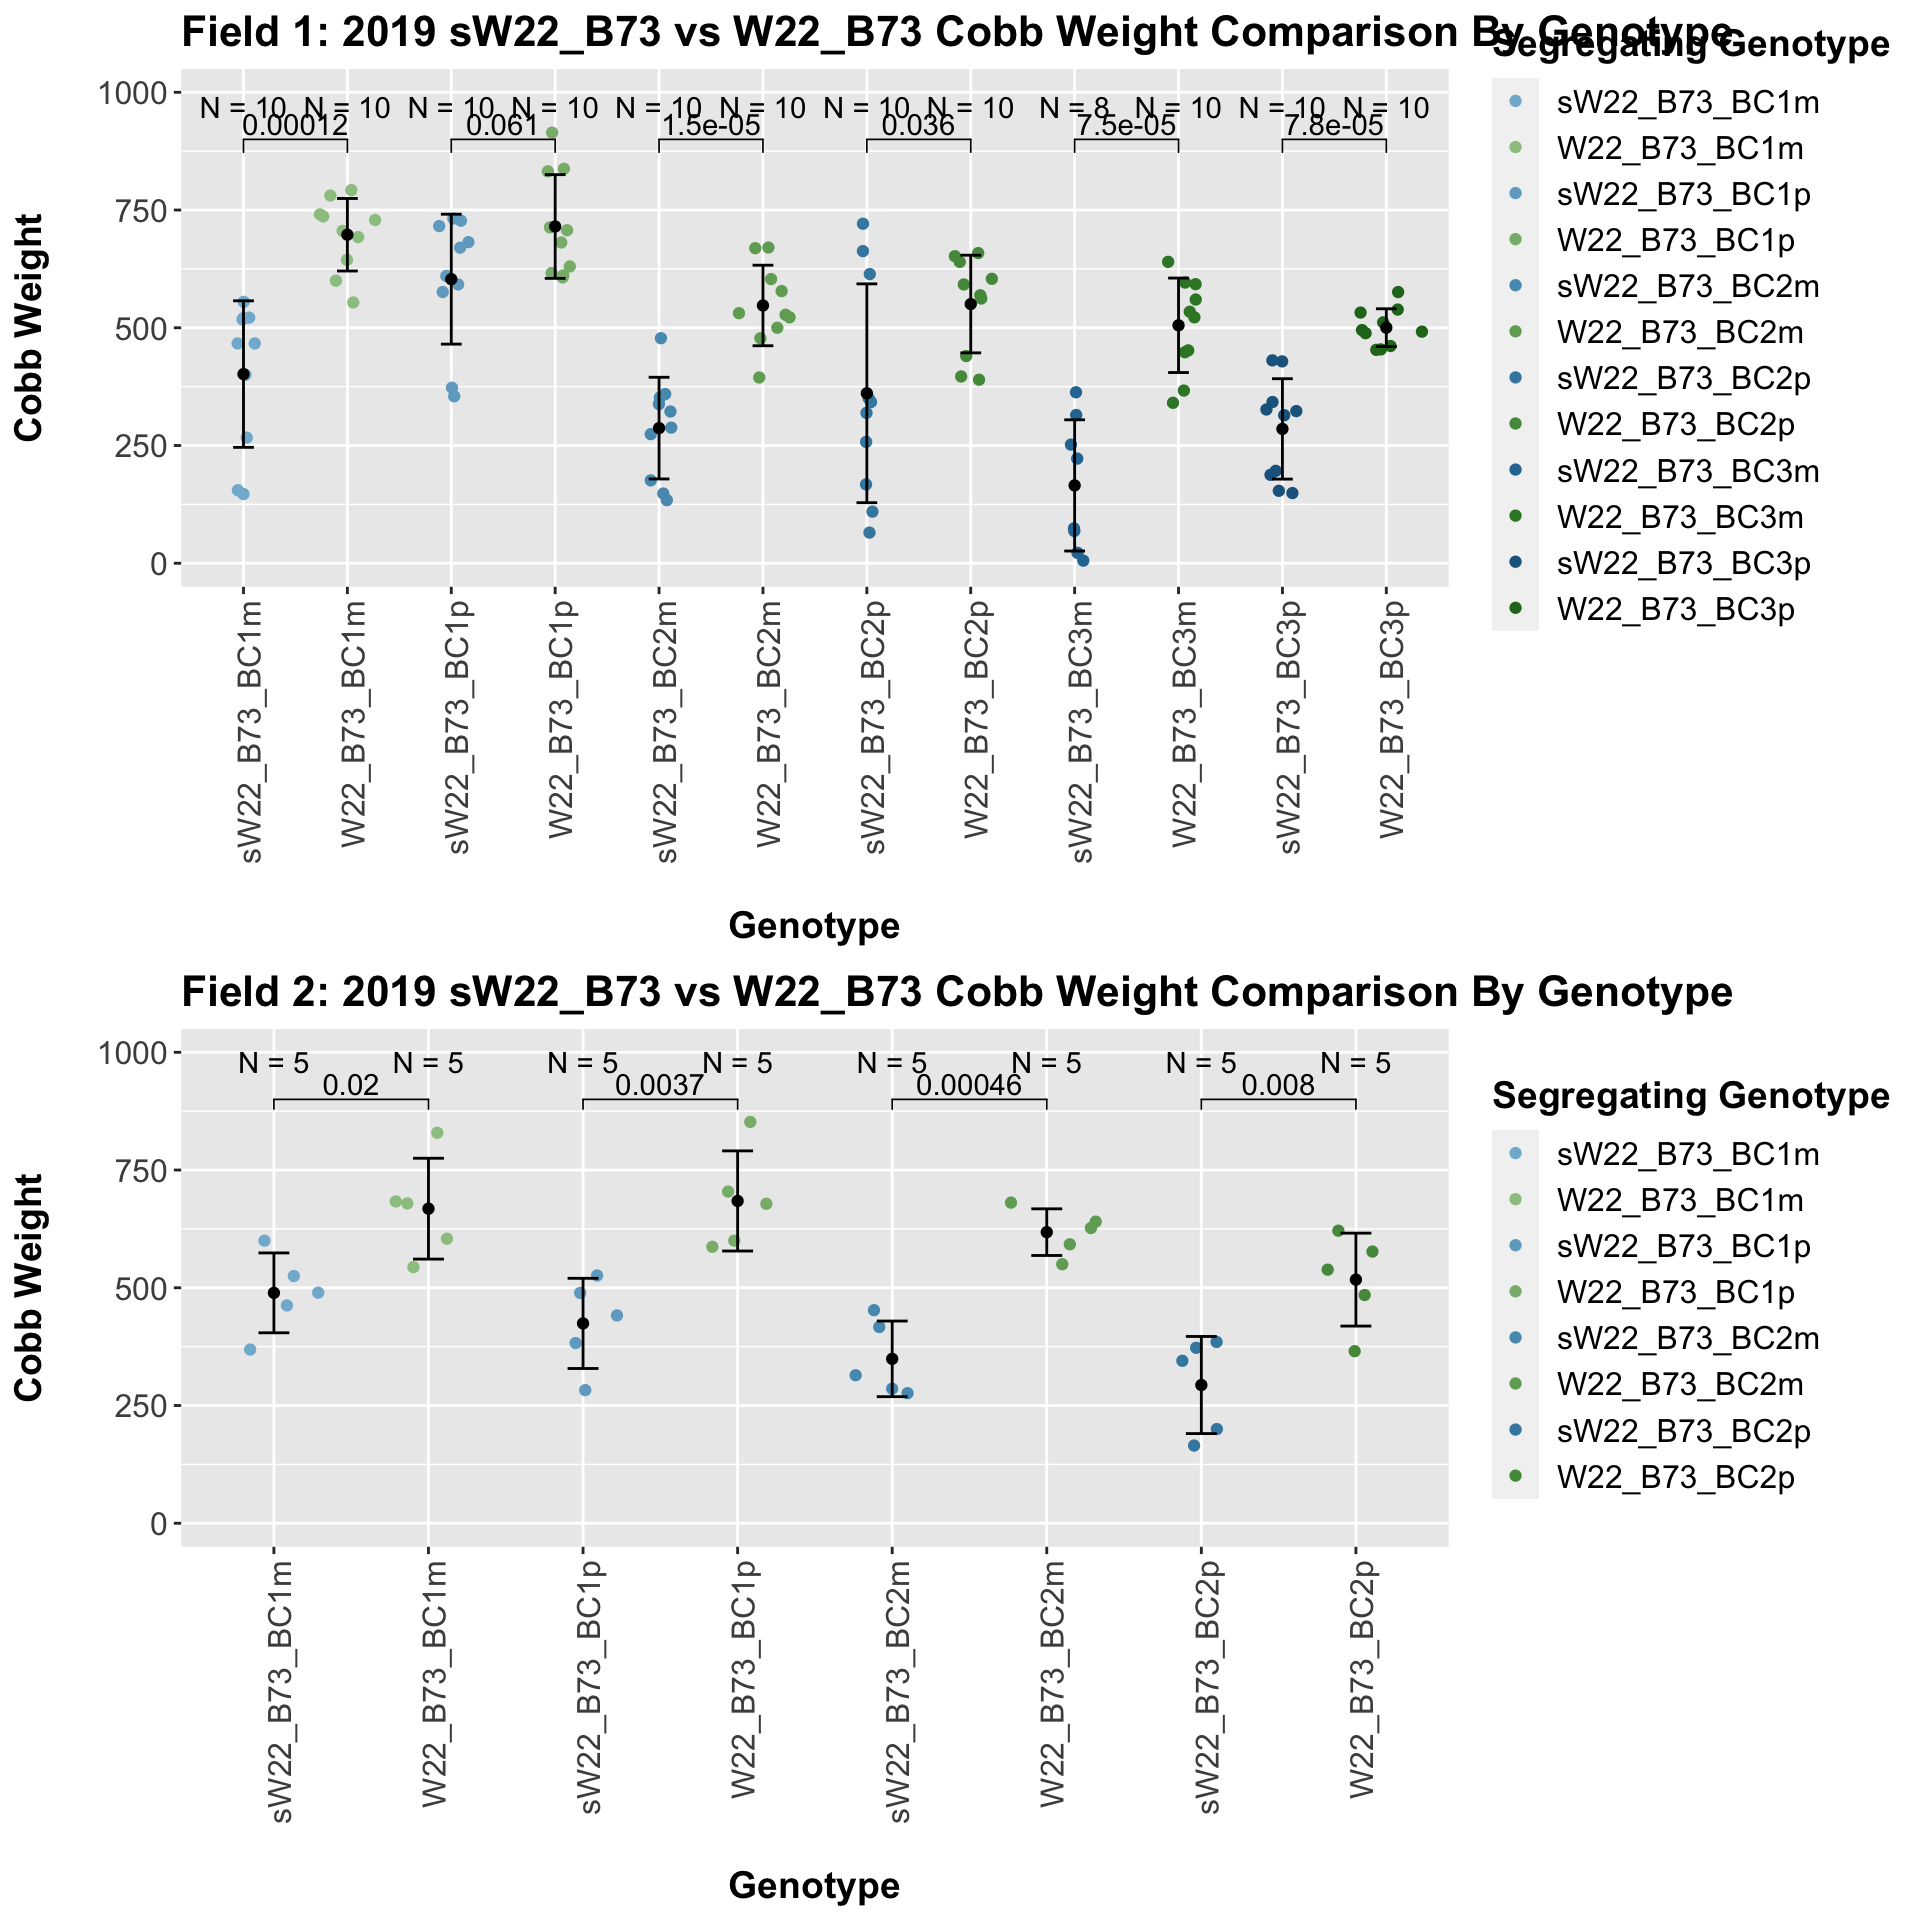
For the most part, we find that there is a significant difference between the sW22_B73 and W22_B73 backcross at each generation. The sW22 backcrosses consistently show reduced estimated seed number compared to the W22 backcrosses.
8.2.3 2019 sW22 and W22 backcrossed to Mo17
##
##  Mean, SD, and SE for each genotype
## Seg_Genotype N mean sd se
## 1 Mo17 60 347.1383 57.85553 7.469117
## 2 sW22_Mo17_F1m 15 408.8800 111.87449 28.885869
## 3 sW22_Mo17_F1p 15 406.9533 94.56248 24.415927
## 4 sW22_Mo17_BC1m 15 287.8867 162.72100 42.014382
## 5 sW22_Mo17_BC1p 15 354.8733 114.91066 29.669806
## 6 sW22_Mo17_BC2m 15 245.7600 119.66157 30.896484
## 7 sW22_Mo17_BC2p 14 163.0643 102.79209 27.472341
## 8 sW22_Mo17_BC3m 10 324.4000 104.91015 33.175503
## 9 sW22_Mo17_BC3p 15 242.3867 88.90161 22.954296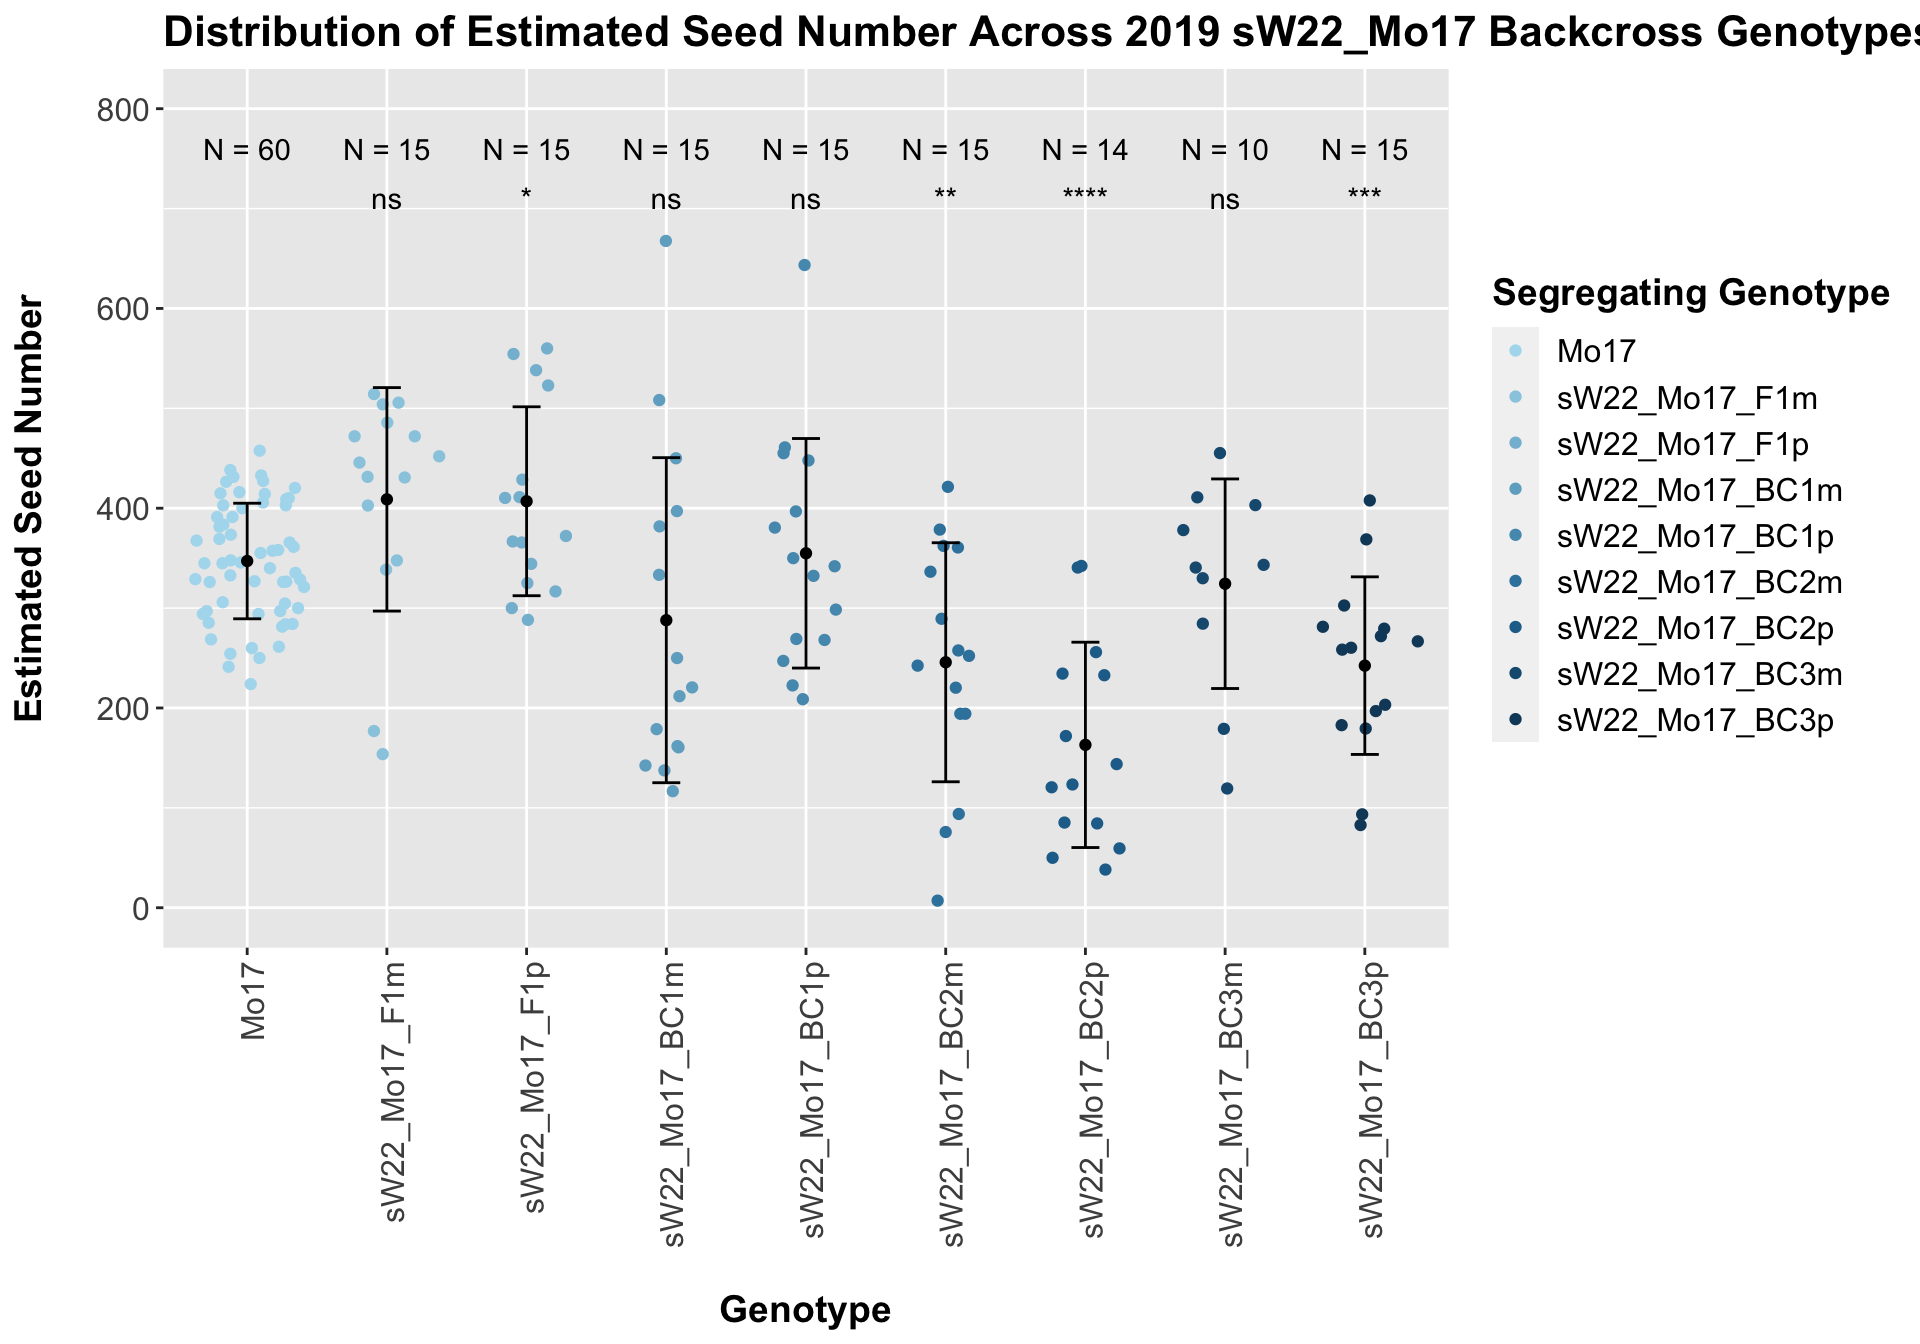
## # A tibble: 8 x 8
## .y. group1 group2 p p.adj p.format p.signif method
## <chr> <chr> <chr> <dbl> <dbl> <chr> <chr> <chr>
## 1 Ear_Trait Mo17 sW22_Mo17_F1m 0.0551 0.22 0.05515 ns T-test
## 2 Ear_Trait Mo17 sW22_Mo17_F1p 0.0318 0.16 0.03180 * T-test
## 3 Ear_Trait Mo17 sW22_Mo17_BC1m 0.185 0.56 0.18540 ns T-test
## 4 Ear_Trait Mo17 sW22_Mo17_BC1p 0.804 1 0.80367 ns T-test
## 5 Ear_Trait Mo17 sW22_Mo17_BC2m 0.00583 0.035 0.00583 ** T-test
## 6 Ear_Trait Mo17 sW22_Mo17_BC2p 0.0000107 0.000086 1.1e-05 **** T-test
## 7 Ear_Trait Mo17 sW22_Mo17_BC3m 0.519 1 0.51895 ns T-test
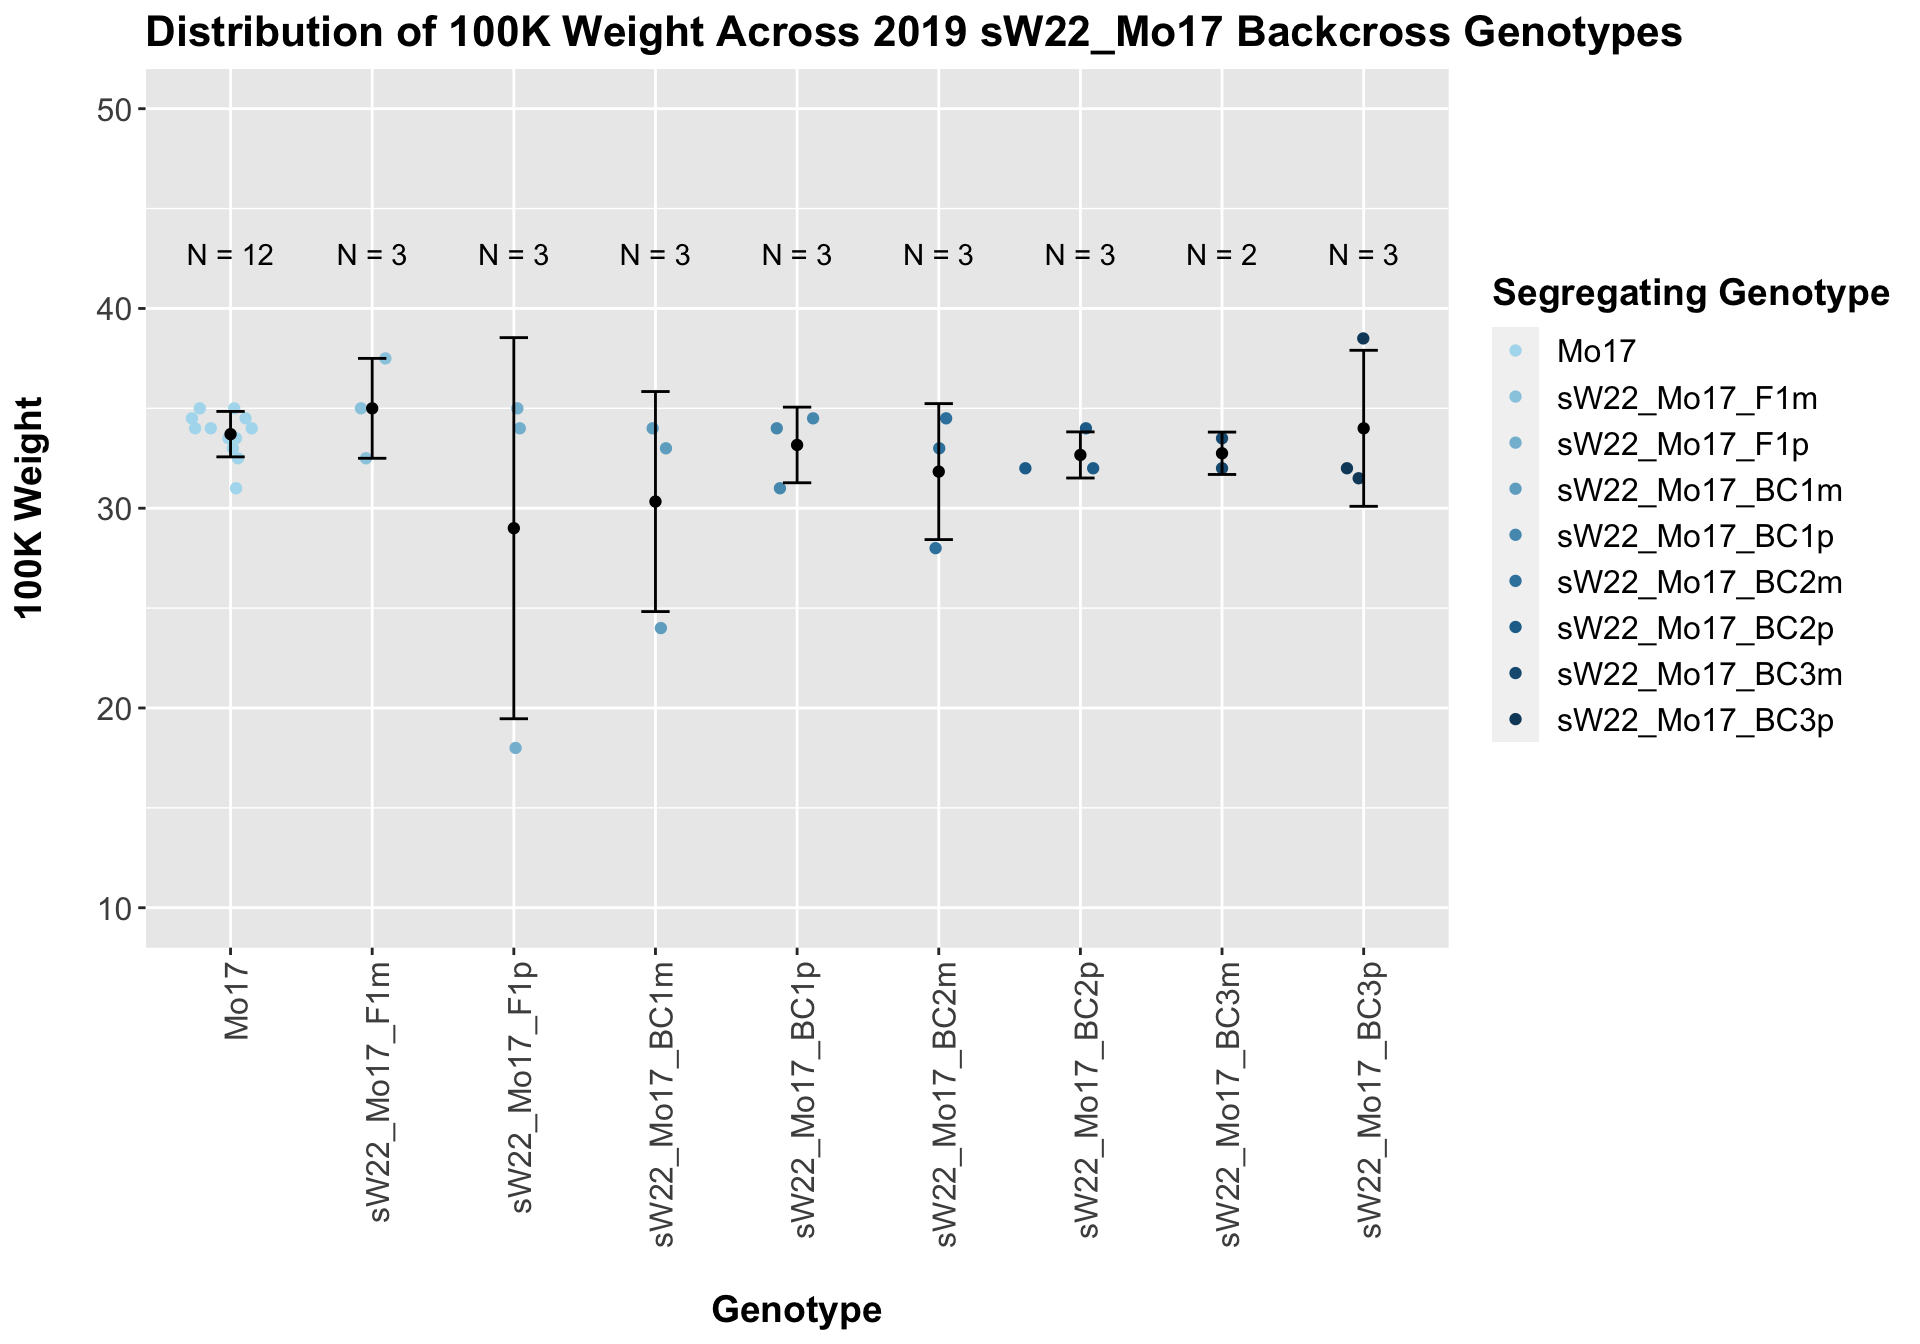
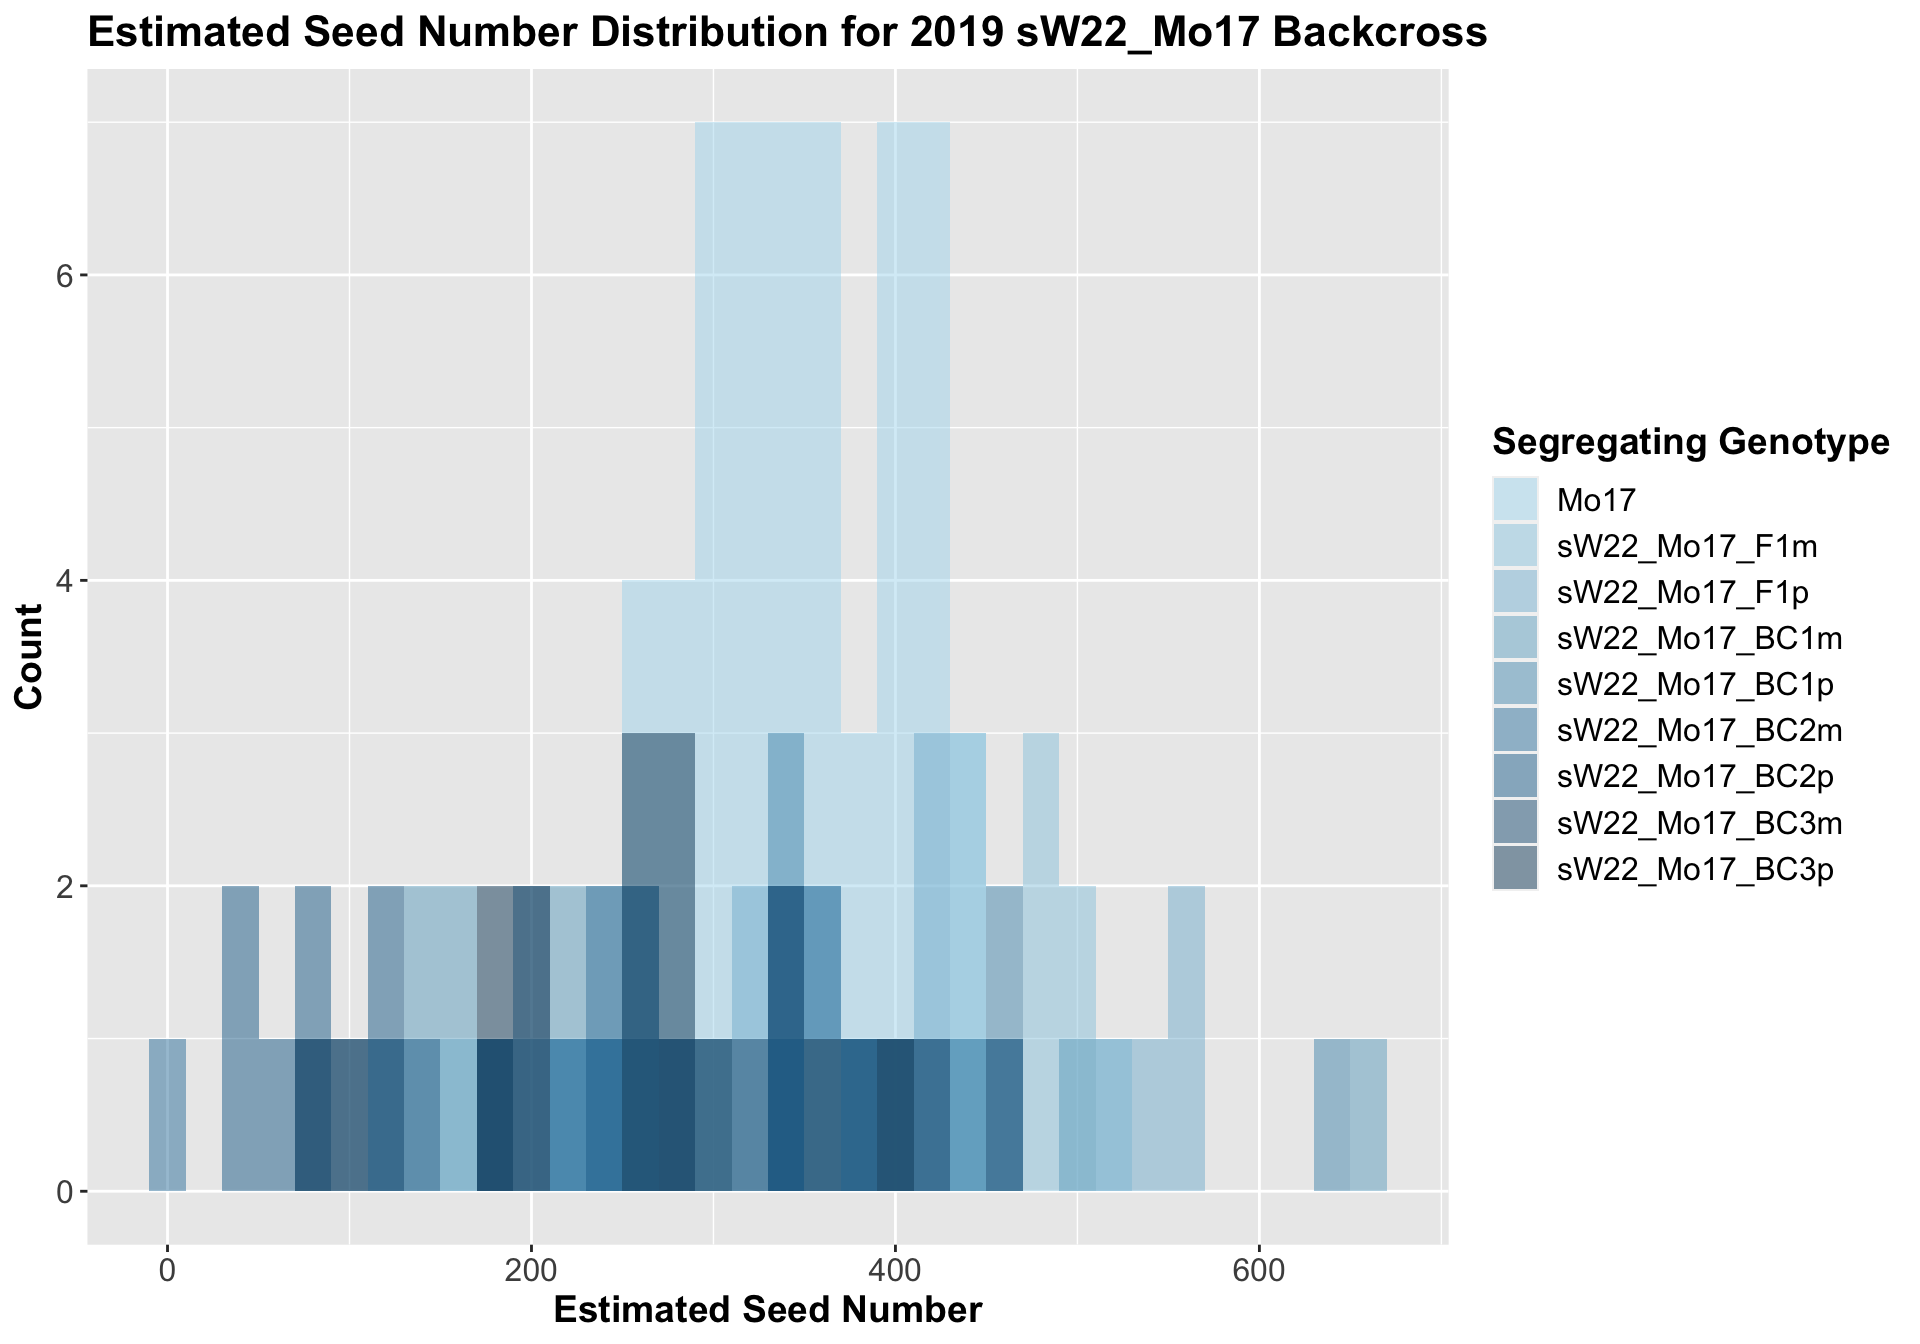
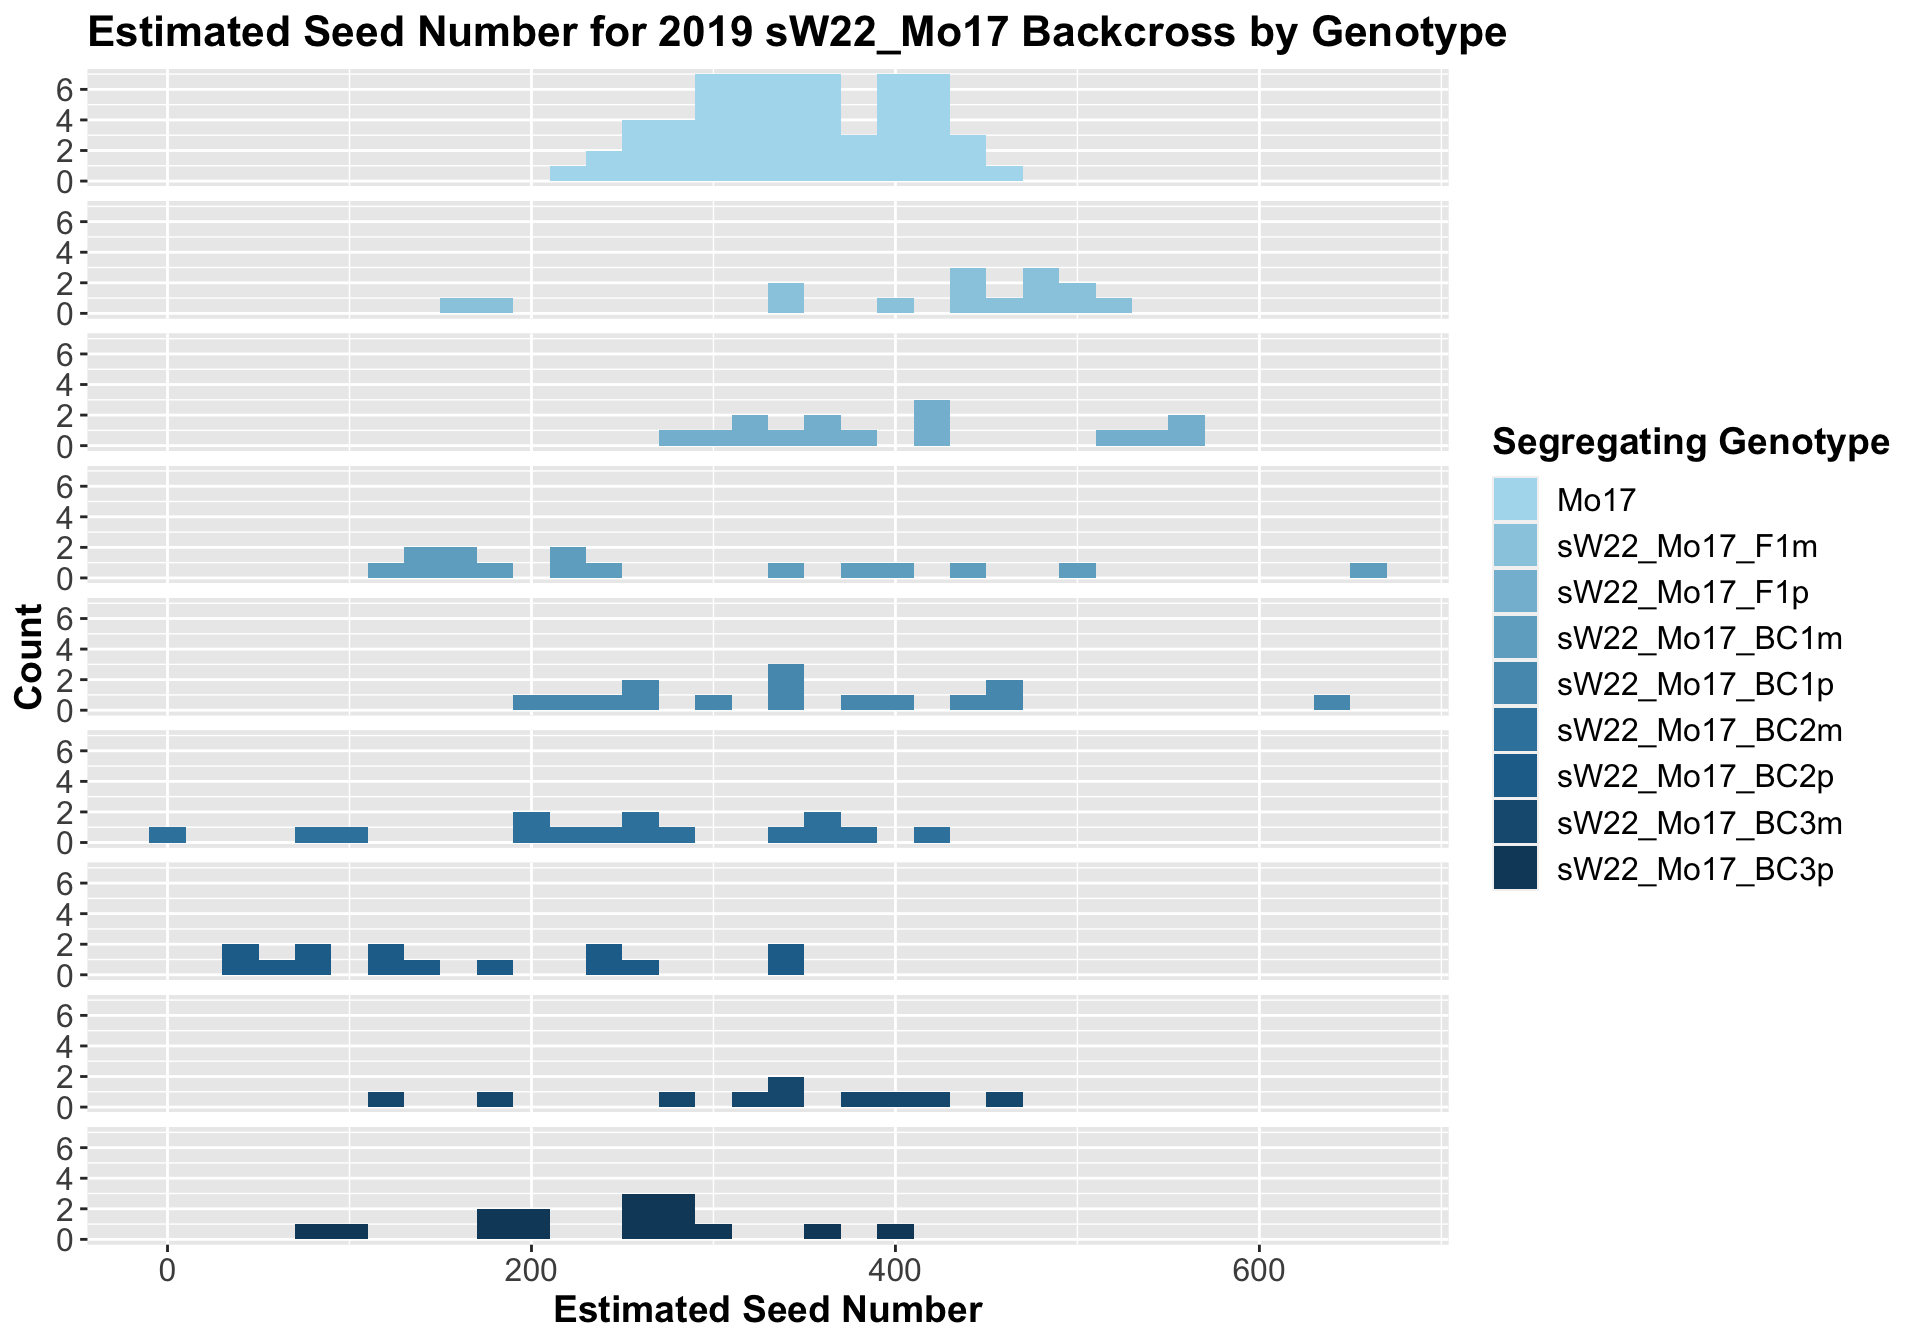
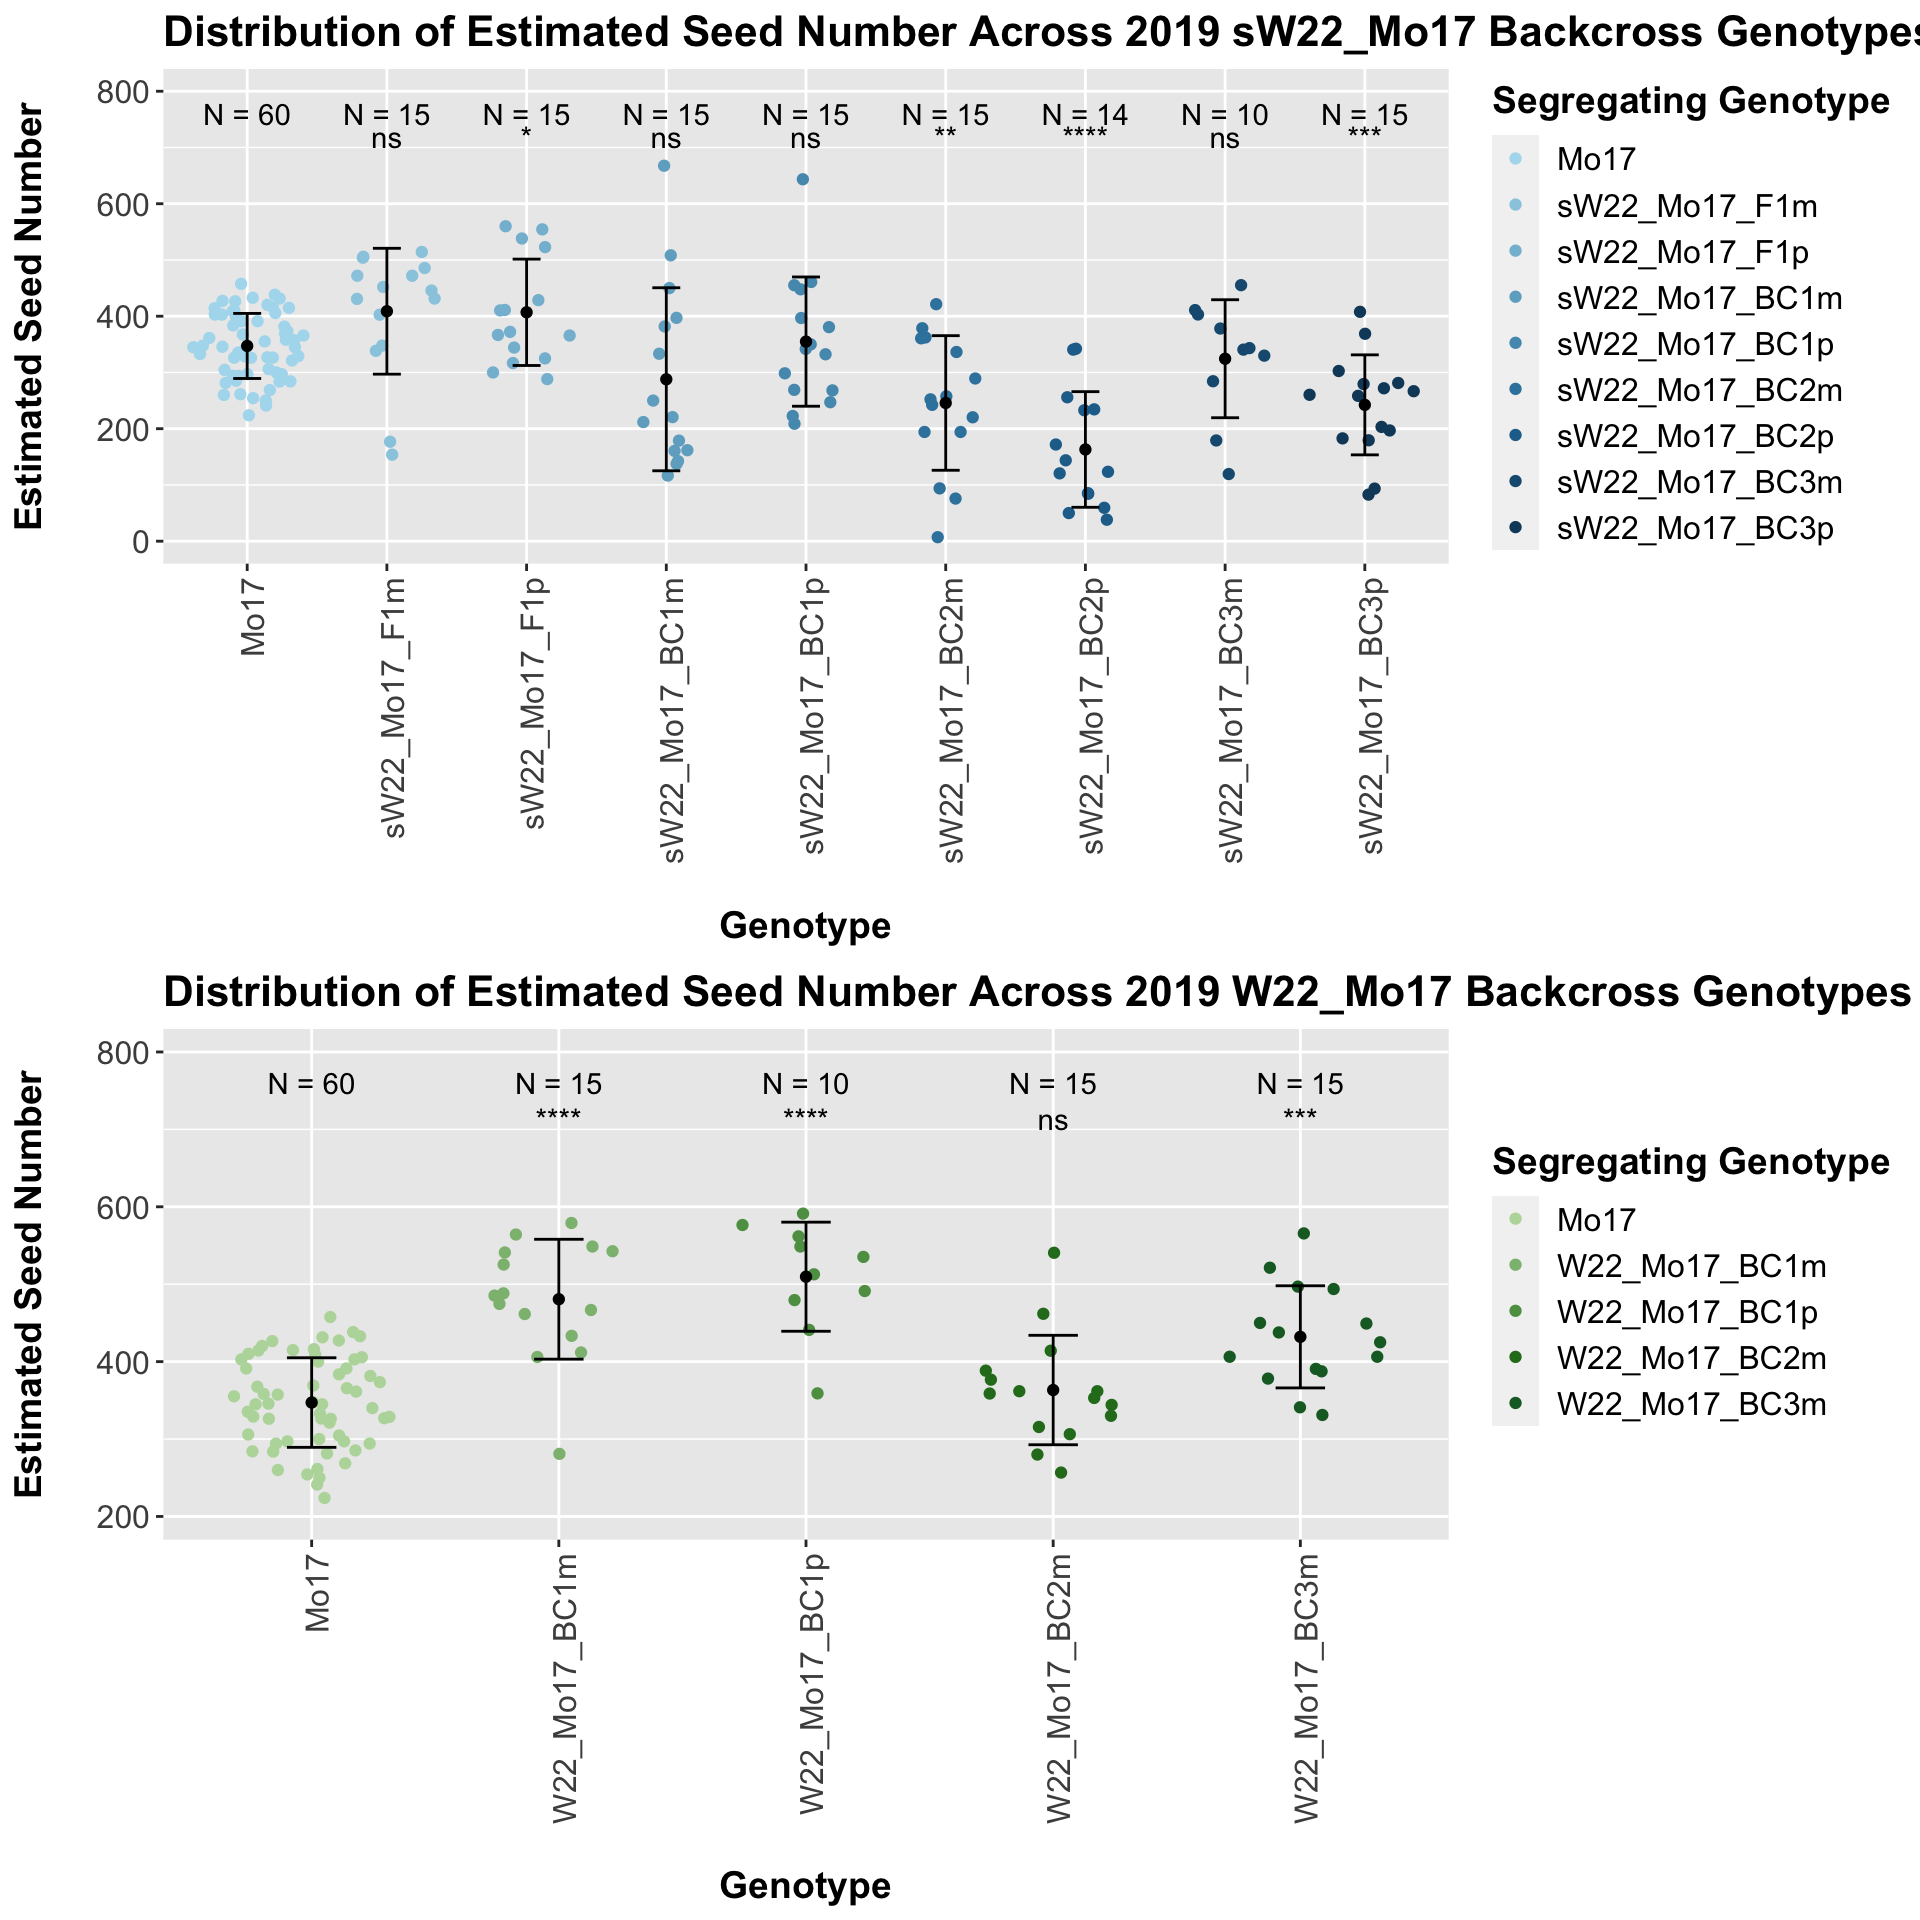
## 8 Ear_Trait Mo17 sW22_Mo17_BC3p 0.000441 0.0031 0.00044 *** T-testWe see a modest increase in the estimated seed number for the sW22_Mo17 F1s that mostly declines as we continue to backcross. There does seem to be a difference in the estimated seed number between the sick maternal and paternal backcrosses, but one is not consistently larger than the other.
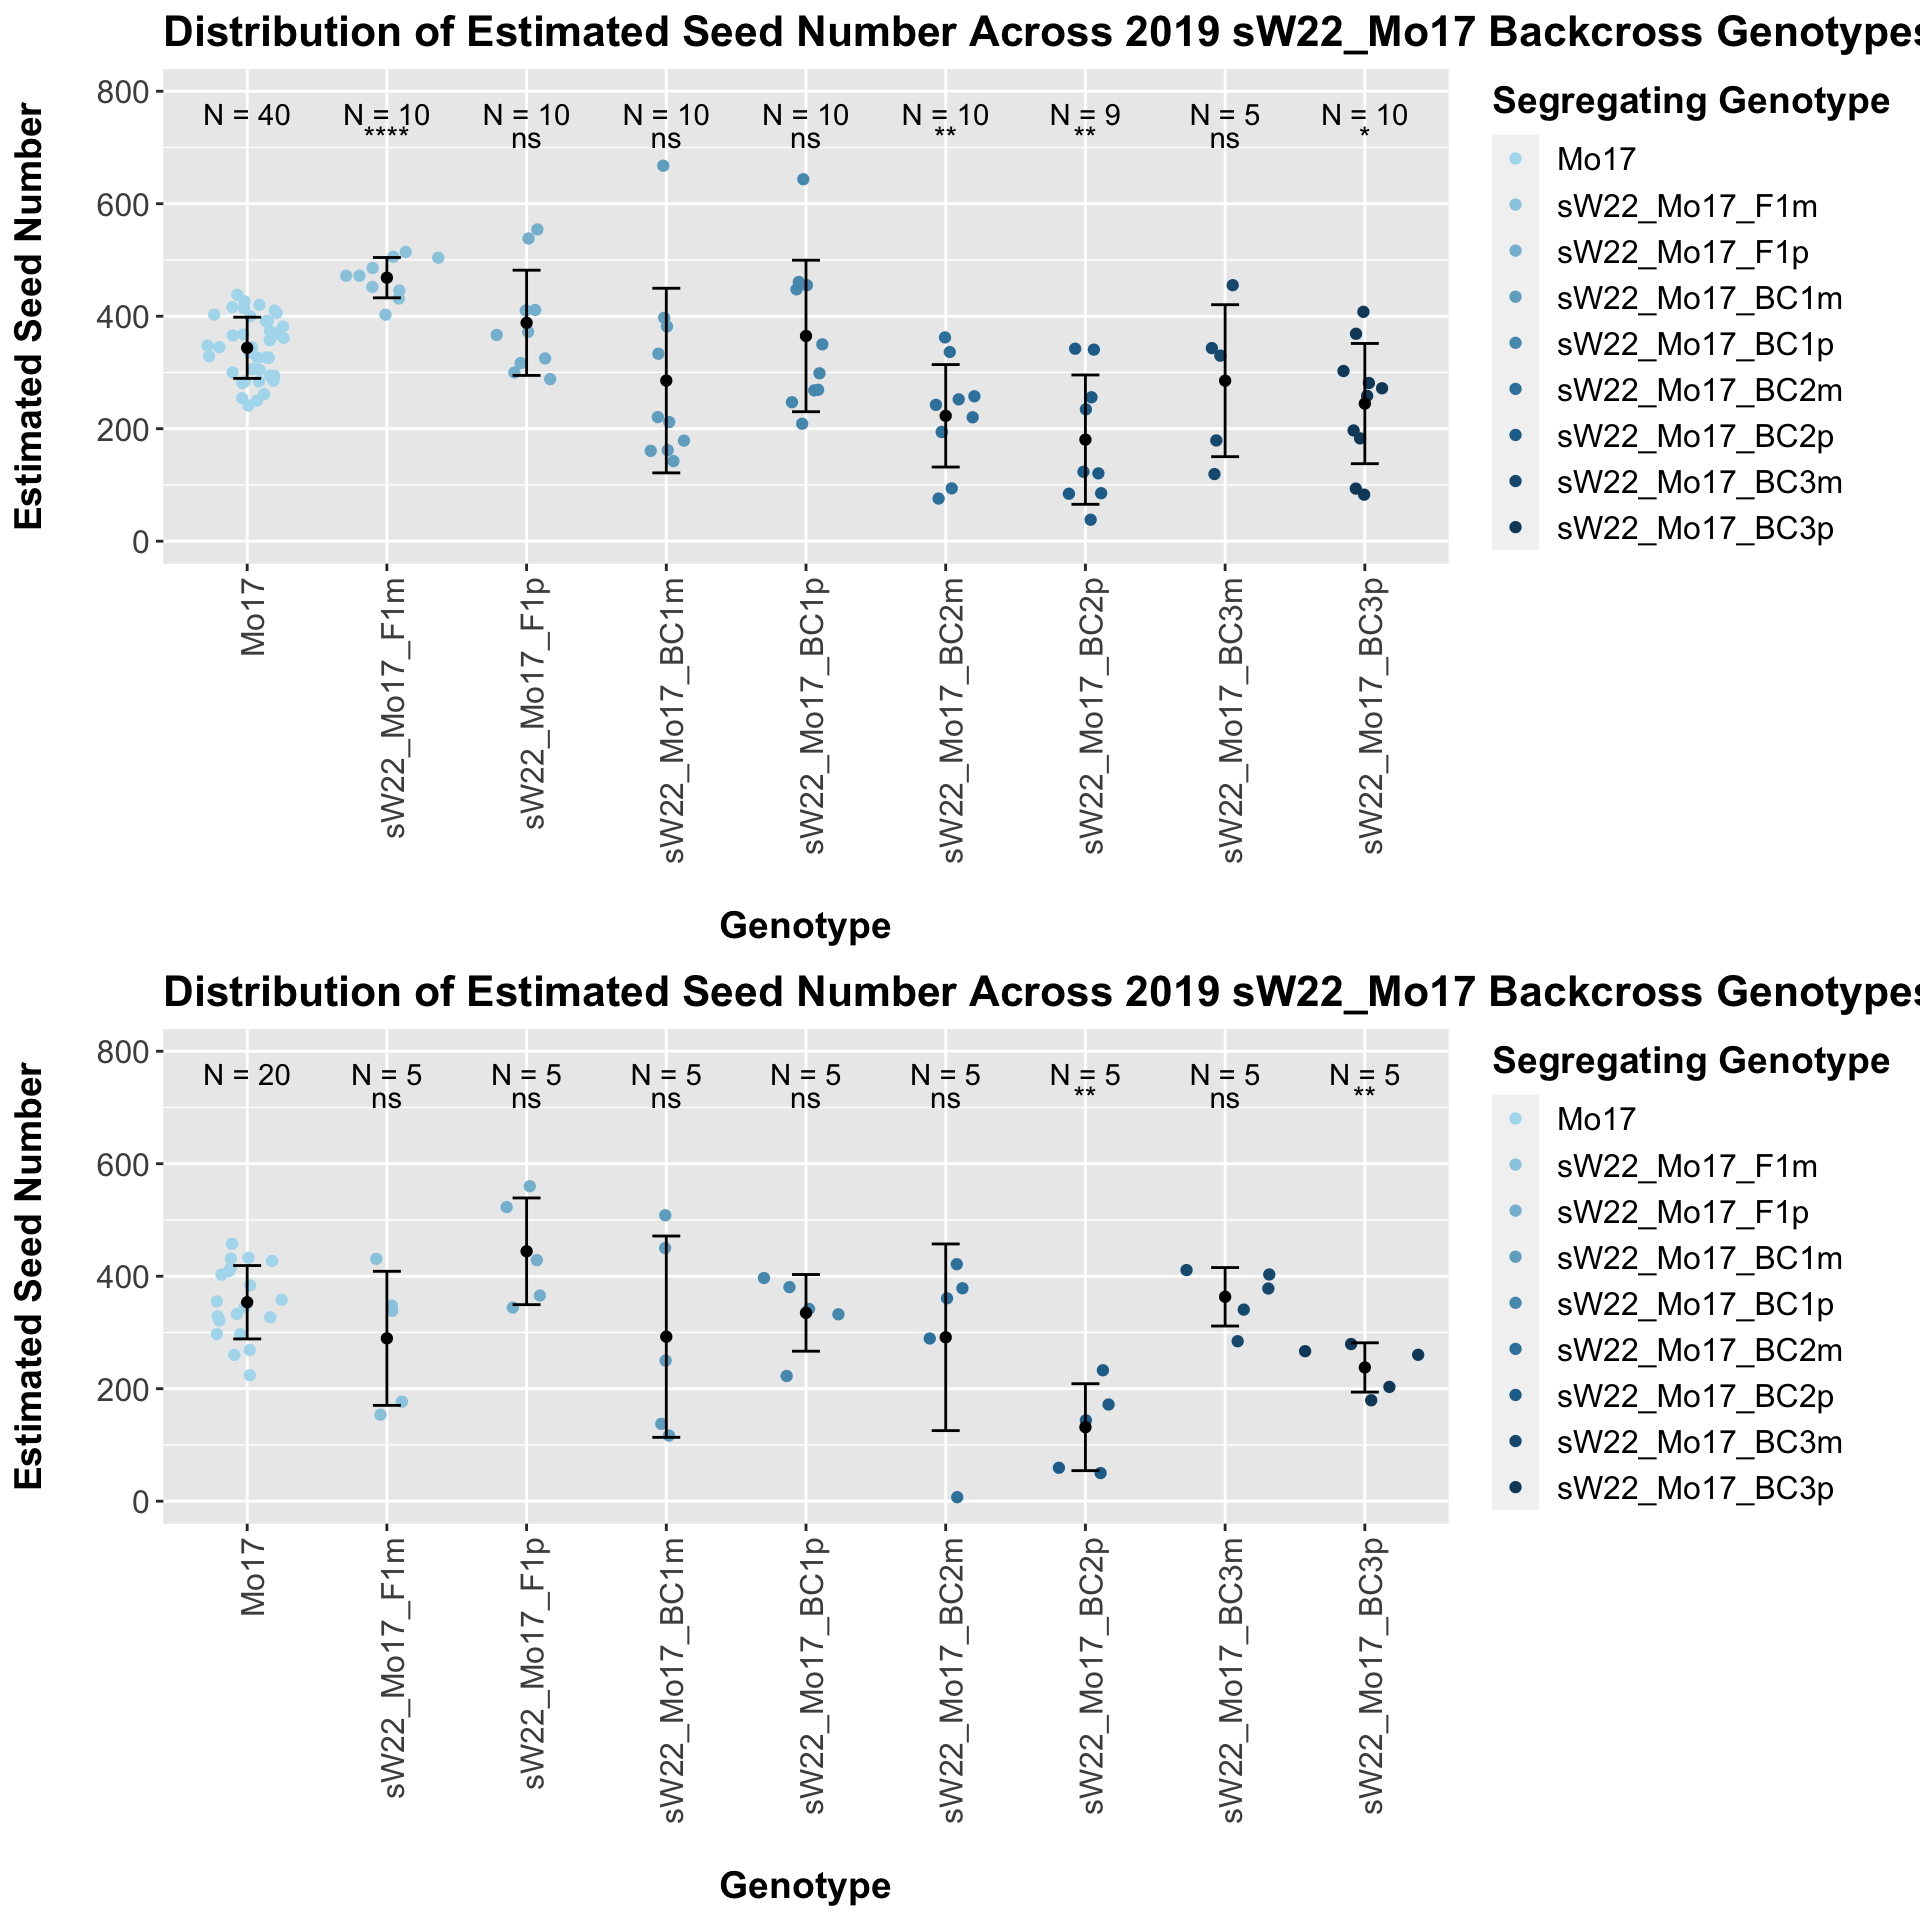
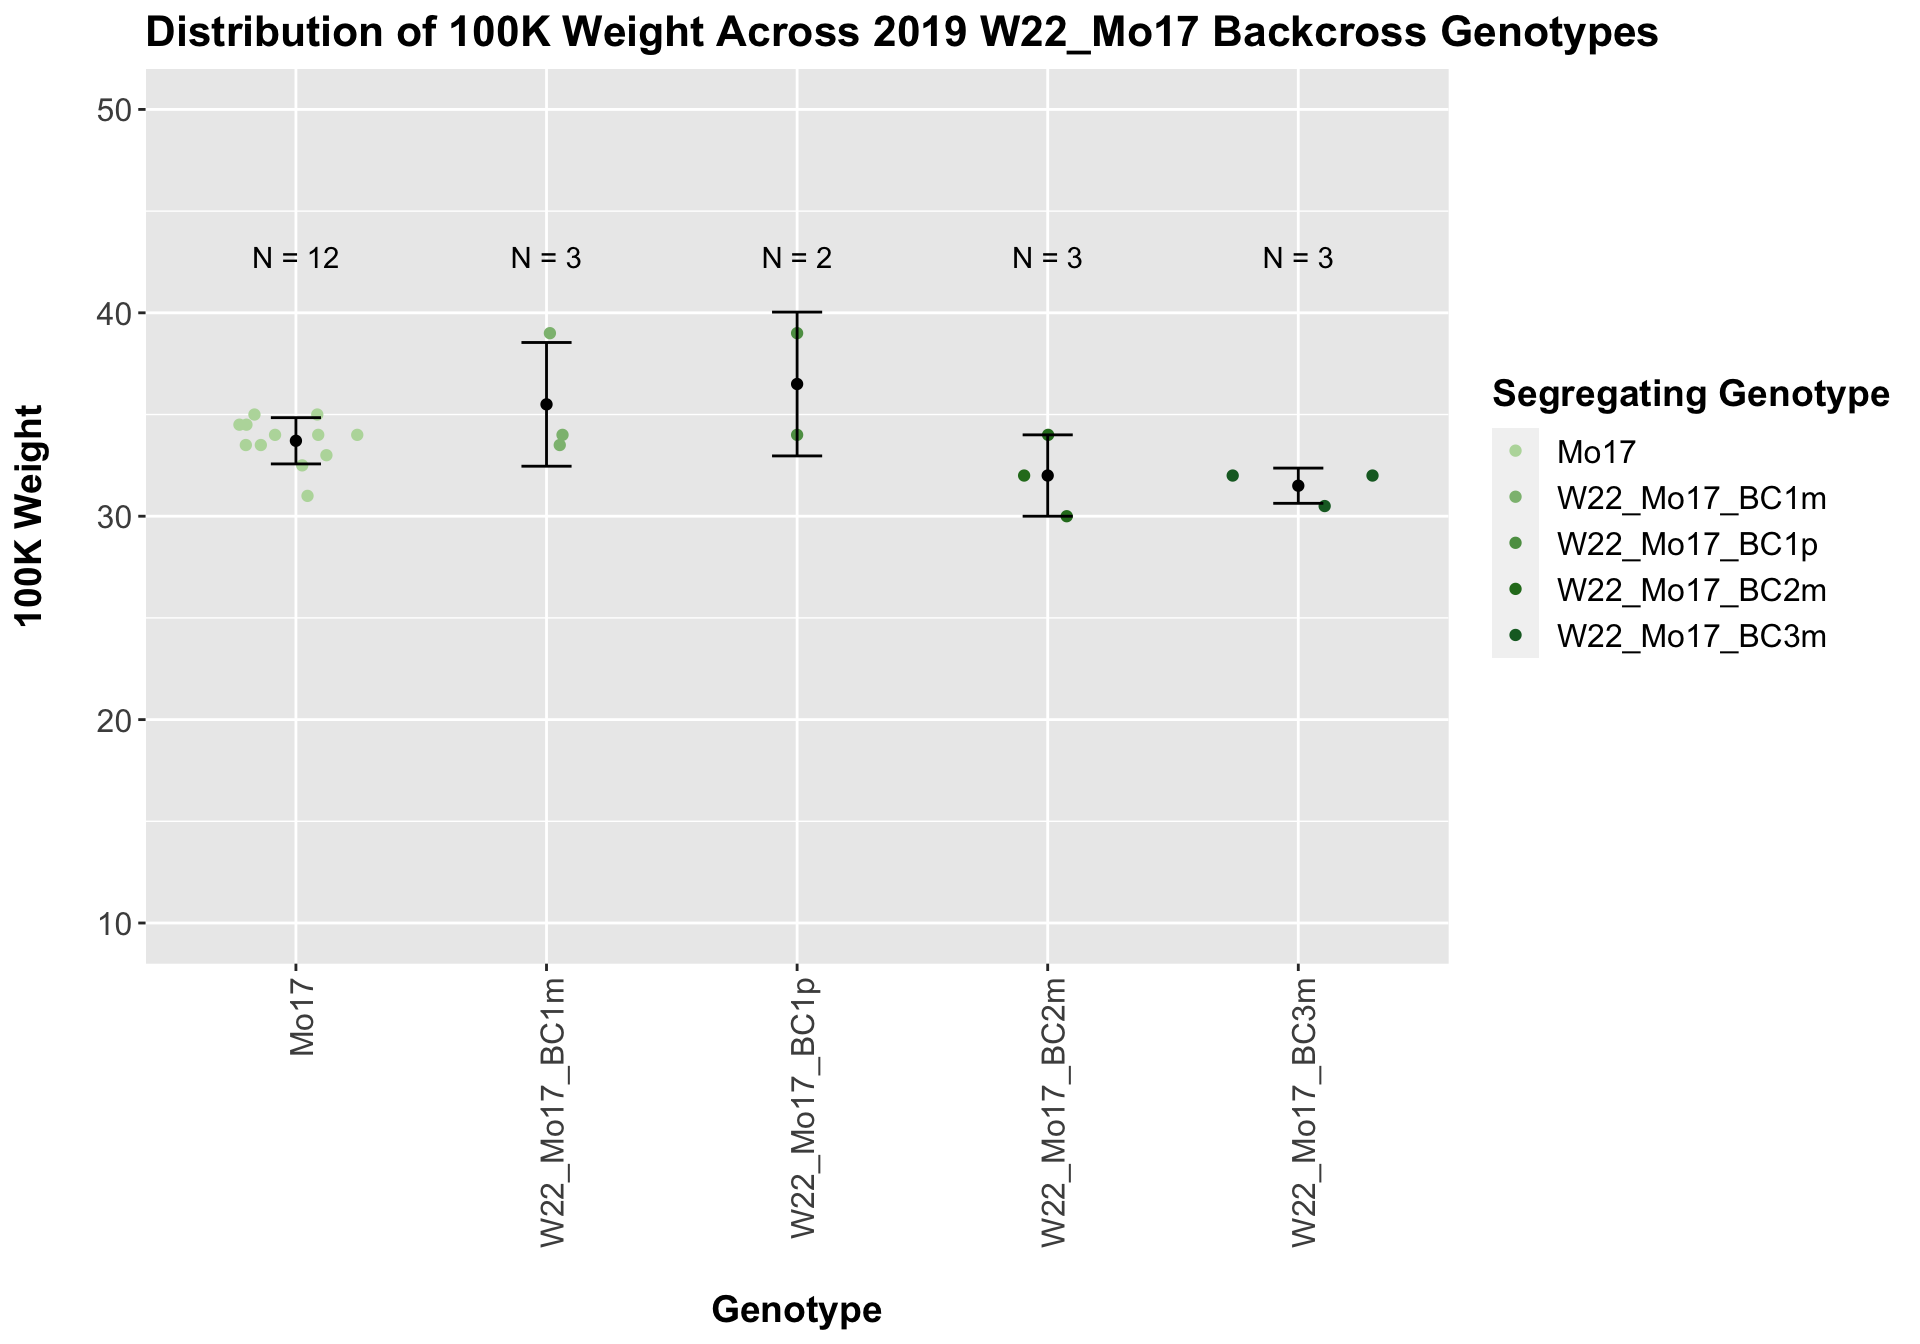
When we separate the data by field, many of our comparisons become insignificant (especially in Field 2). Once again, I would be a bit cautious with the statistical significance in Field 2 because the sample size is quite low. We can compare the height data across the W22 backcrossed to Mo17 rows.
##
##  Mean, SD, and SE for each genotype
## Seg_Genotype N mean sd se
## 1 Mo17 60 347.1383 57.85553 7.469117
## 2 W22_Mo17_BC1m 15 480.6200 77.42179 19.990220
## 3 W22_Mo17_BC1p 10 509.7000 70.46618 22.283362
## 4 W22_Mo17_BC2m 15 363.3133 70.68835 18.251653
## 5 W22_Mo17_BC3m 15 432.0267 65.97523 17.034731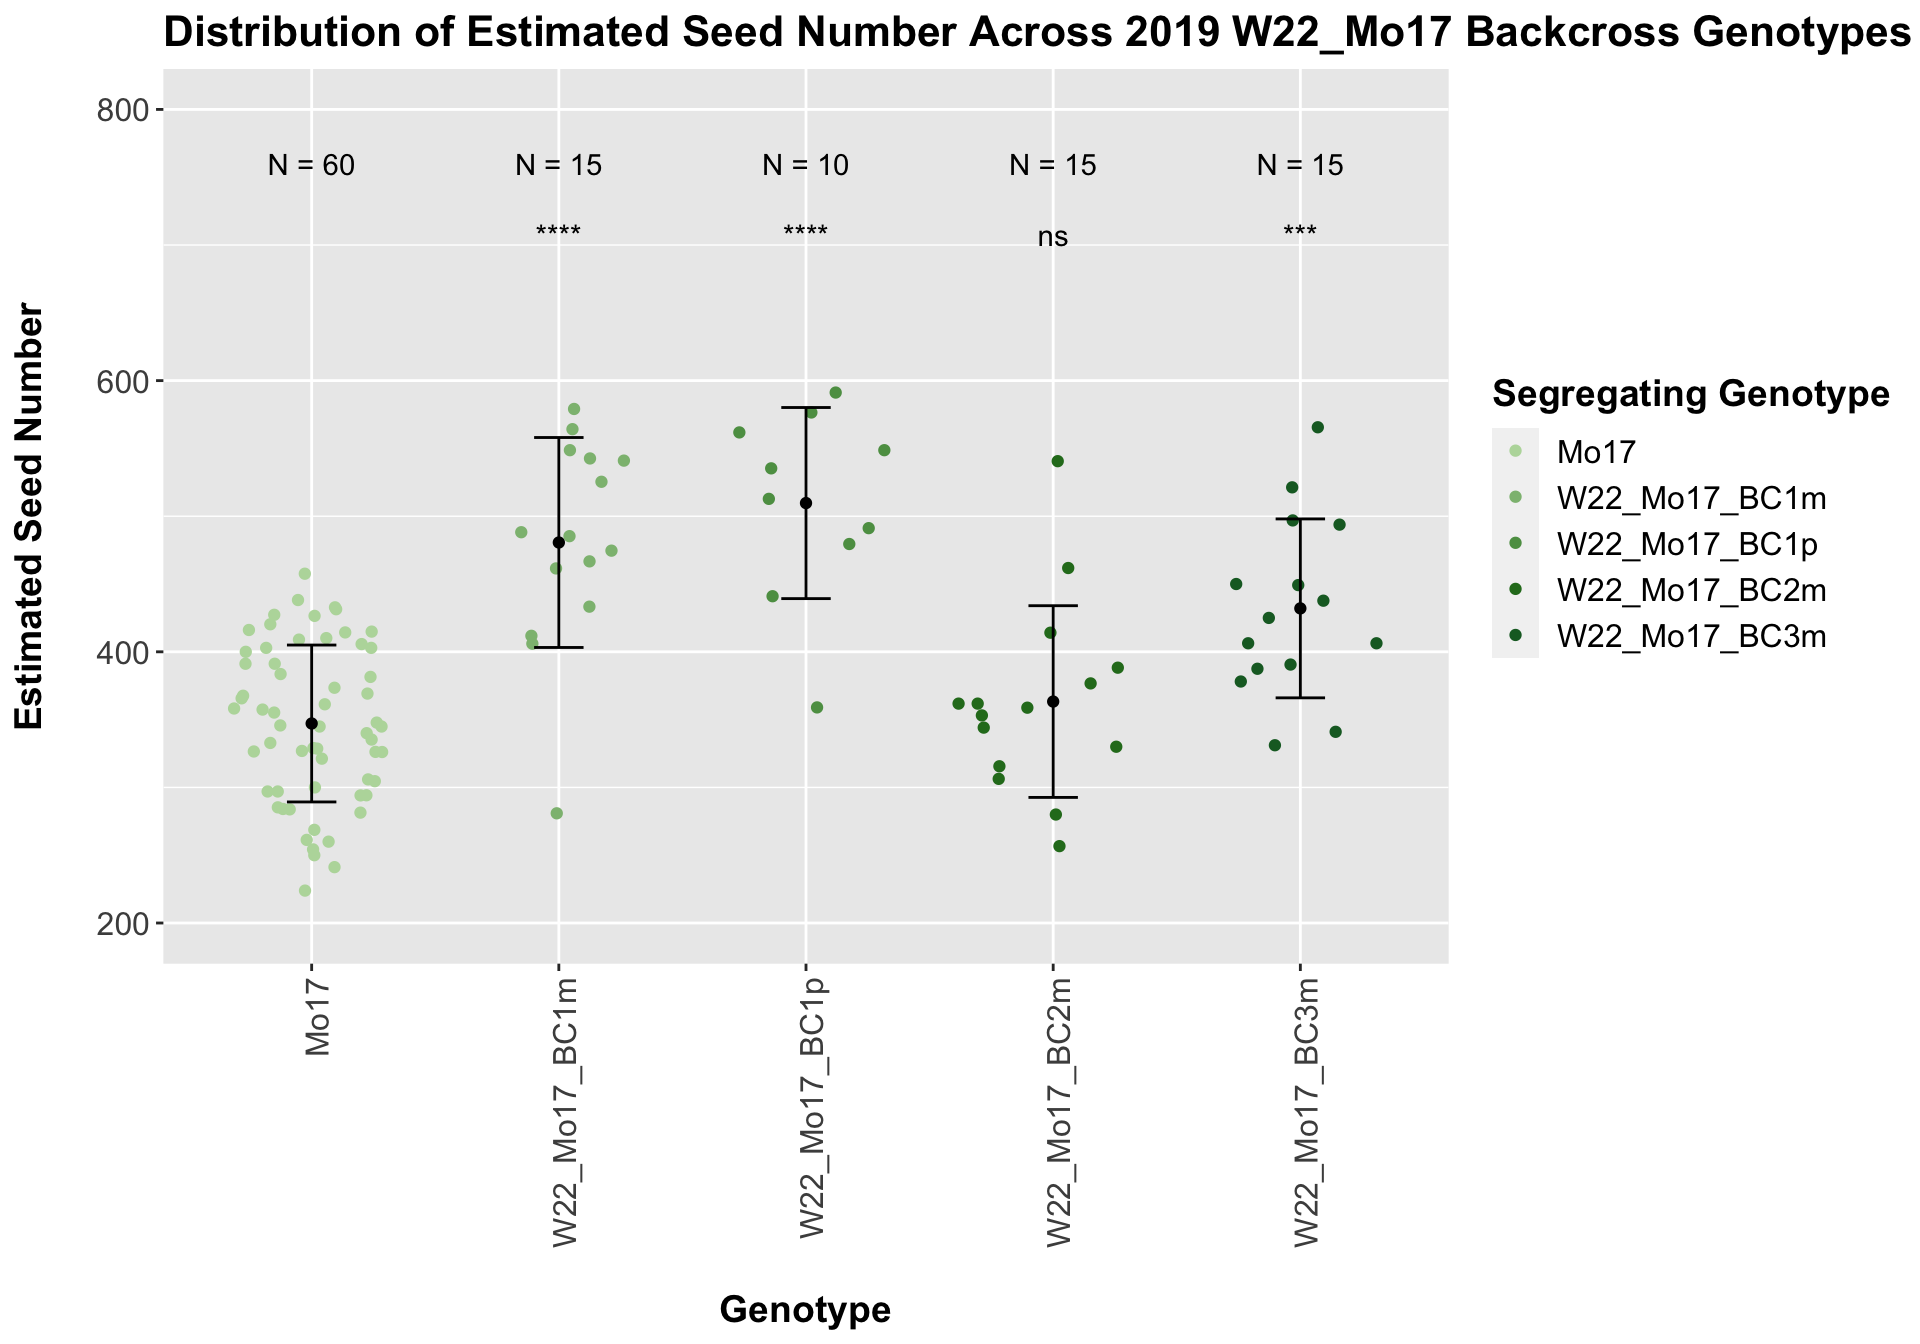
## # A tibble: 4 x 8
##   .y.       group1 group2                 p    p.adj p.format p.signif method
##   <chr>     <chr>  <chr>              <dbl>    <dbl> <chr>    <chr>    <chr>
## 1 Ear_Trait Mo17   W22_Mo17_BC1m 0.00000655 0.000026 6.5e-06  ****     T-test
## 2 Ear_Trait Mo17   W22_Mo17_BC1p 0.0000240  0.000072 2.4e-05  ****     T-test
## 3 Ear_Trait Mo17   W22_Mo17_BC2m 0.422      0.42     0.42230  ns       T-test
## 4 Ear_Trait Mo17   W22_Mo17_BC3m 0.000195   0.00039  0.00019  ***      T-test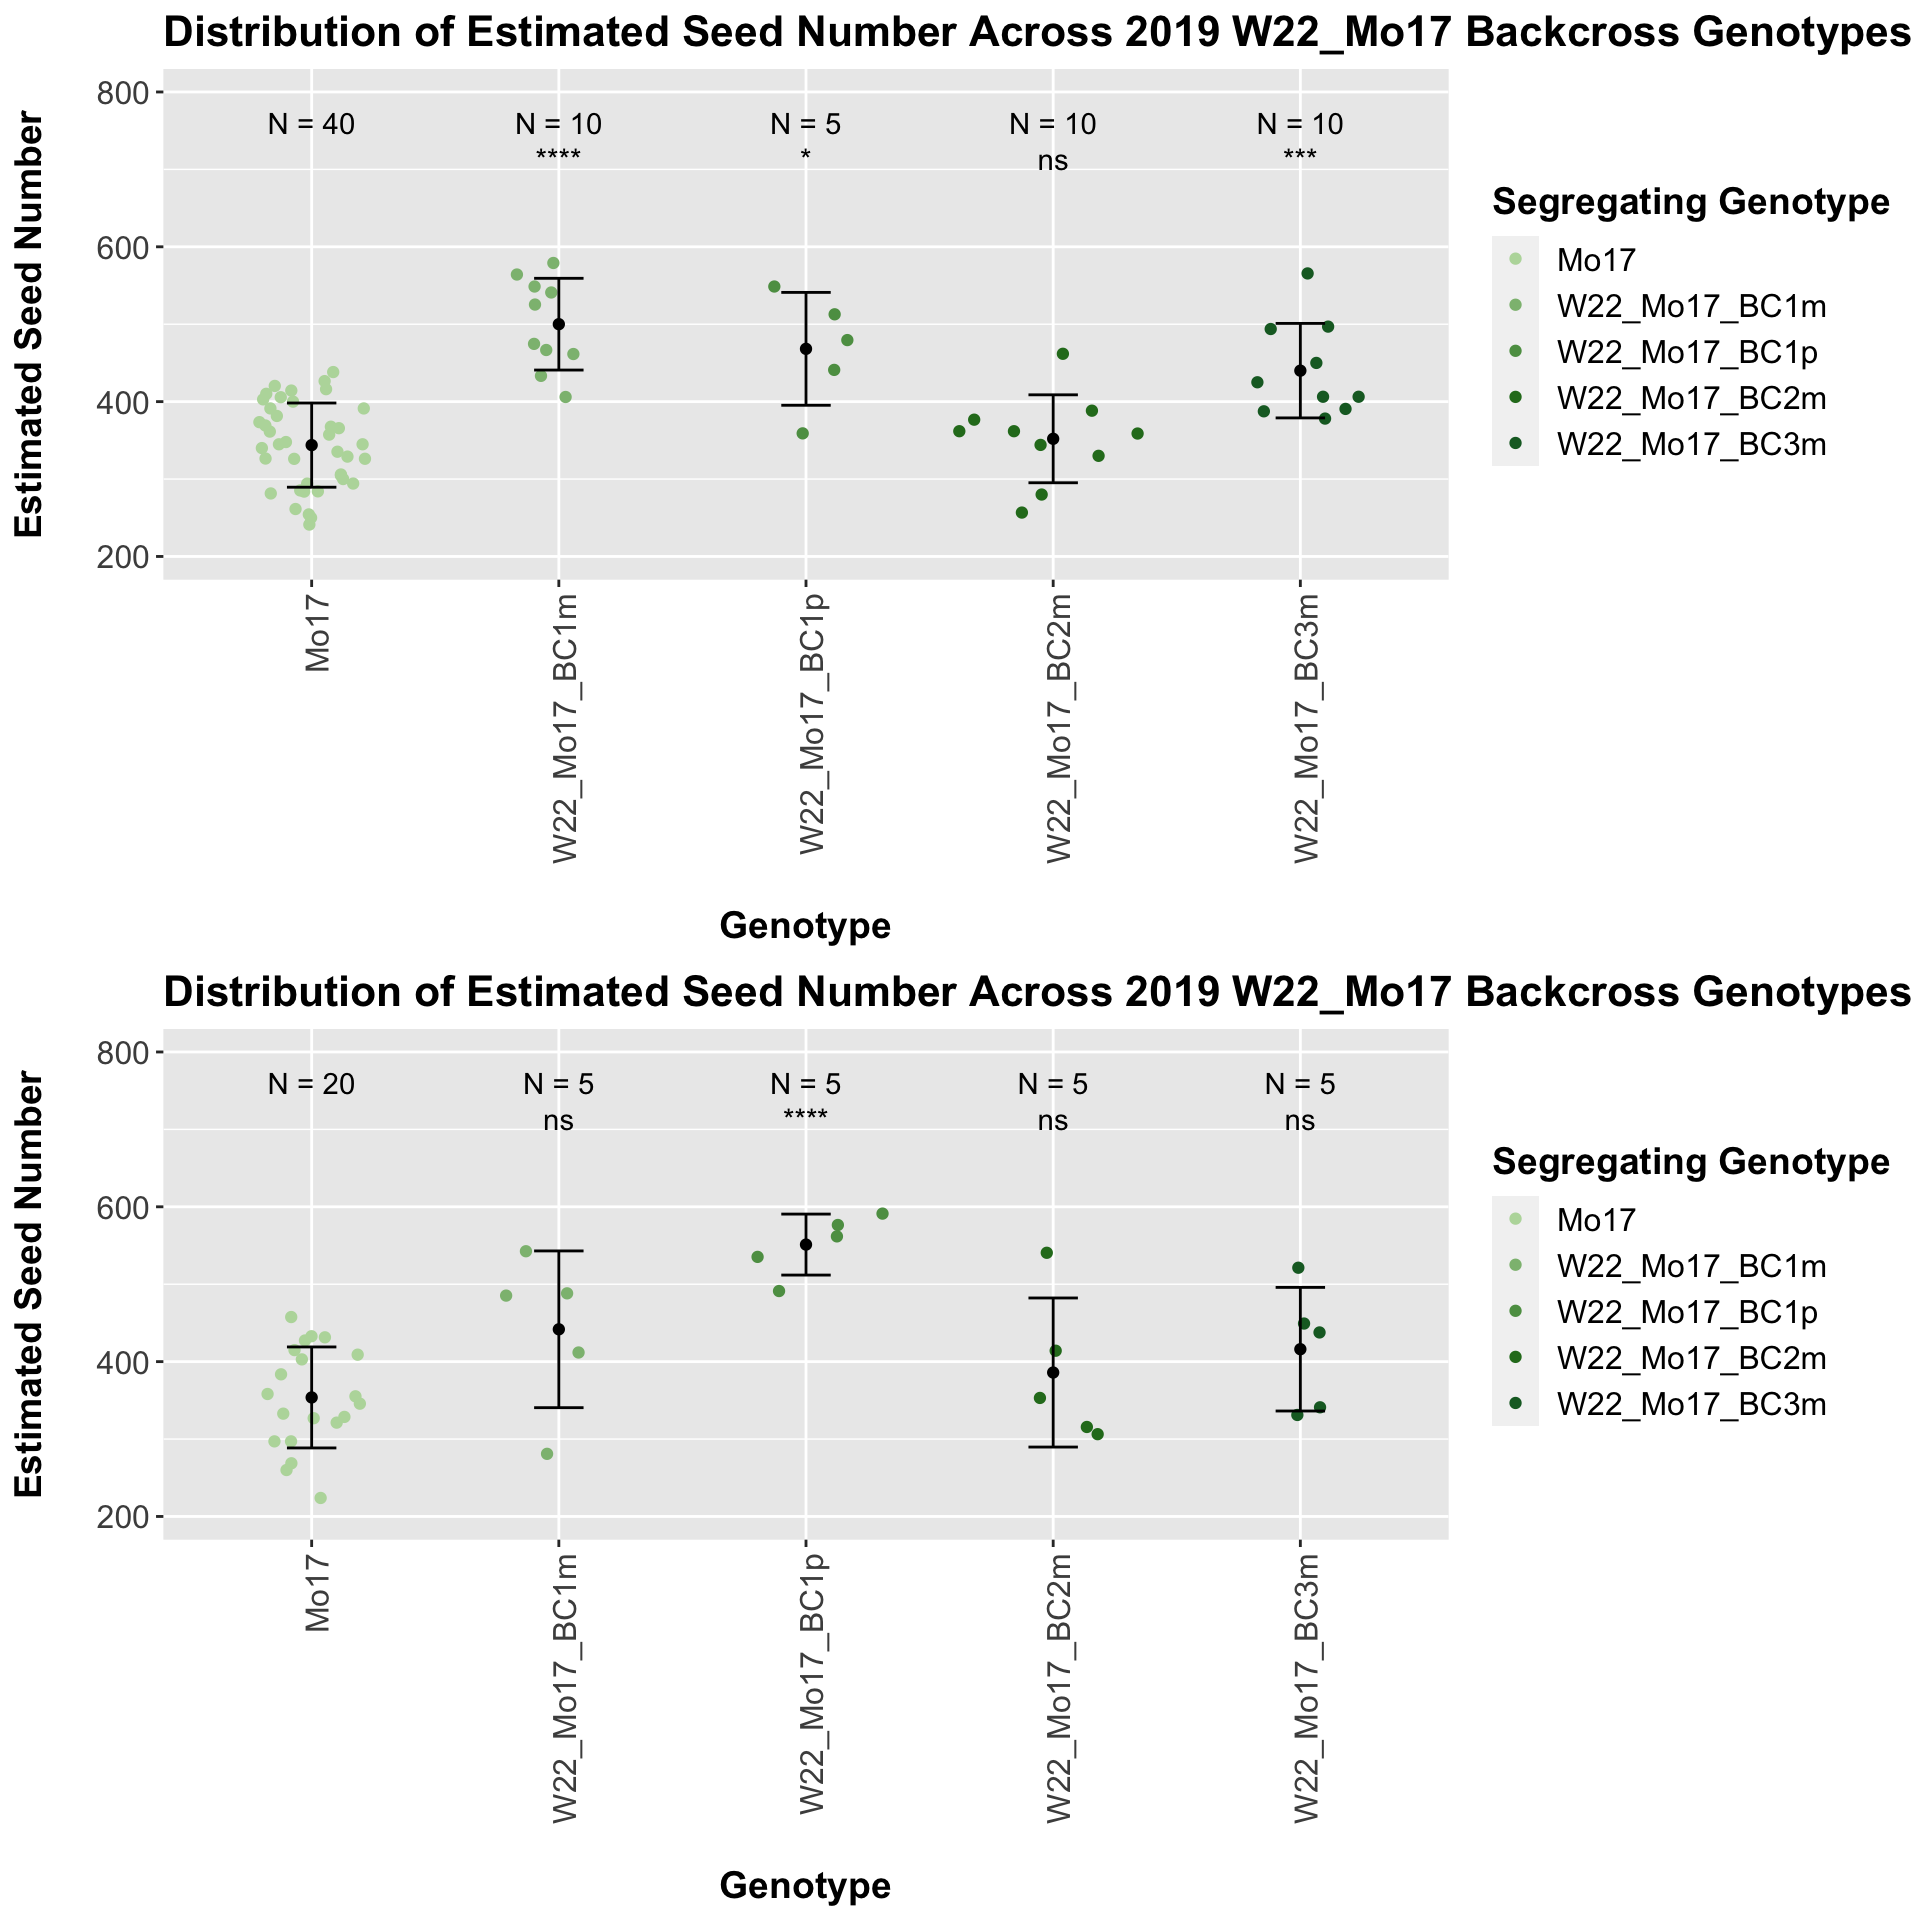
There is an increase in estimated seed number for the early generation backcrosses that does decline. The significance of this trend is diminished when we separate the data by field, particularly in Field 2.
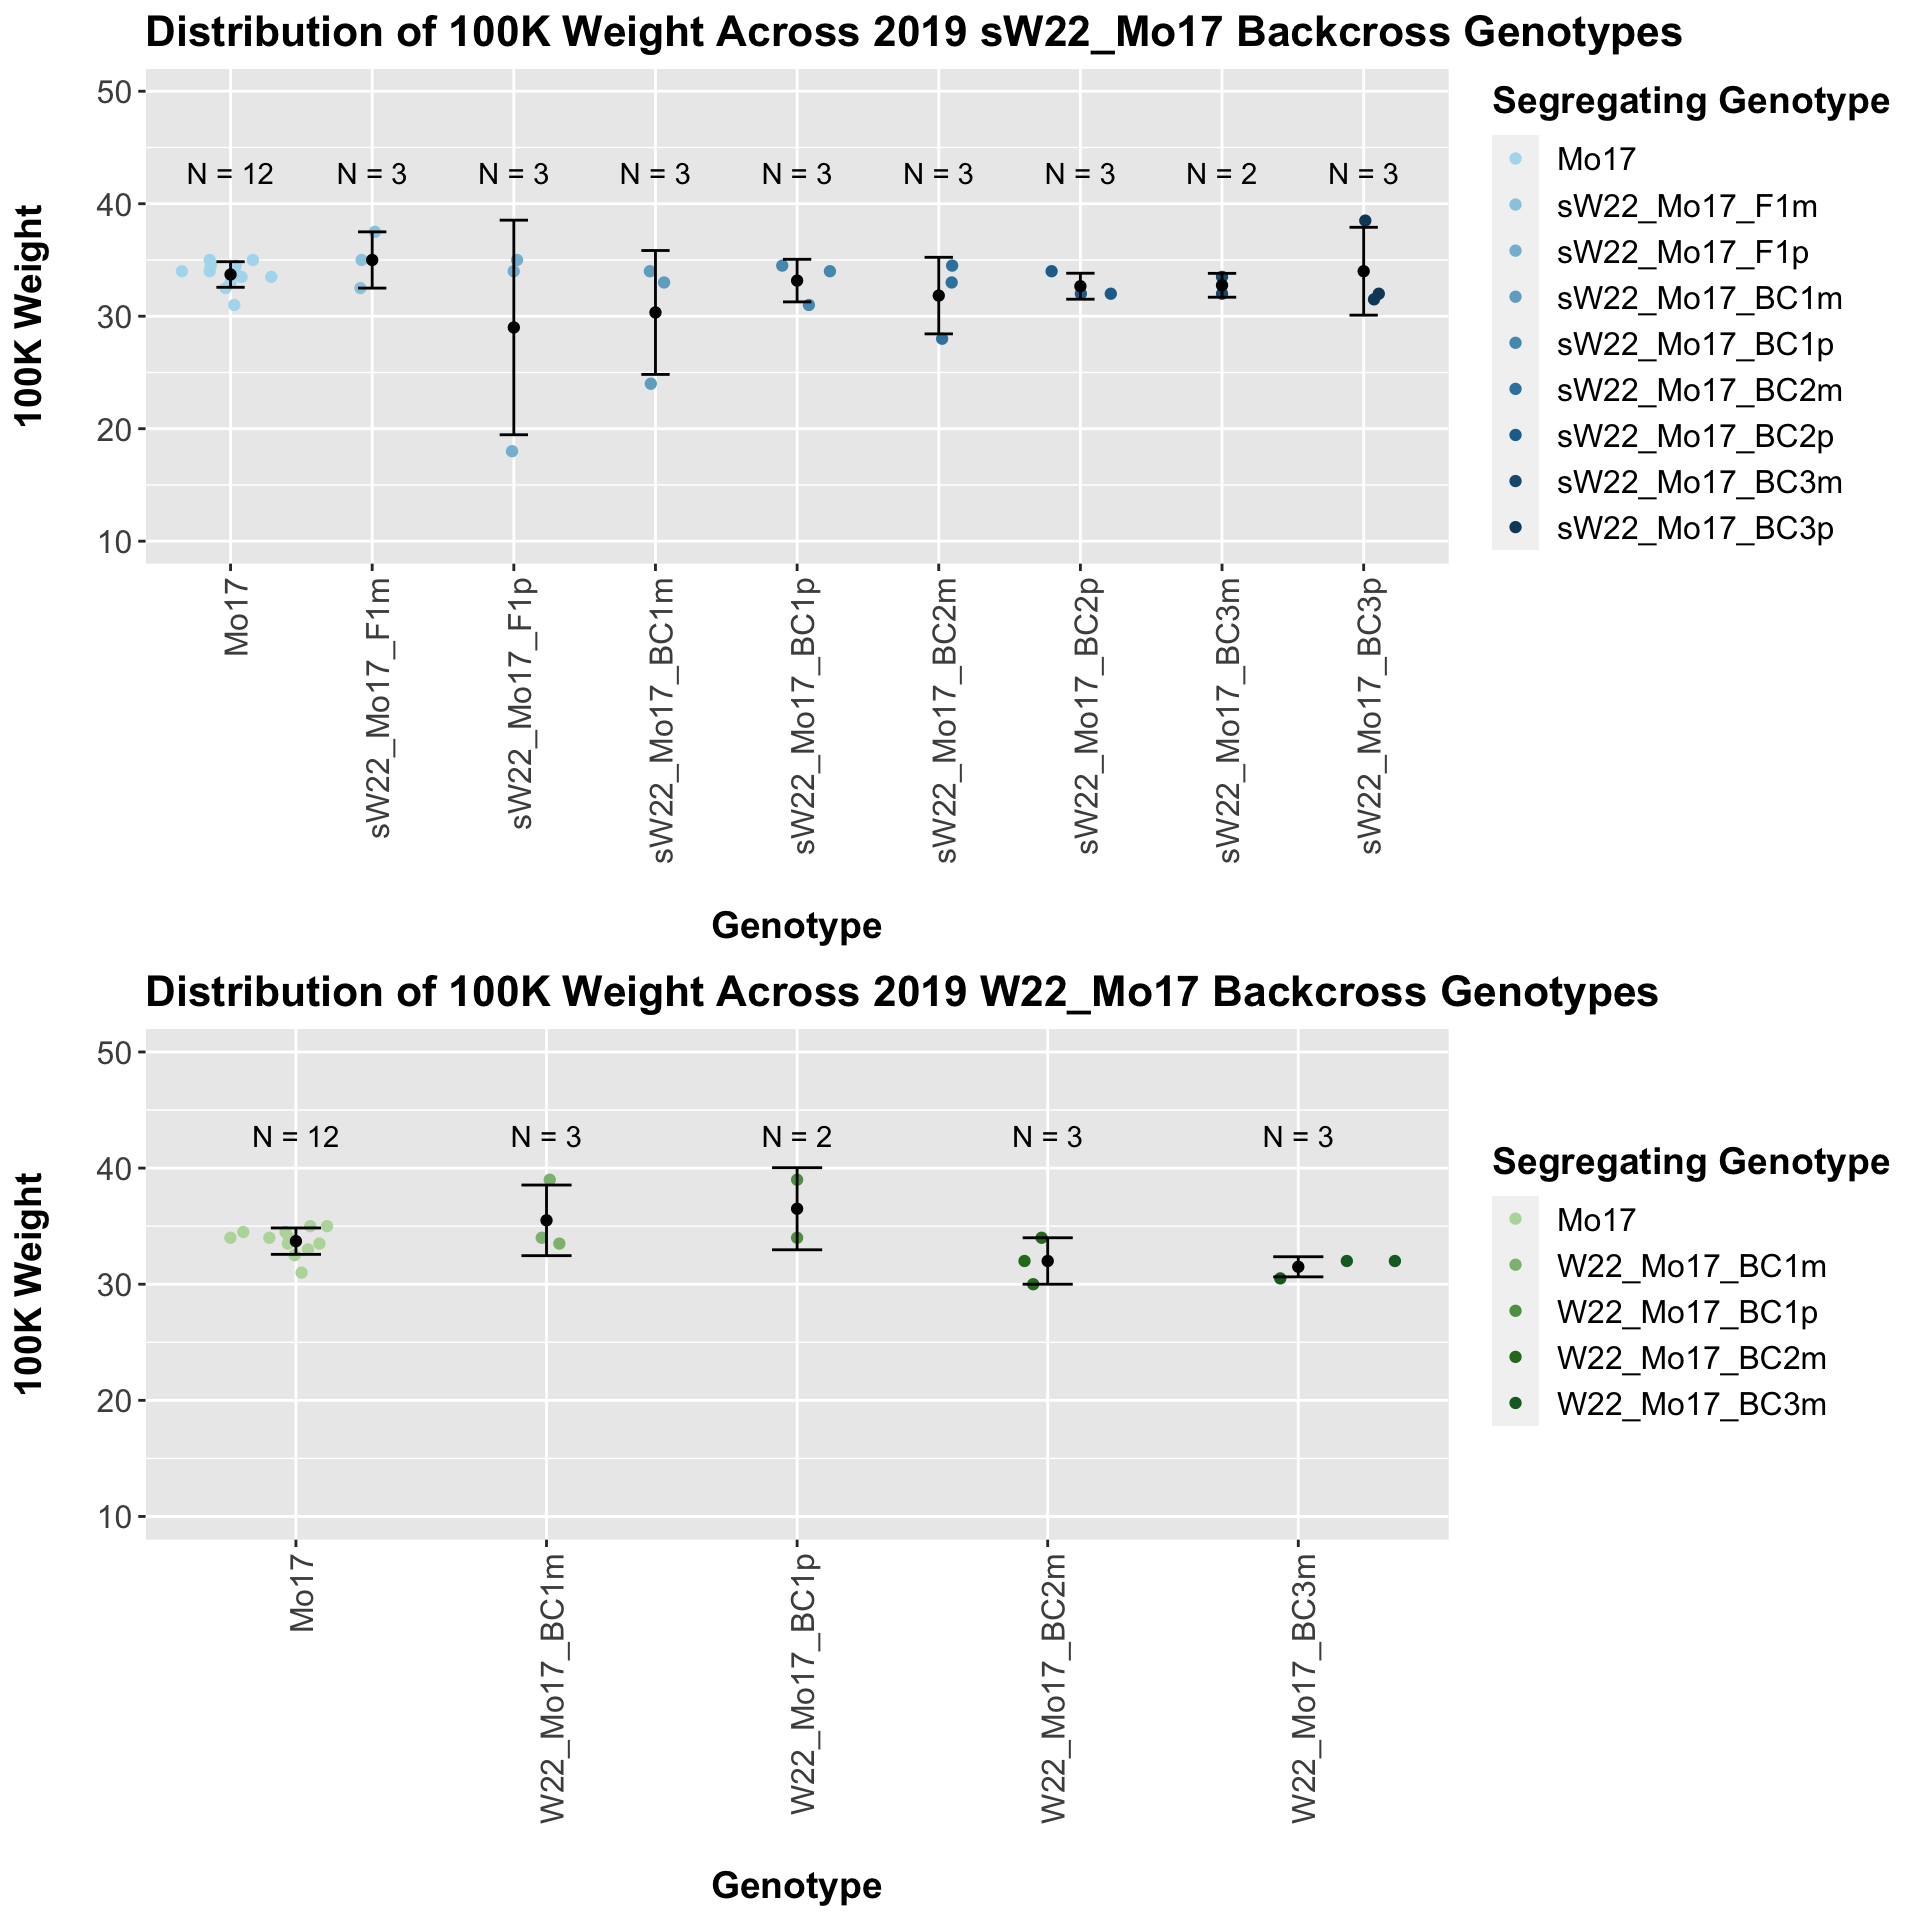
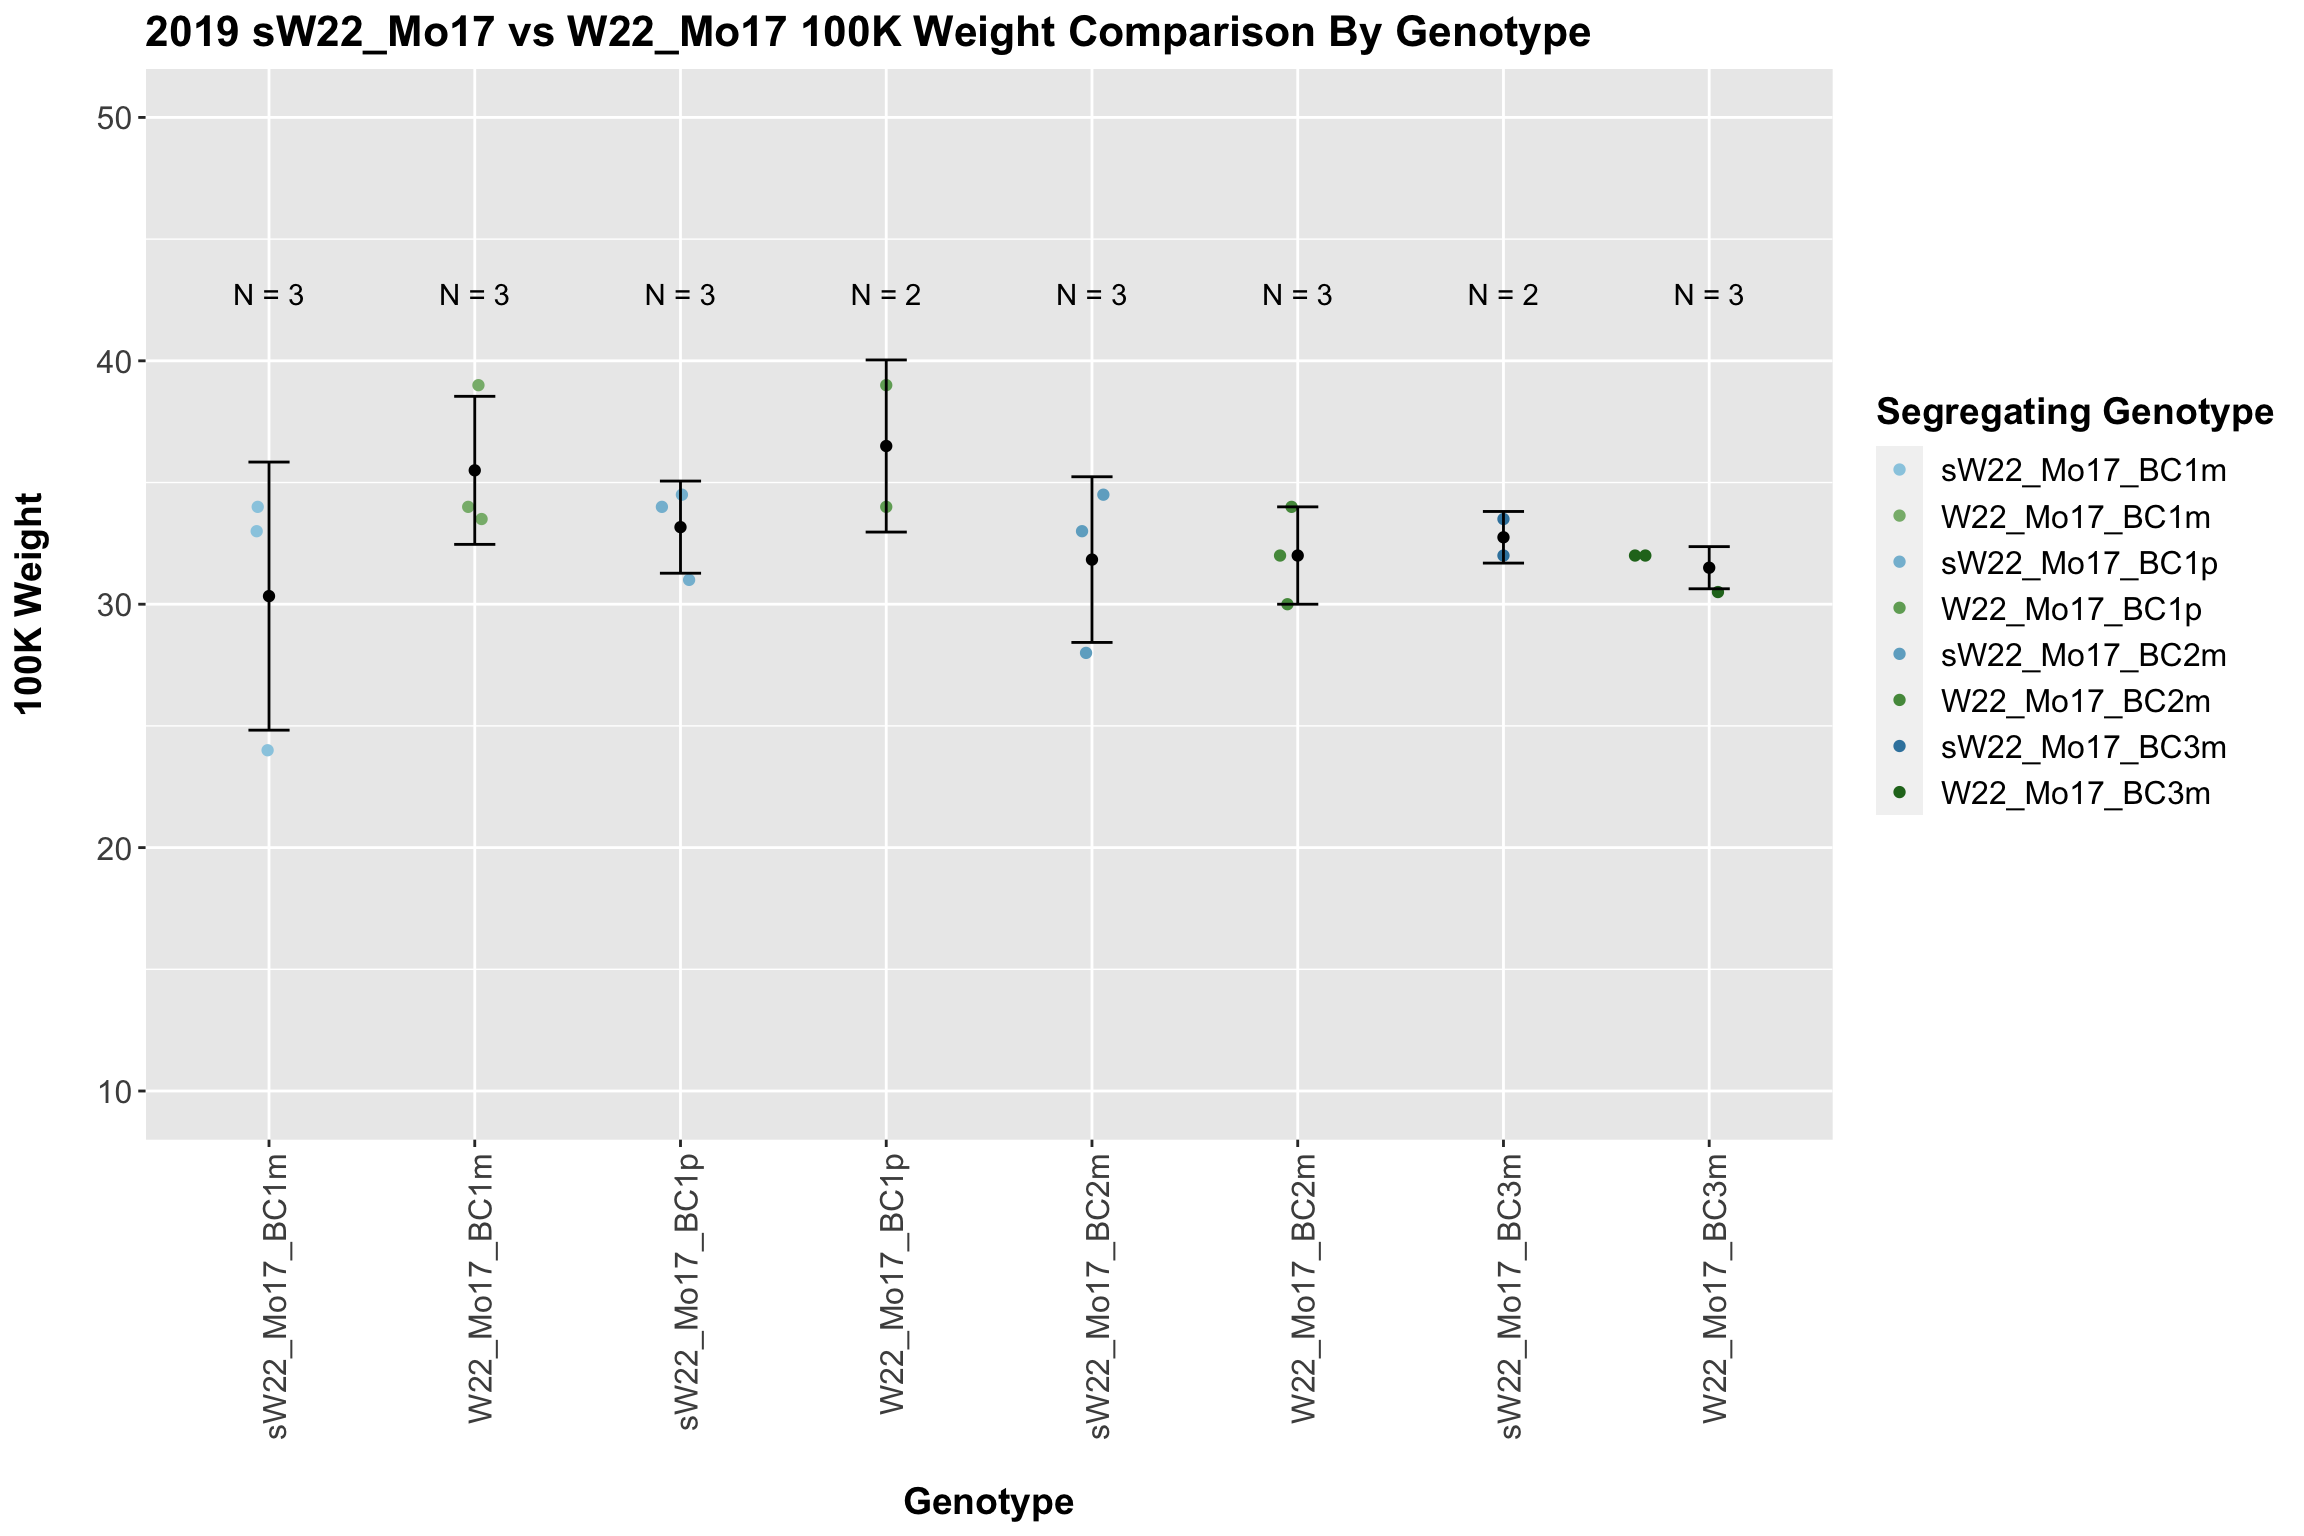
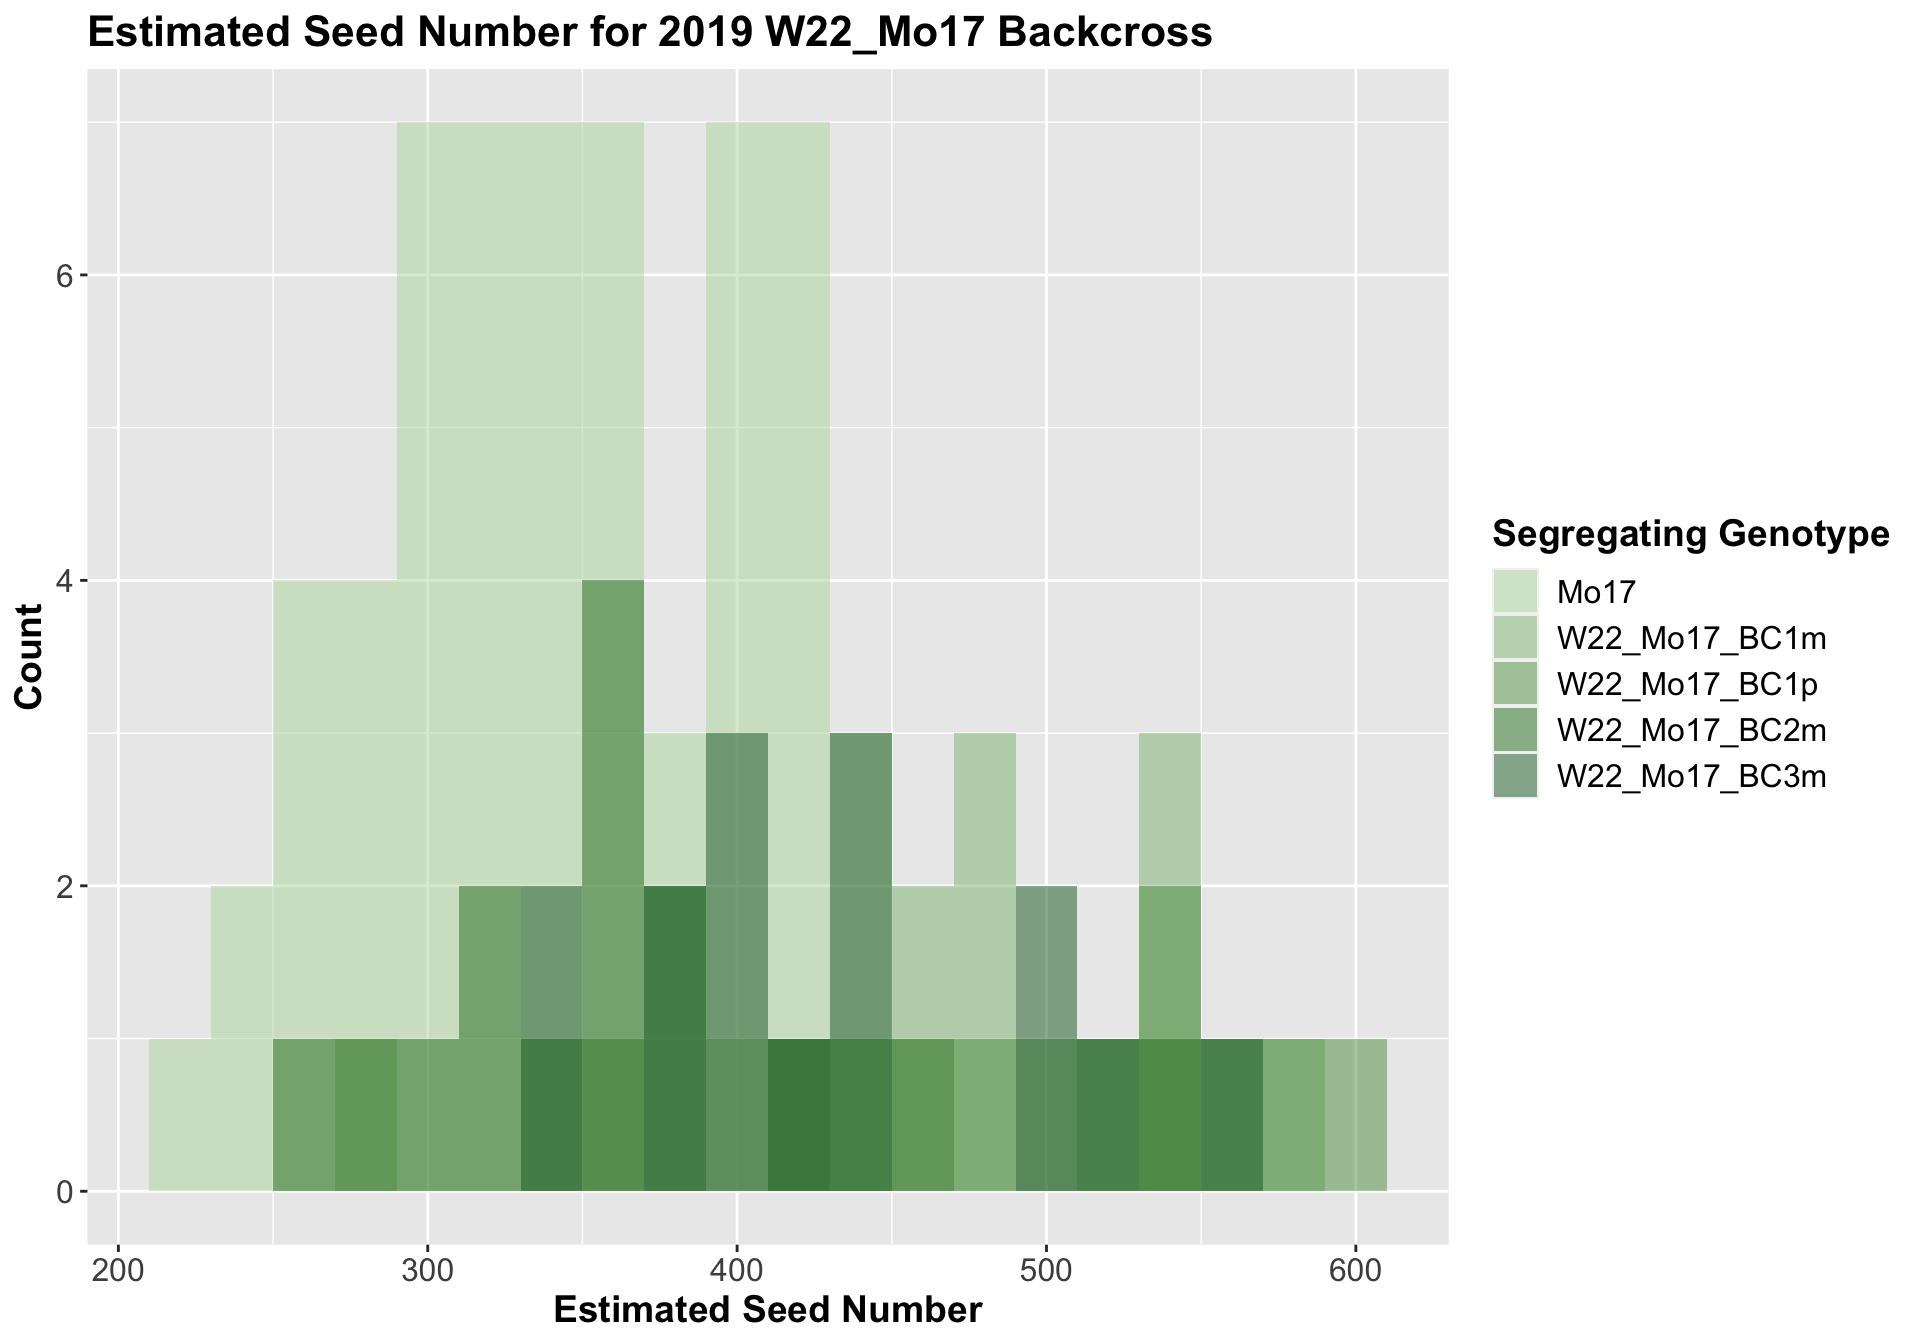
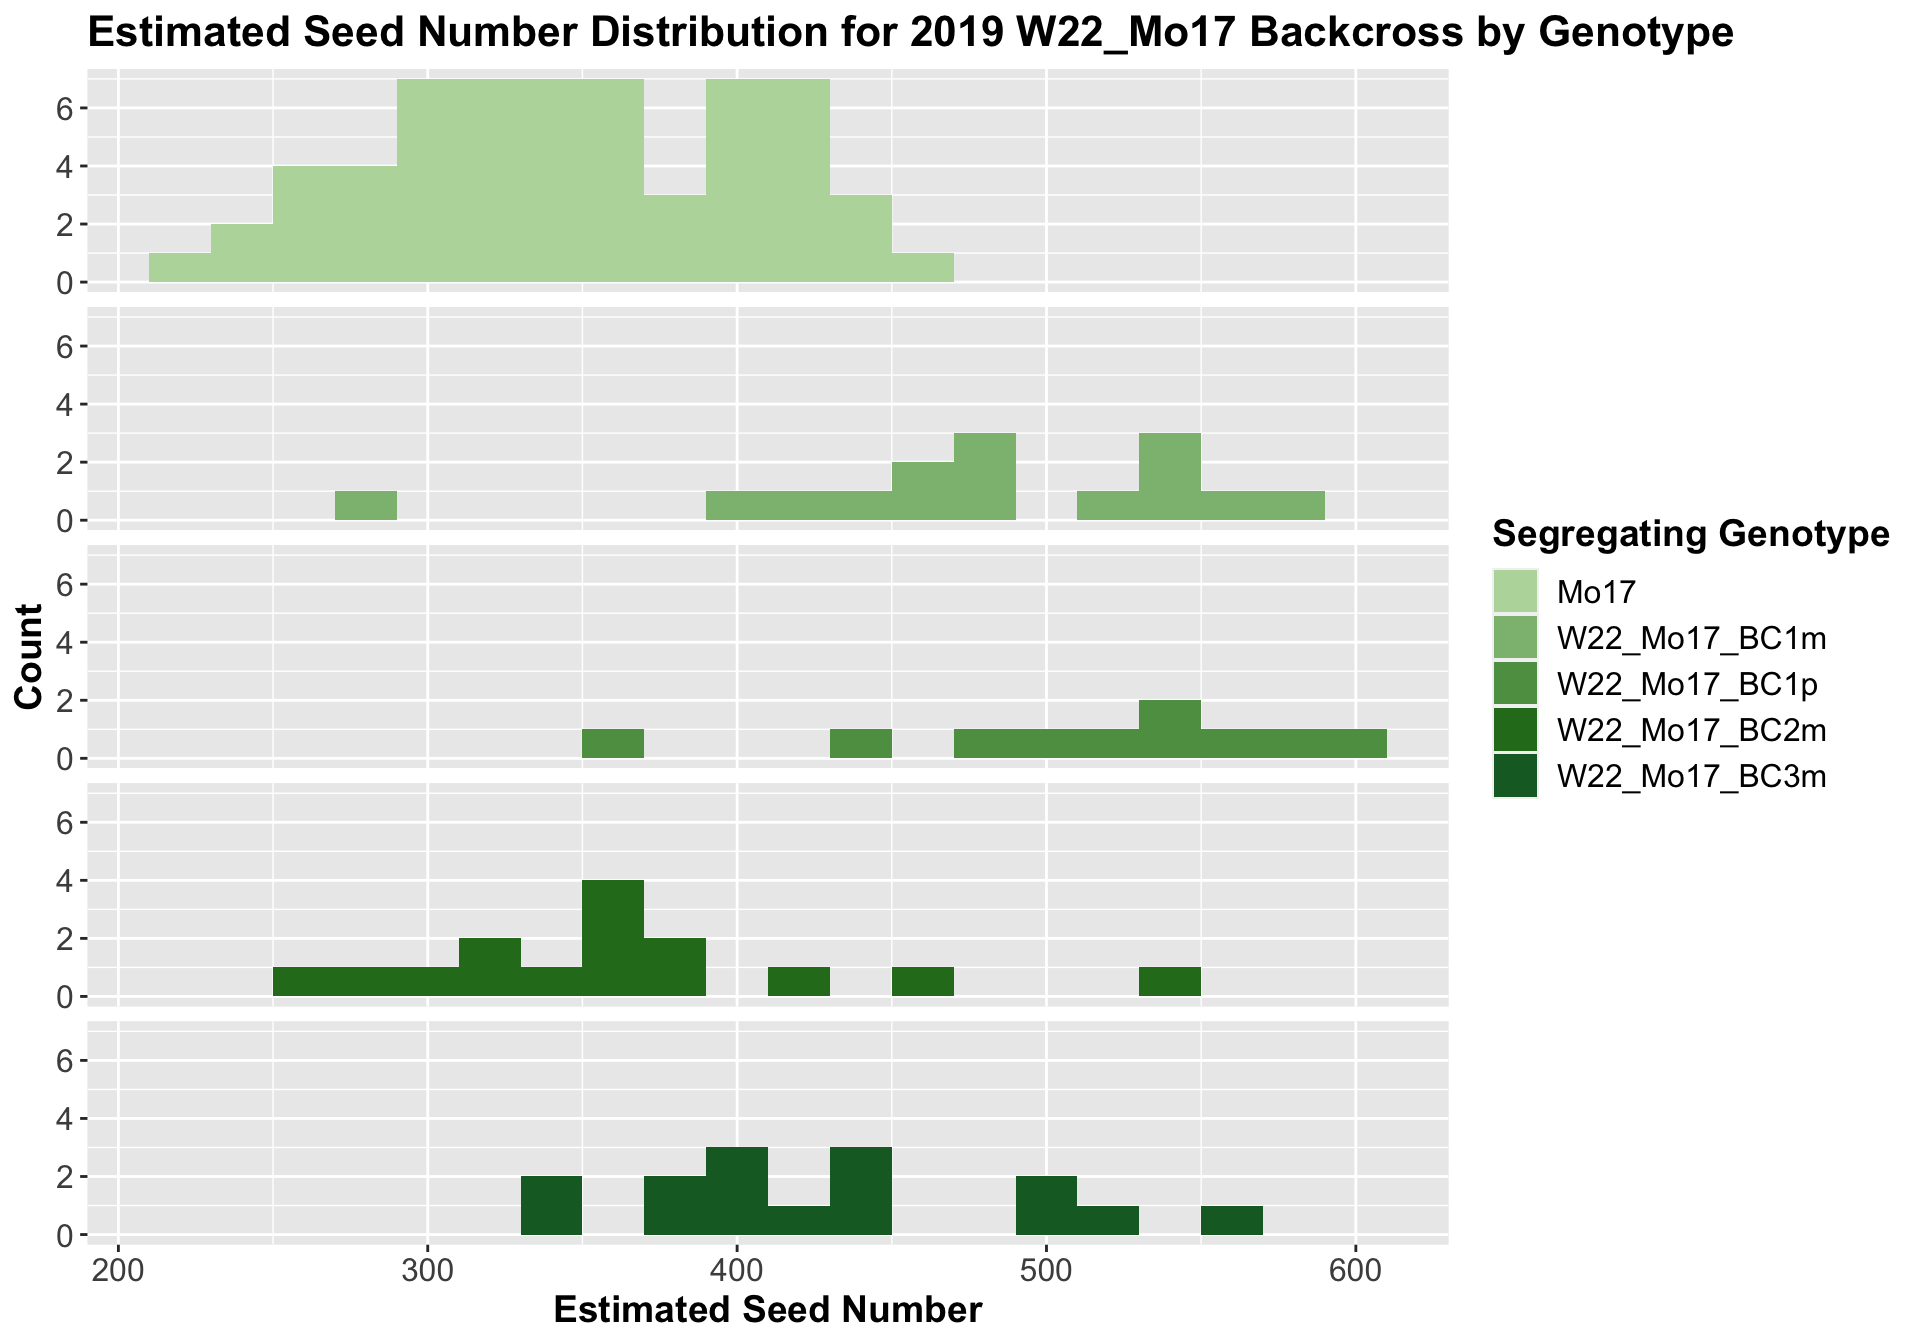
We now compare the distribution for sW22_Mo17 backcrosses to W22_Mo17 backcrosses and how each generaiton compares across these two sets. Note: when looking at these plots, just be aware that the genotypes don't align perfectly across backcrosses because we don't have a few crosses for the W22_Mo17 genotypes.
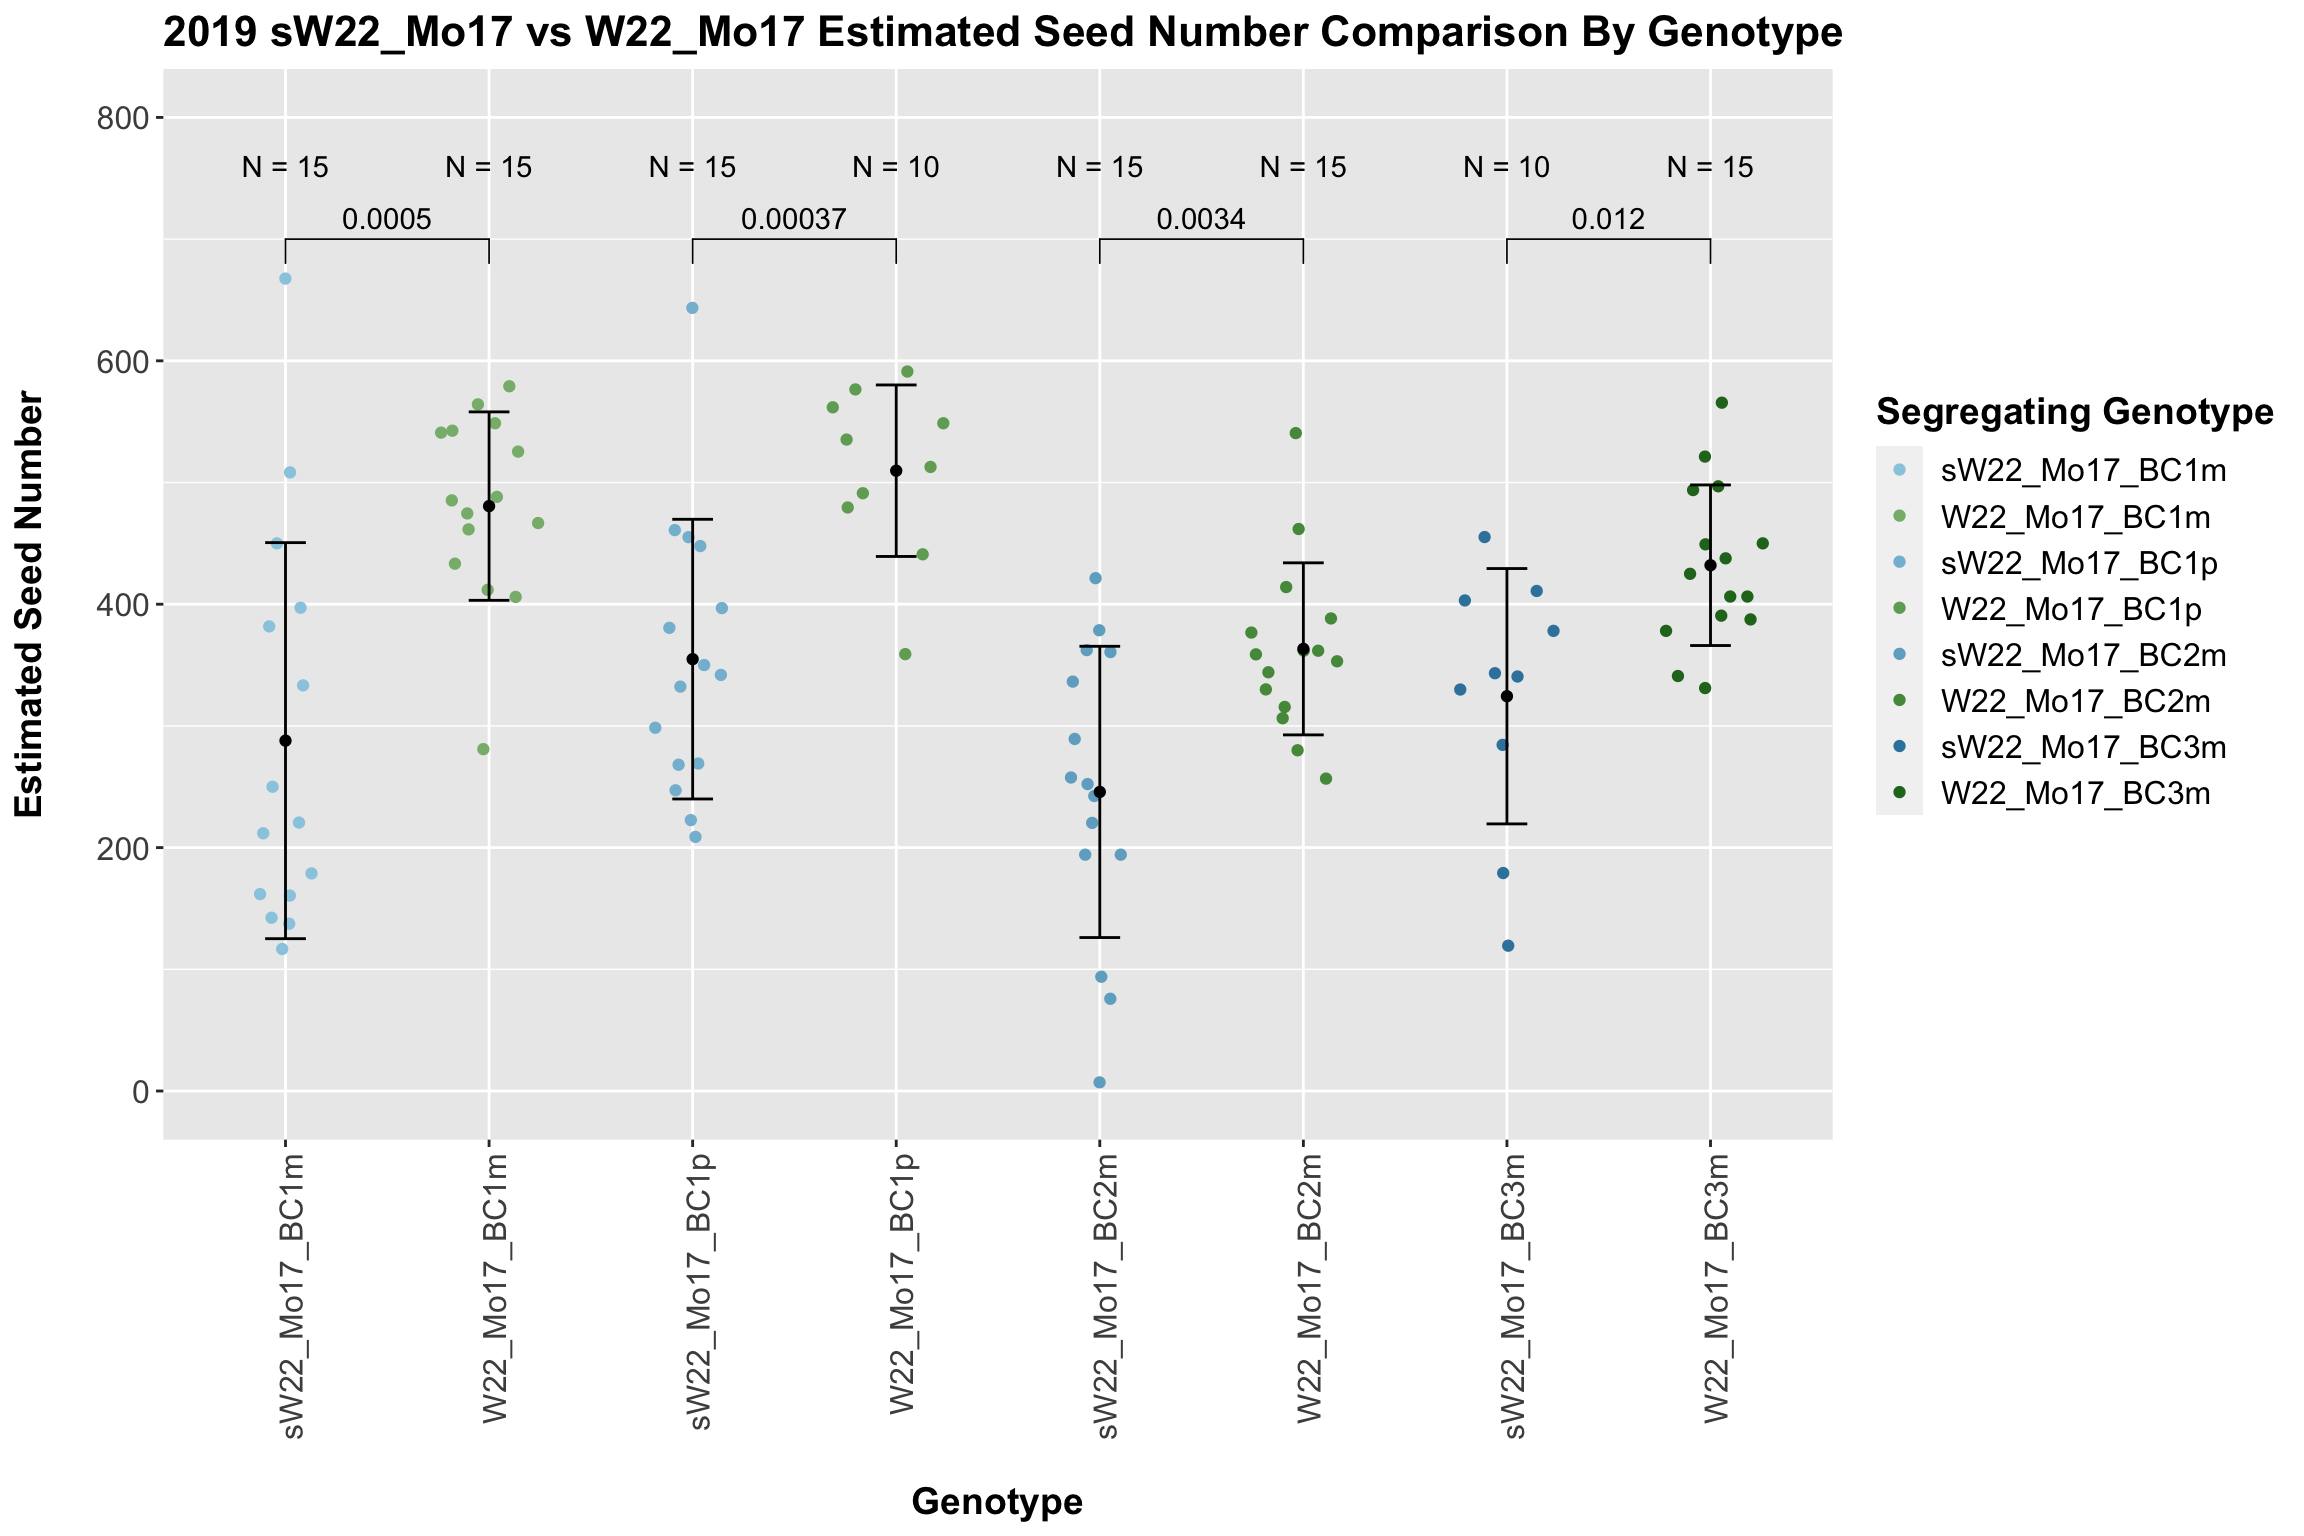
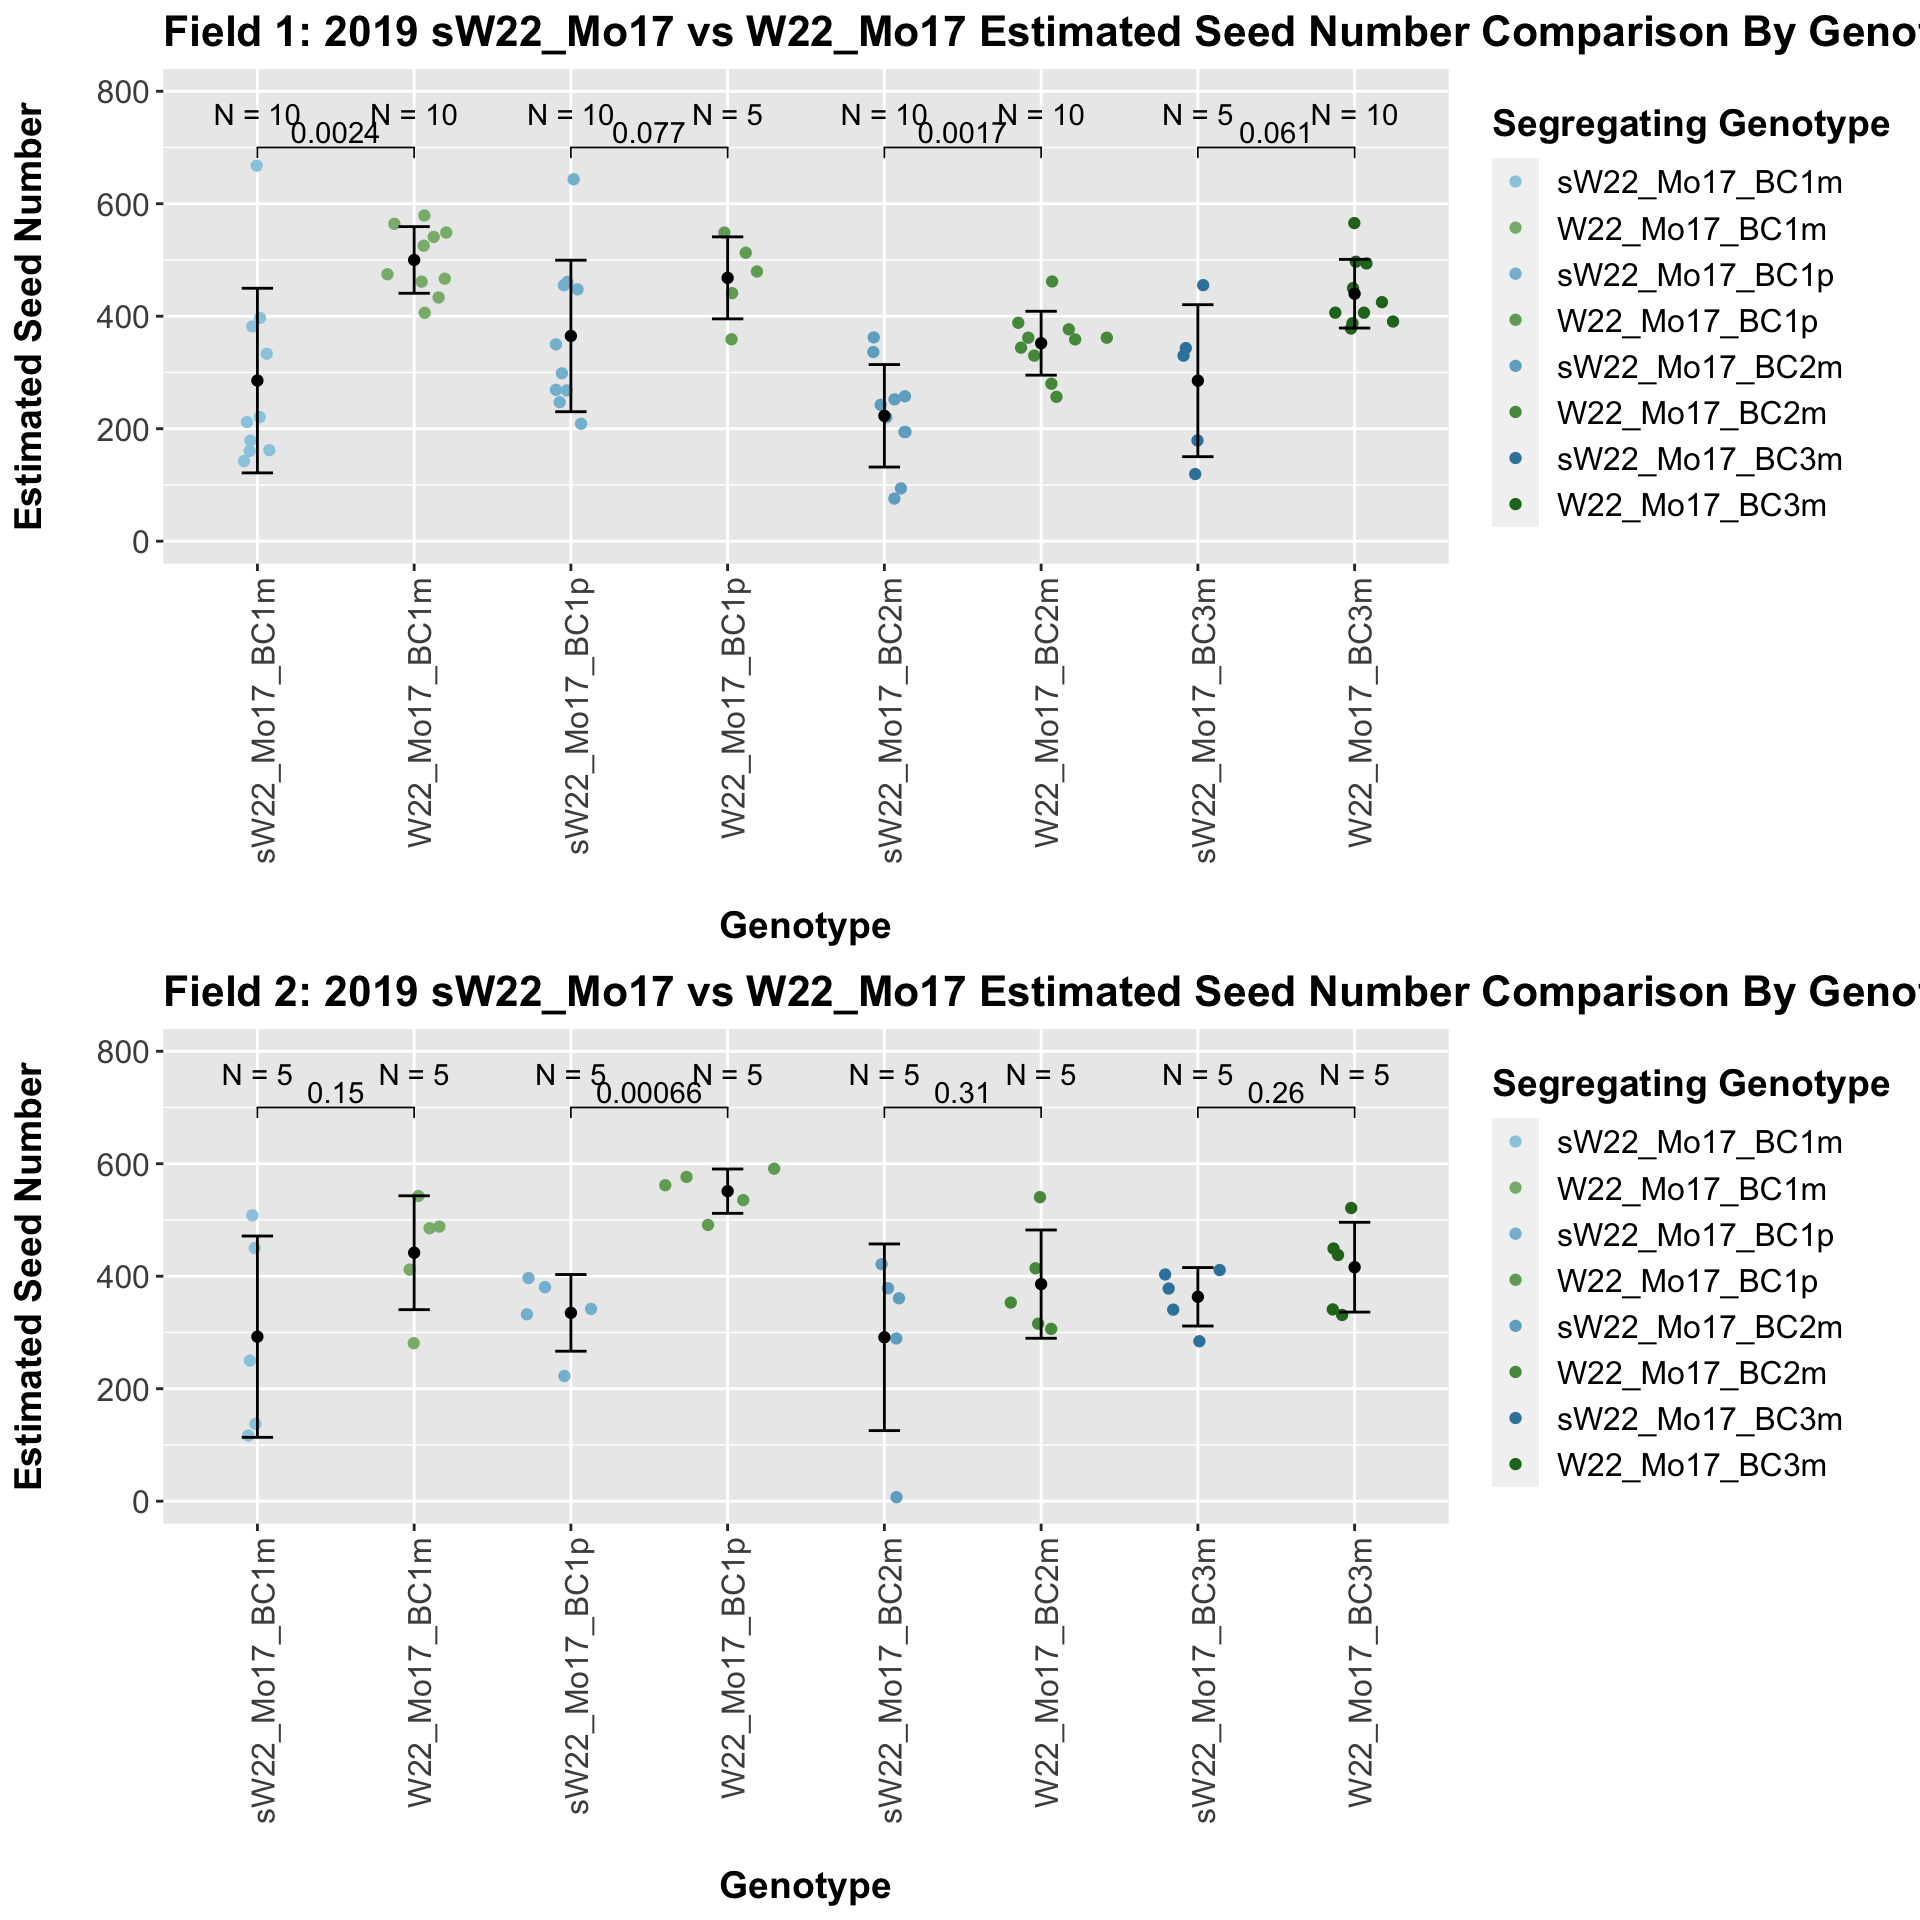
It does seem that the estimated seed number for the sW22_Mo17 is lower than that of the W22_Mo17 crosses; however, this is not always significant, especially in Field 2.
We may also compare the distribution for all sW22 backcrosses (crossed to W22, B73, and Mo17 respectively). Note: when looking at these plots, just be aware that the genotypes don't align perfectly across backcrosses so be sure to check the x-axis.
8.2.4 2019 ANOVA for Estimated Seed Number
We now want to test whether (1) estimated seed number is impacted by the sex of the sick parent and (2) the means across each backcross generation change NOTE: I was not fully confident in how/whether to incorporate the external stock information (W22, B73,Mo17) as these lineages were selfed and therefore had no sick parent to test the sex of. We also transformed the categorical genotype values (F1,BC1,BC2,BC3,BC4,BC5) to numerical values (0,1,2,3,4,5).NOTE: I'm not sure if this is appropriate. It'd be fairly simple to switch this back to categorical values if that would be better
We start by fitting a series of linear models:
- mod_full_int: ESN (Numerical) ~ Field (Cateogrical) + Genotype (Numerical) + Sick_Sex (Categorical) + Genotype*Sick_Sex
- mod_full: ESN (Numerical) ~ Field (Categorical) + Genotype (Numerical) + Sick_Sex (Categorical)
- mod_geno: ESN (Numerical) ~ Field (Cateogrical) + Genotype (Numerical)
- mod_sex: ESN (Numerical) ~ Field + Sick_Sex (Categorical)
We can then compare the fit of these models to our data using an ANOVA to test whether the more complex model (mod_full) is significantly better at capturing our height data than either of our simpler models. This will tell us whether incorporating sex/genotype significantly improves our model.
We can summarize the results of this across each set of genotypes. The significance codes are as follows:
- '***' - between 0 and 0.001
- '**' - between 0.001 and 0.01
- '*' - between 0.01 and 0.05
- '.' - between 0.05 and 0.1
- ' ' - between 0.1 and 1
##    Geno_Set   Sex_PValue Sex_Signif Genotype_PValue Genotype_Signif
## 1  sW22_W22 1.335174e-07        ***    1.401480e-01
## 2  sW22_B73 4.375980e-03         **    4.806909e-21             ***
## 3 sW22_Mo17 5.195882e-01               2.633020e-06             ***
## 4   W22_B73 8.116719e-01               1.249759e-10             ***
## 5  W22_Mo17 7.495160e-02          .    1.122519e-01
##   Sex_Geno_Int_PValue Sex_Geno_Int_Signif
## 1           0.1193437
## 2           0.7880117
## 3           0.1420256
## 4           0.8139641
## 5                  NA