Chapter 4 Ear Height
4.1 2019 Ear Height Data
4.1.1 2019 sW22 backcrossed to W22
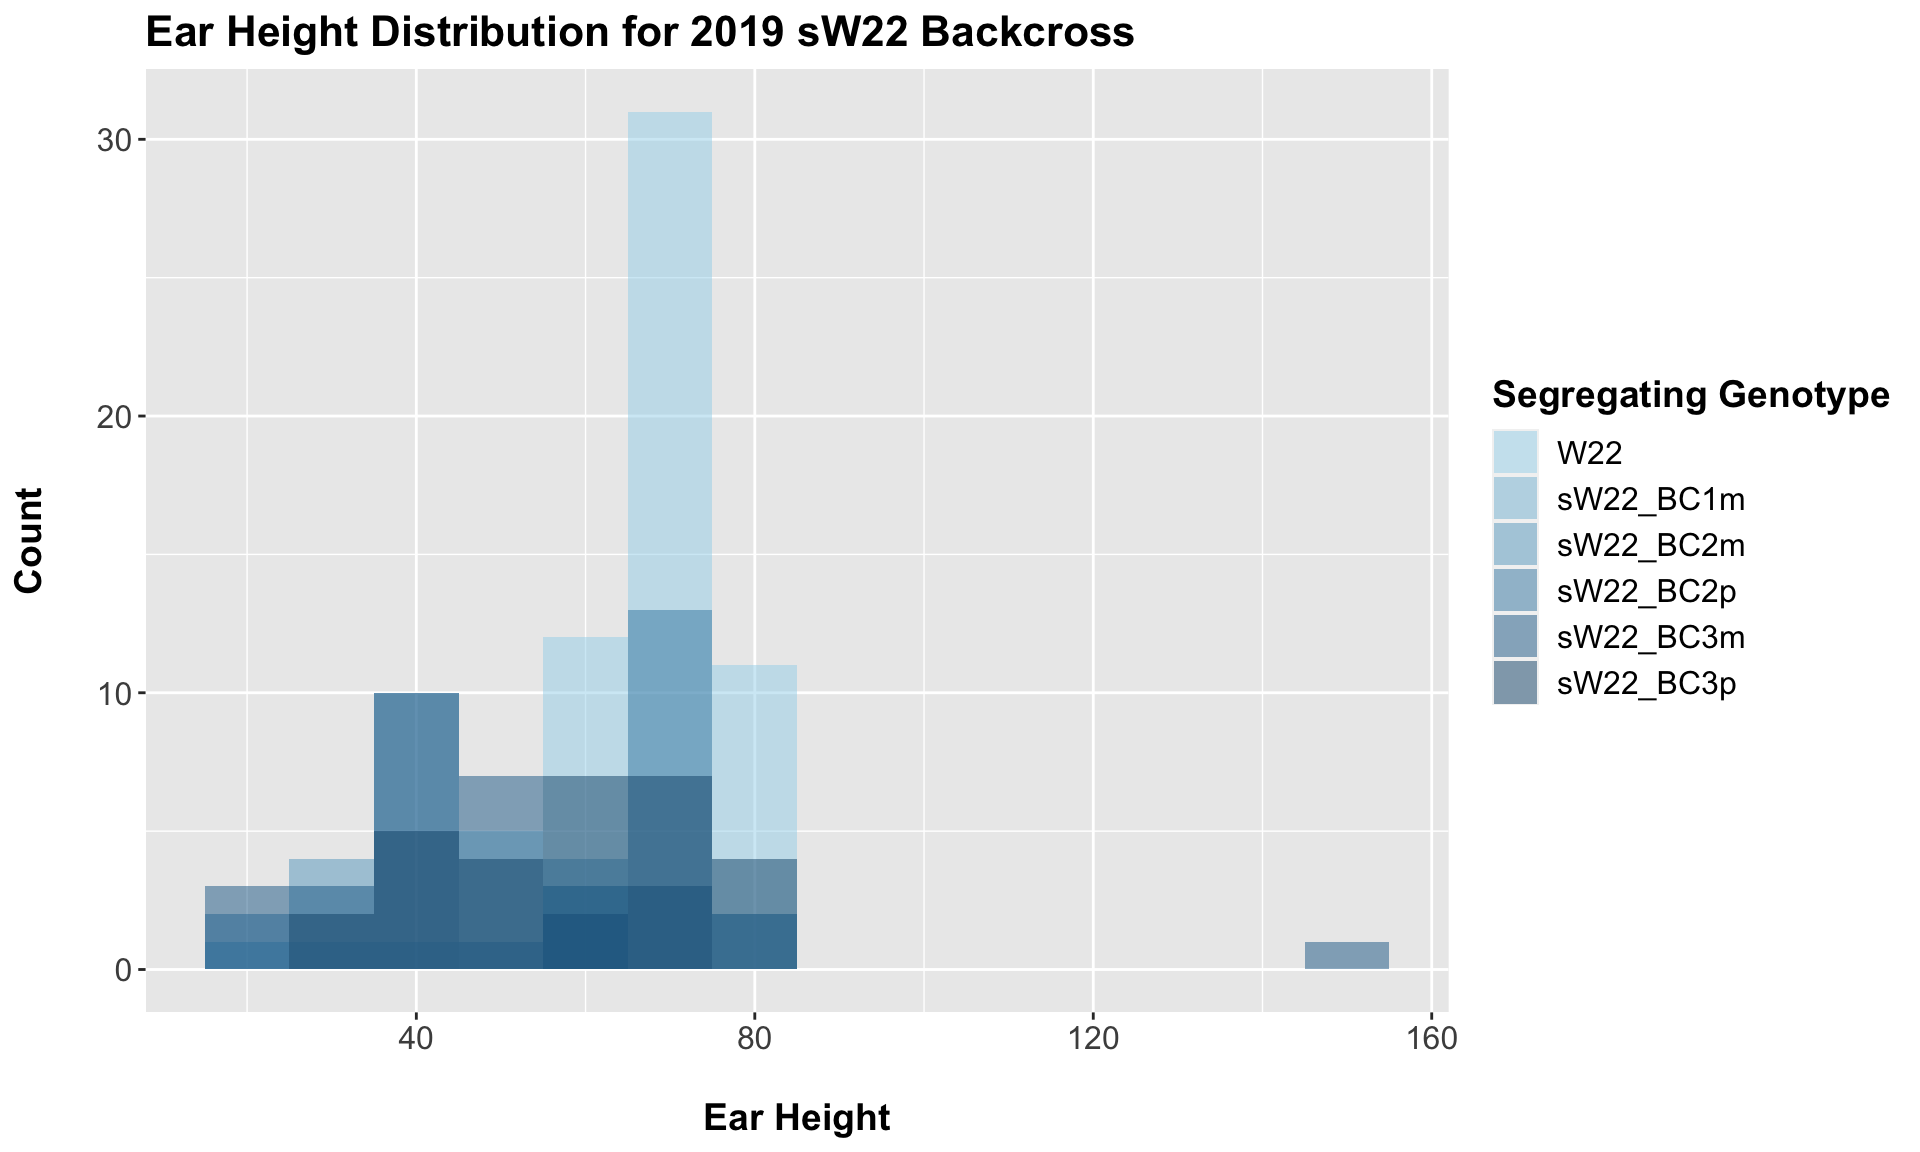
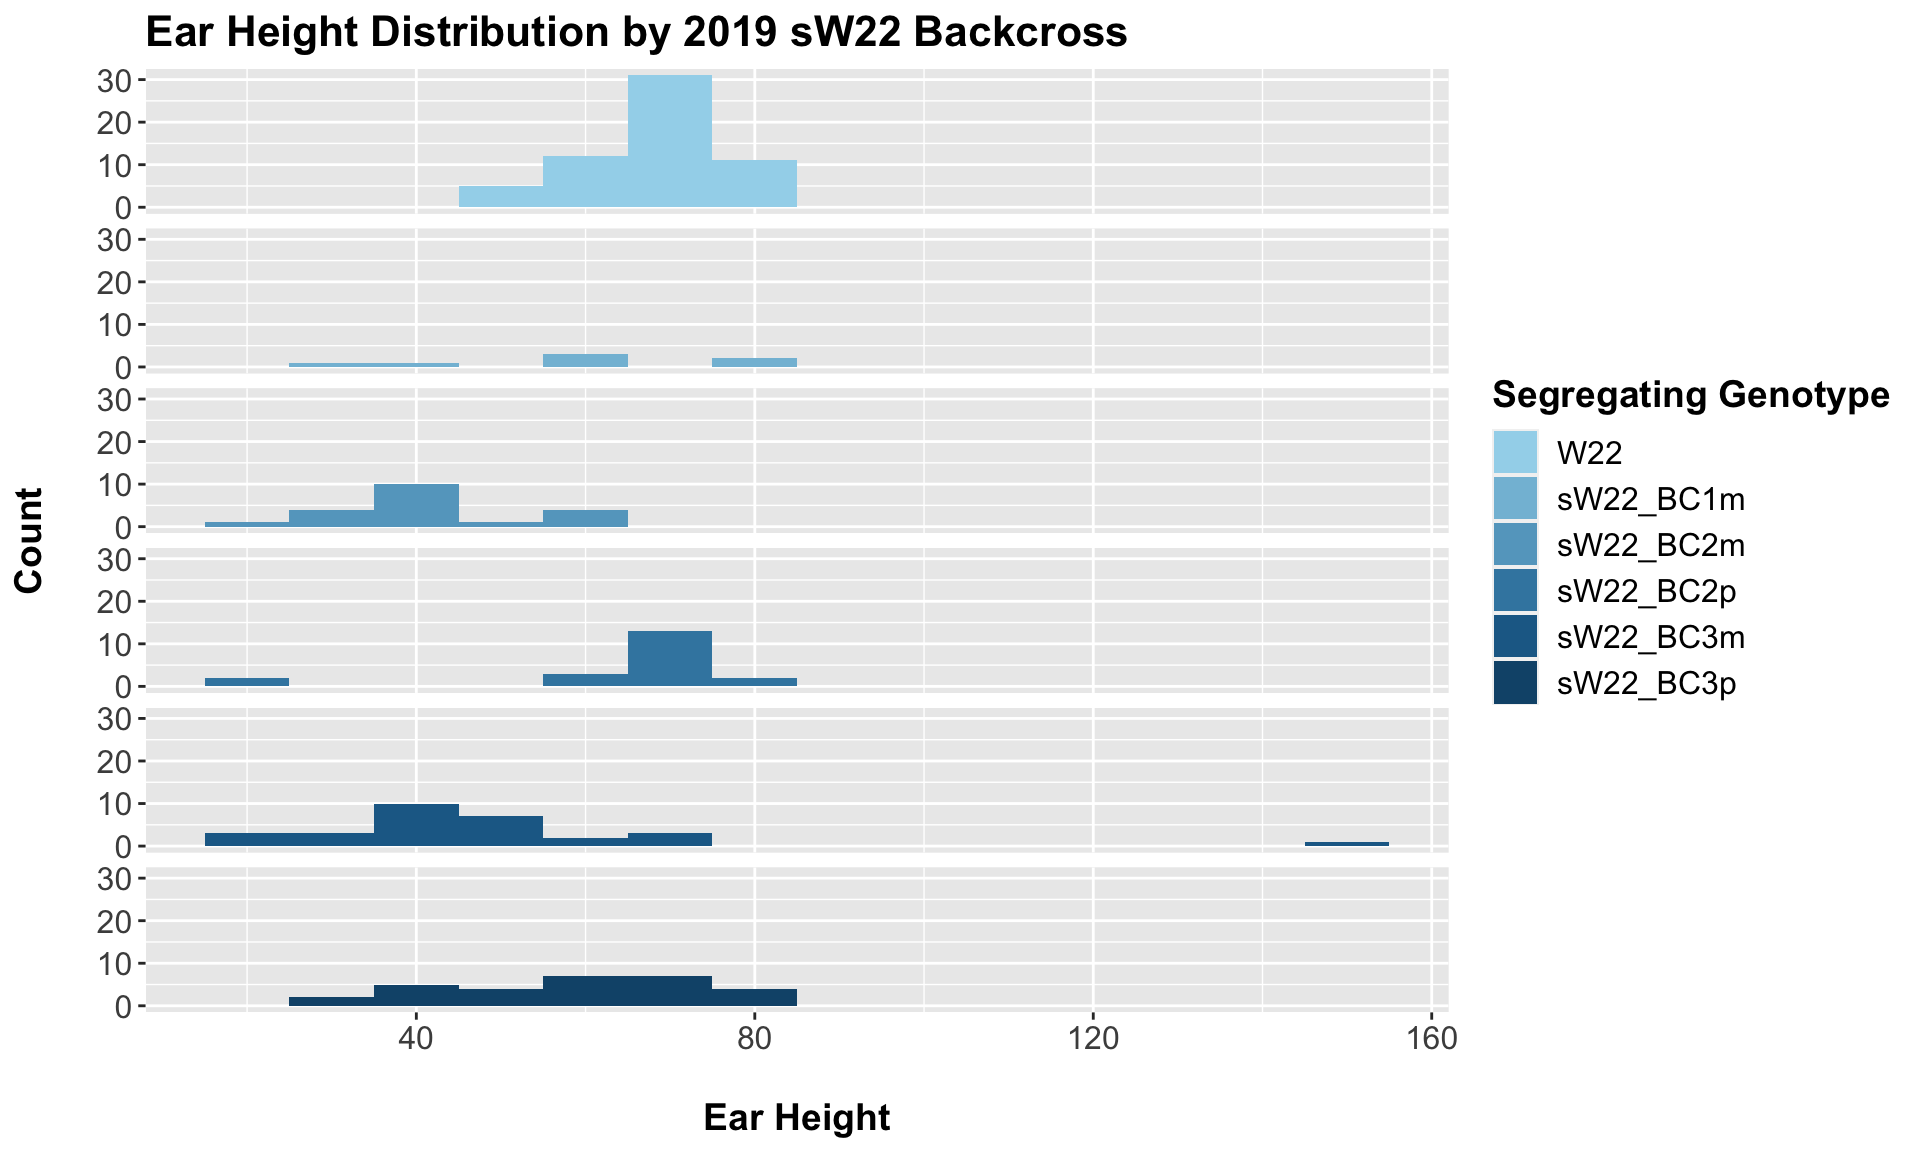
##
##  Mean, SD, and SE for each genotype
## Seg_Genotype N mean sd se
## 1 W22 59 68.84746 7.785516 1.013588
## 2 sW22_BC1m 7 57.28571 16.590301 6.270544
## 3 sW22_BC2m 20 42.60000 10.738029 2.401096
## 4 sW22_BC2p 20 66.50000 15.965423 3.569977
## 5 sW22_BC3m 29 48.86207 22.762319 4.226856
## 6 sW22_BC3p 29 58.93103 14.901896 2.767213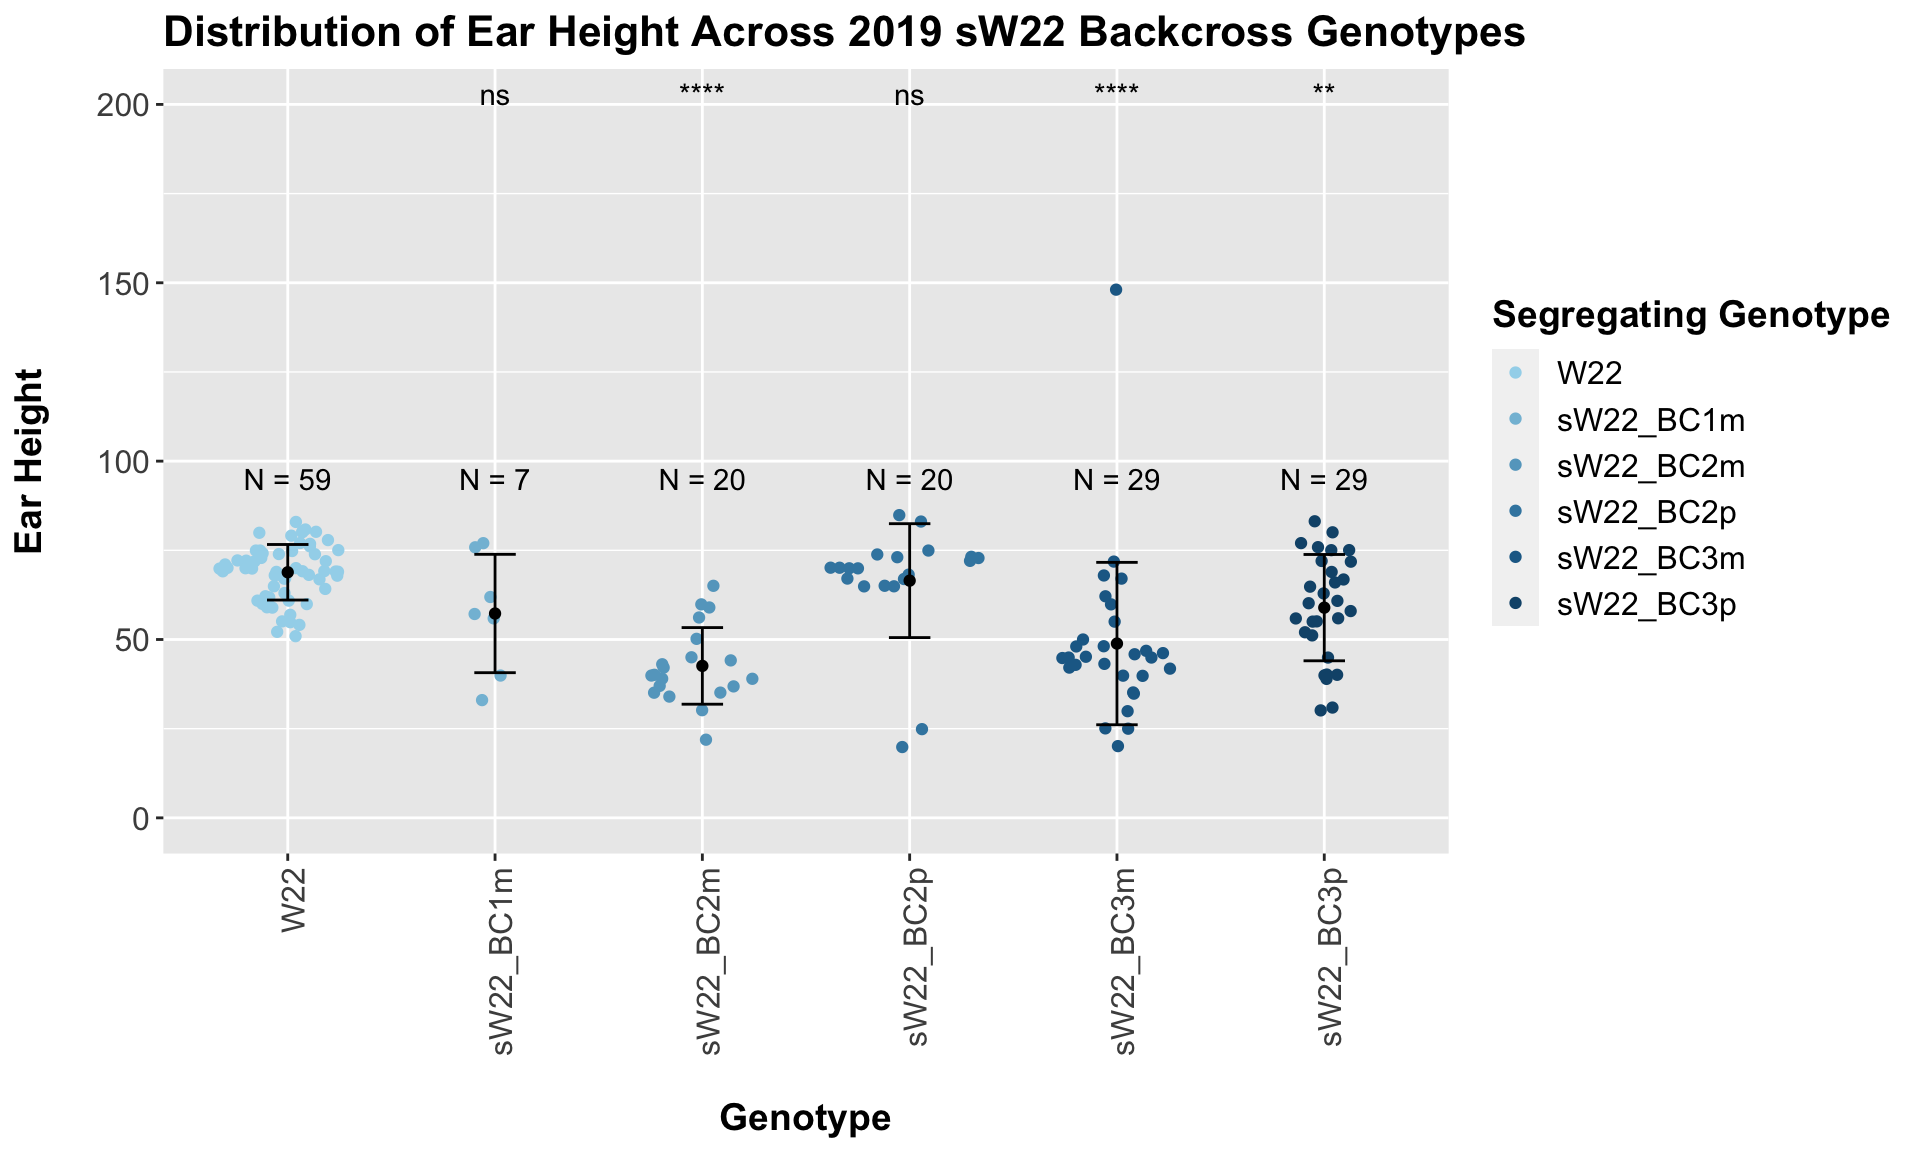
##
## Results of T-test used to obtain significance in the above plot
## # A tibble: 5 x 8
## .y. group1 group2 p p.adj p.format p.signif method
## <chr> <chr> <chr> <dbl> <dbl> <chr> <chr> <chr>
## 1 Plant_Height W22 sW22_BC1m 1.16e- 1 0.23 0.1161 ns T-test
## 2 Plant_Height W22 sW22_BC2m 1.75e-10 0.00000000088 1.8e-10 **** T-test
## 3 Plant_Height W22 sW22_BC2p 5.34e- 1 0.53 0.5335 ns T-test
## 4 Plant_Height W22 sW22_BC3m 6.67e- 5 0.00027 6.7e-05 **** T-test
## 5 Plant_Height W22 sW22_BC3p 1.84e- 3 0.0055 0.0018 ** T-testWe see a reduction in ear height across the sW22 backcrosses compared to W22. The magnitude of this reduction is not as large as with plant height, but I'm not sure if that is to be expected given this phenotype. We can explore whether this holds if we stratify the data by field.
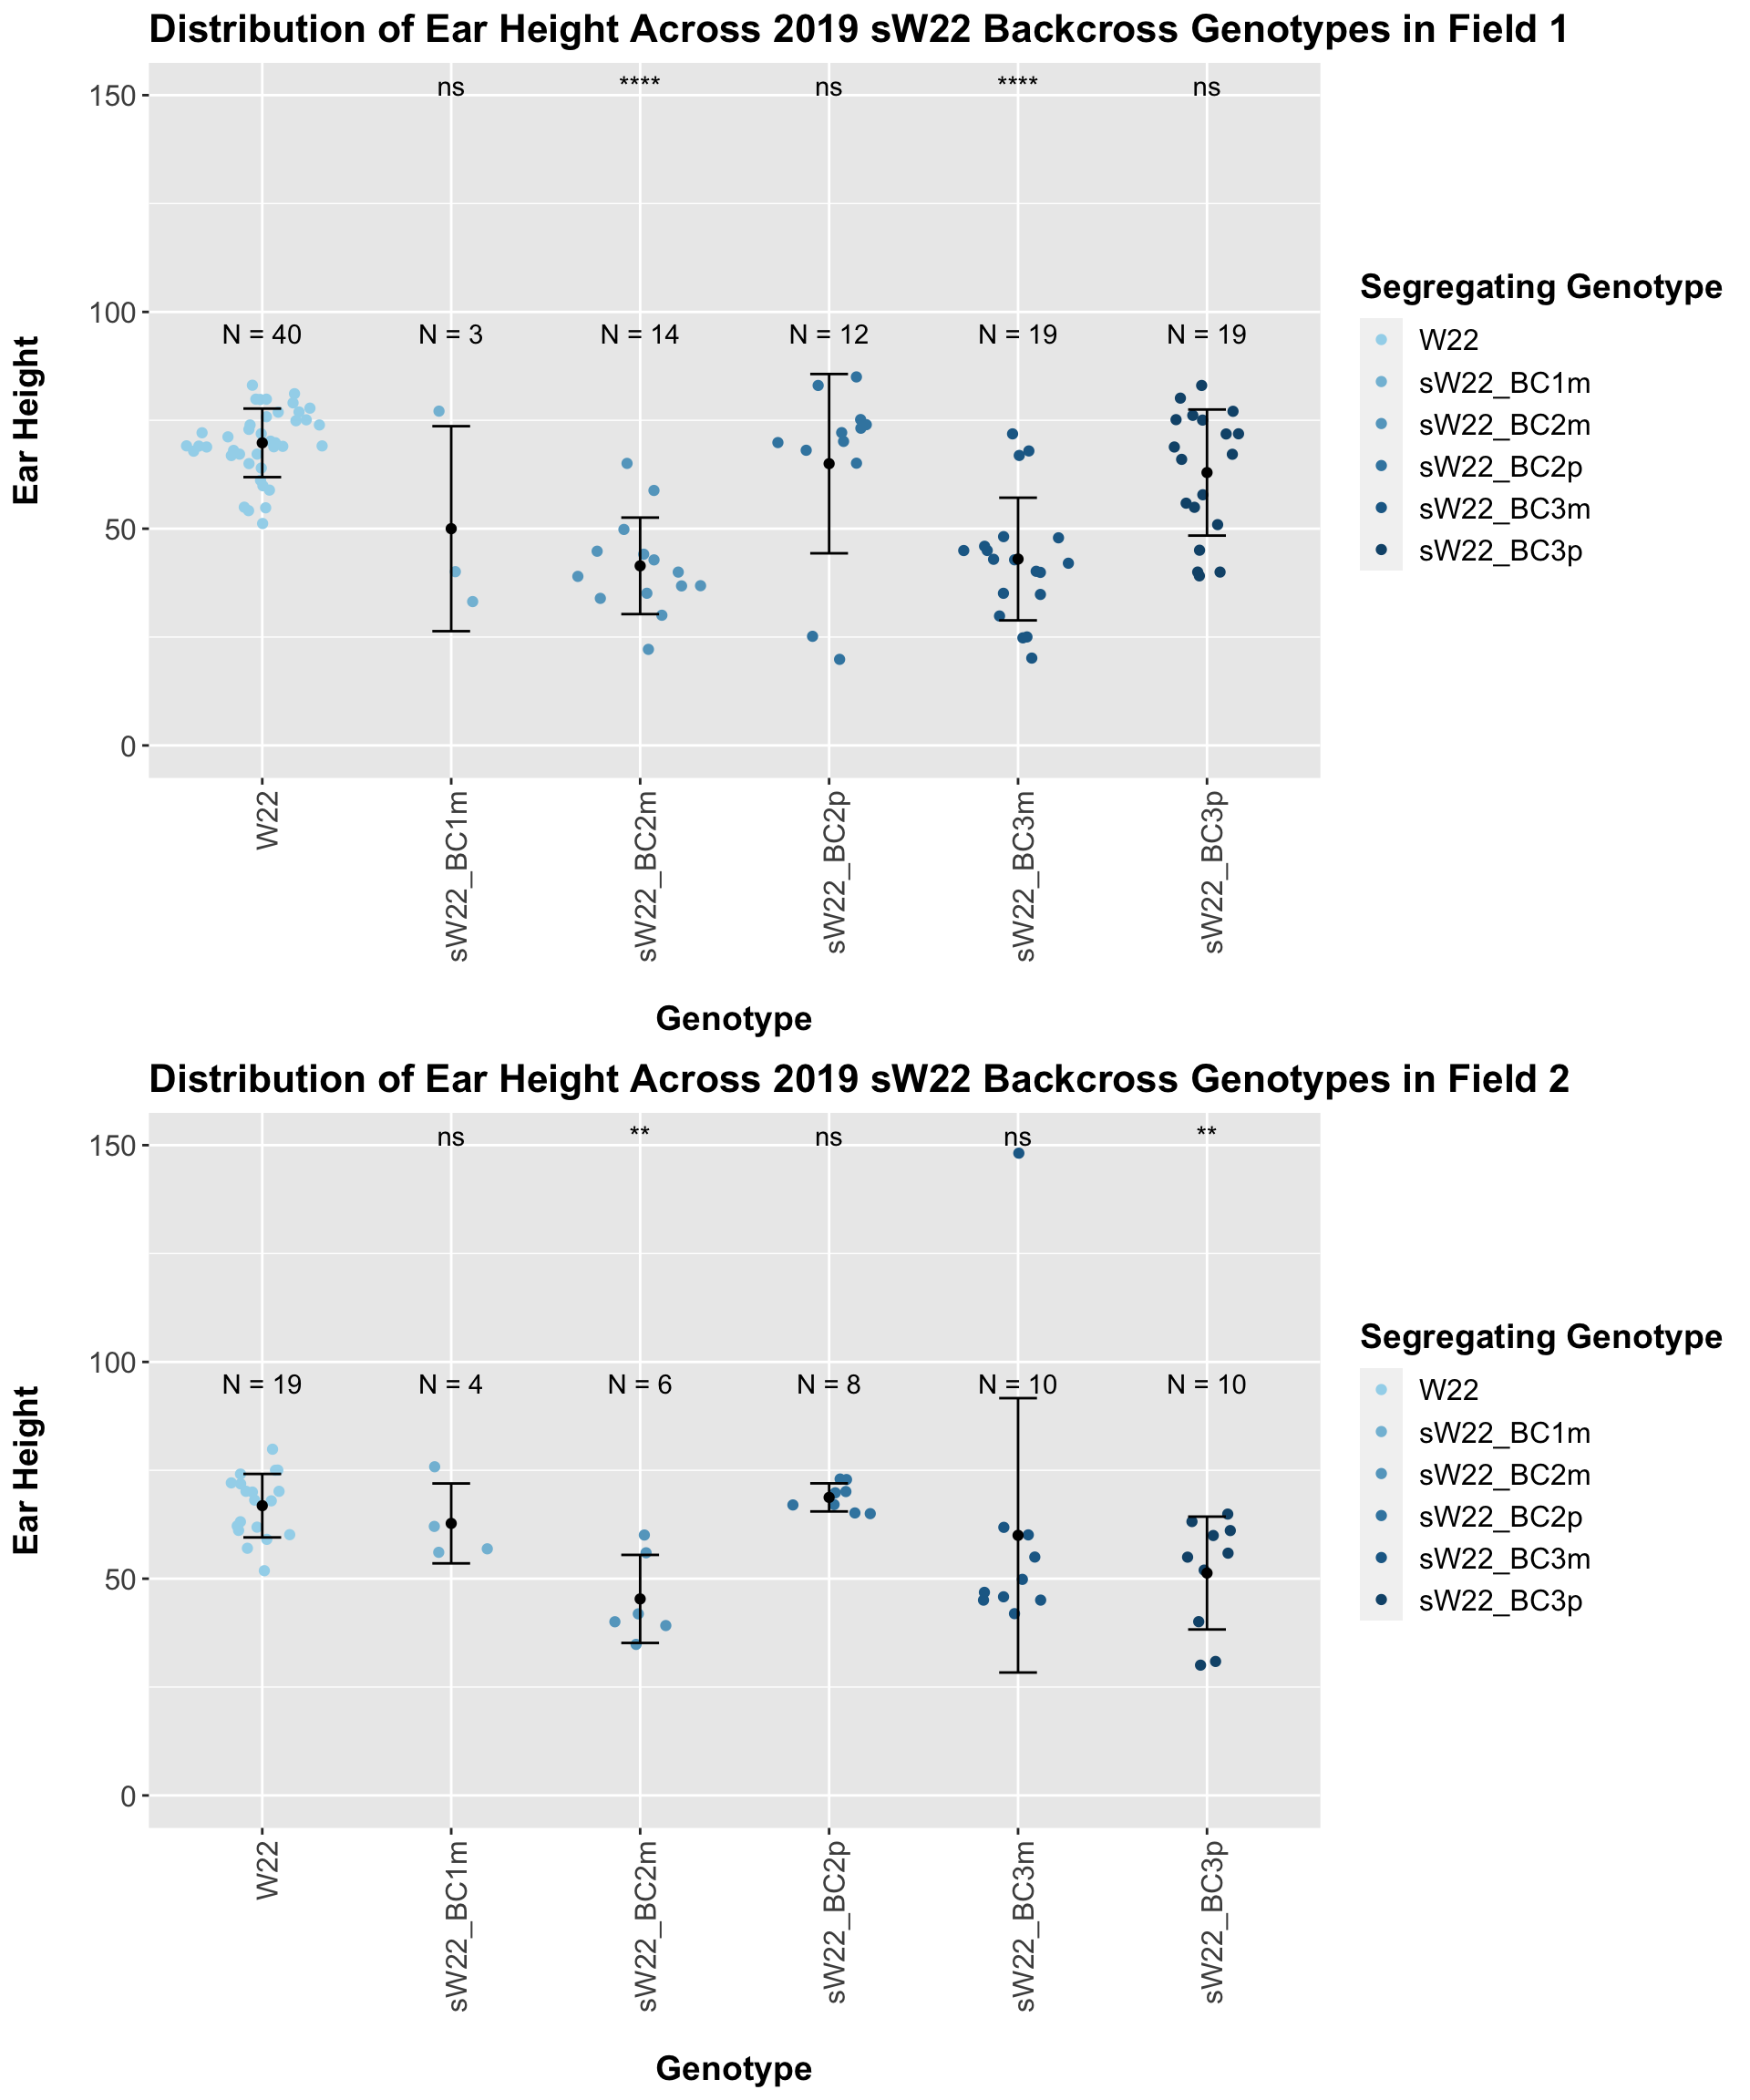
Our results seem incosistent. It does seem like there is a decline in ear height, but it is not consitently significant. In Field 2, we find that the ear height of sW22 backcrosses is not significantly different from the W22 ear height.
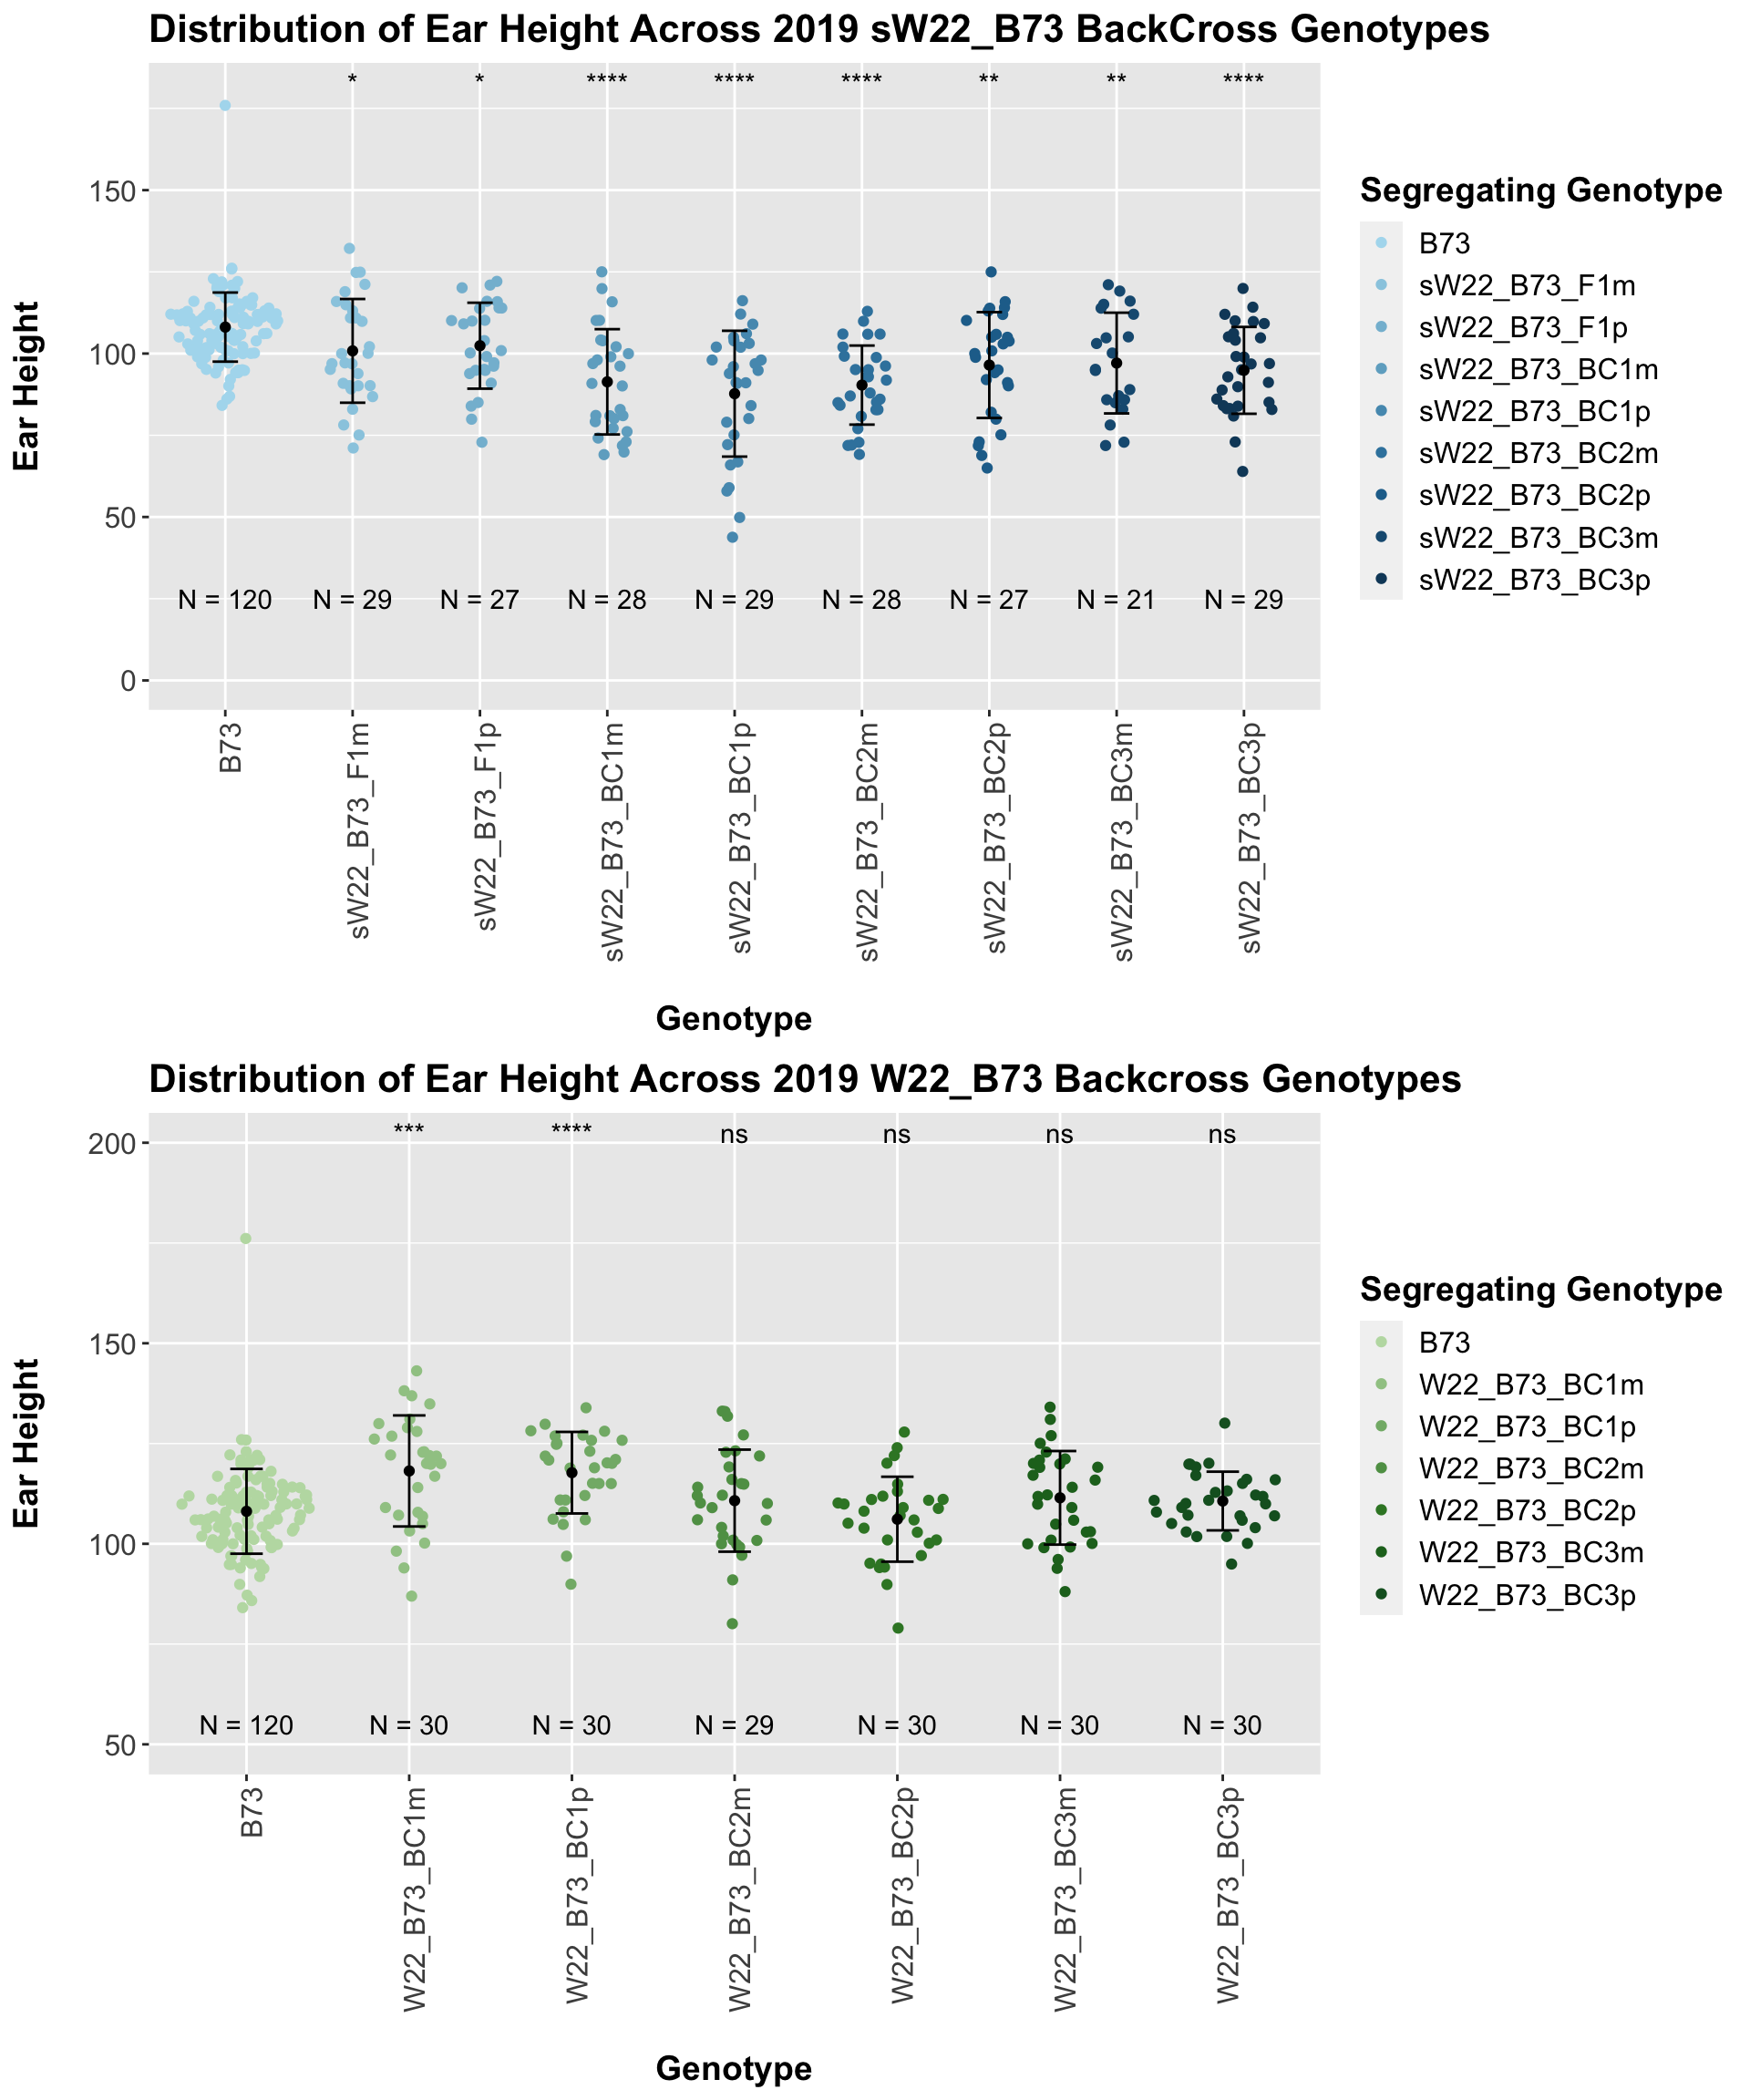
4.1.2 2019 sW22 and W22 backcrossed to B73
##
##  Mean, SD, and SE for each genotype
## Seg_Genotype N mean sd se
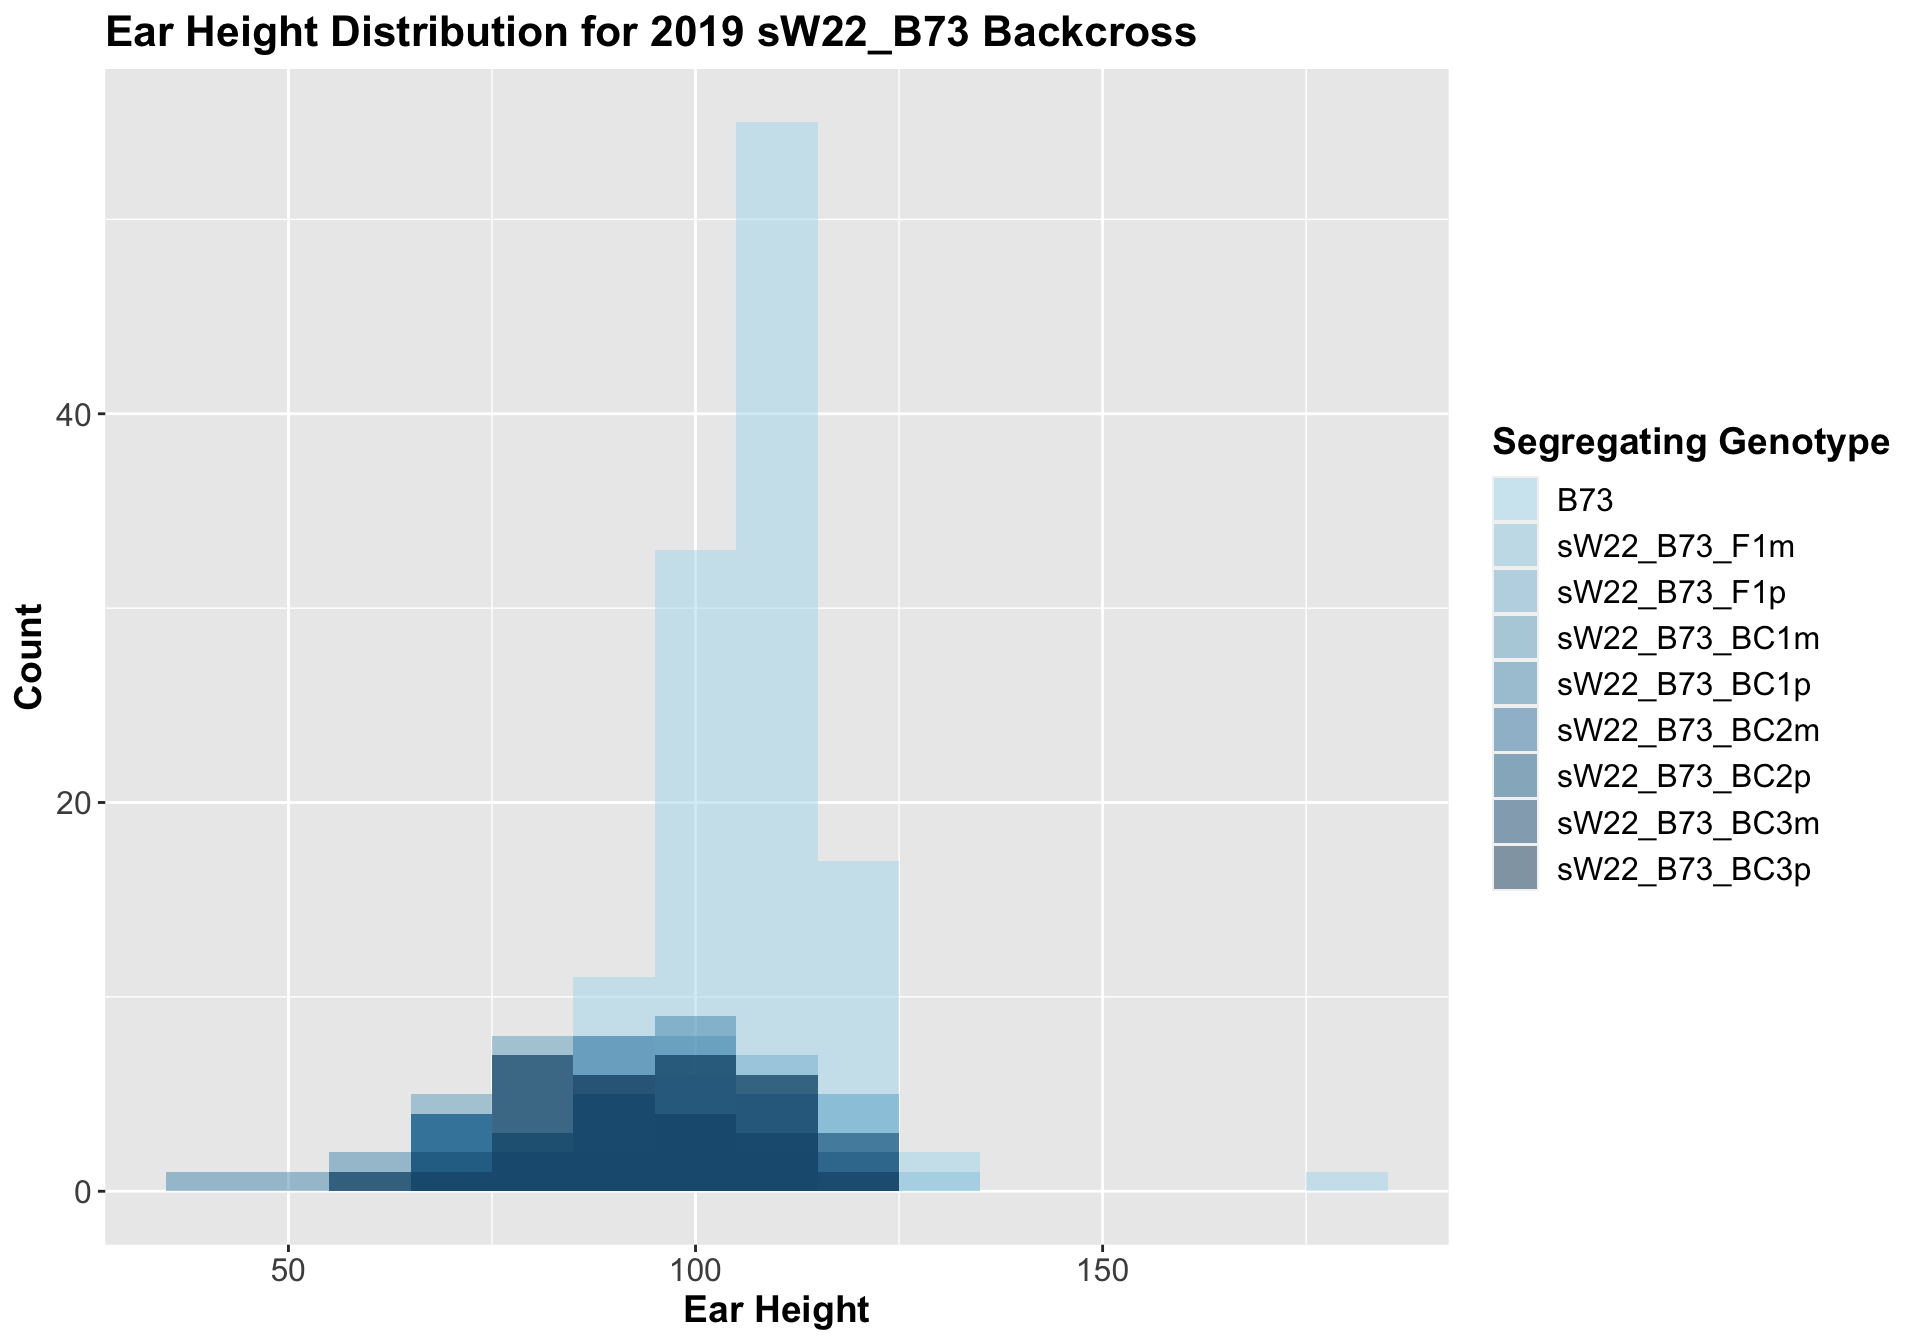
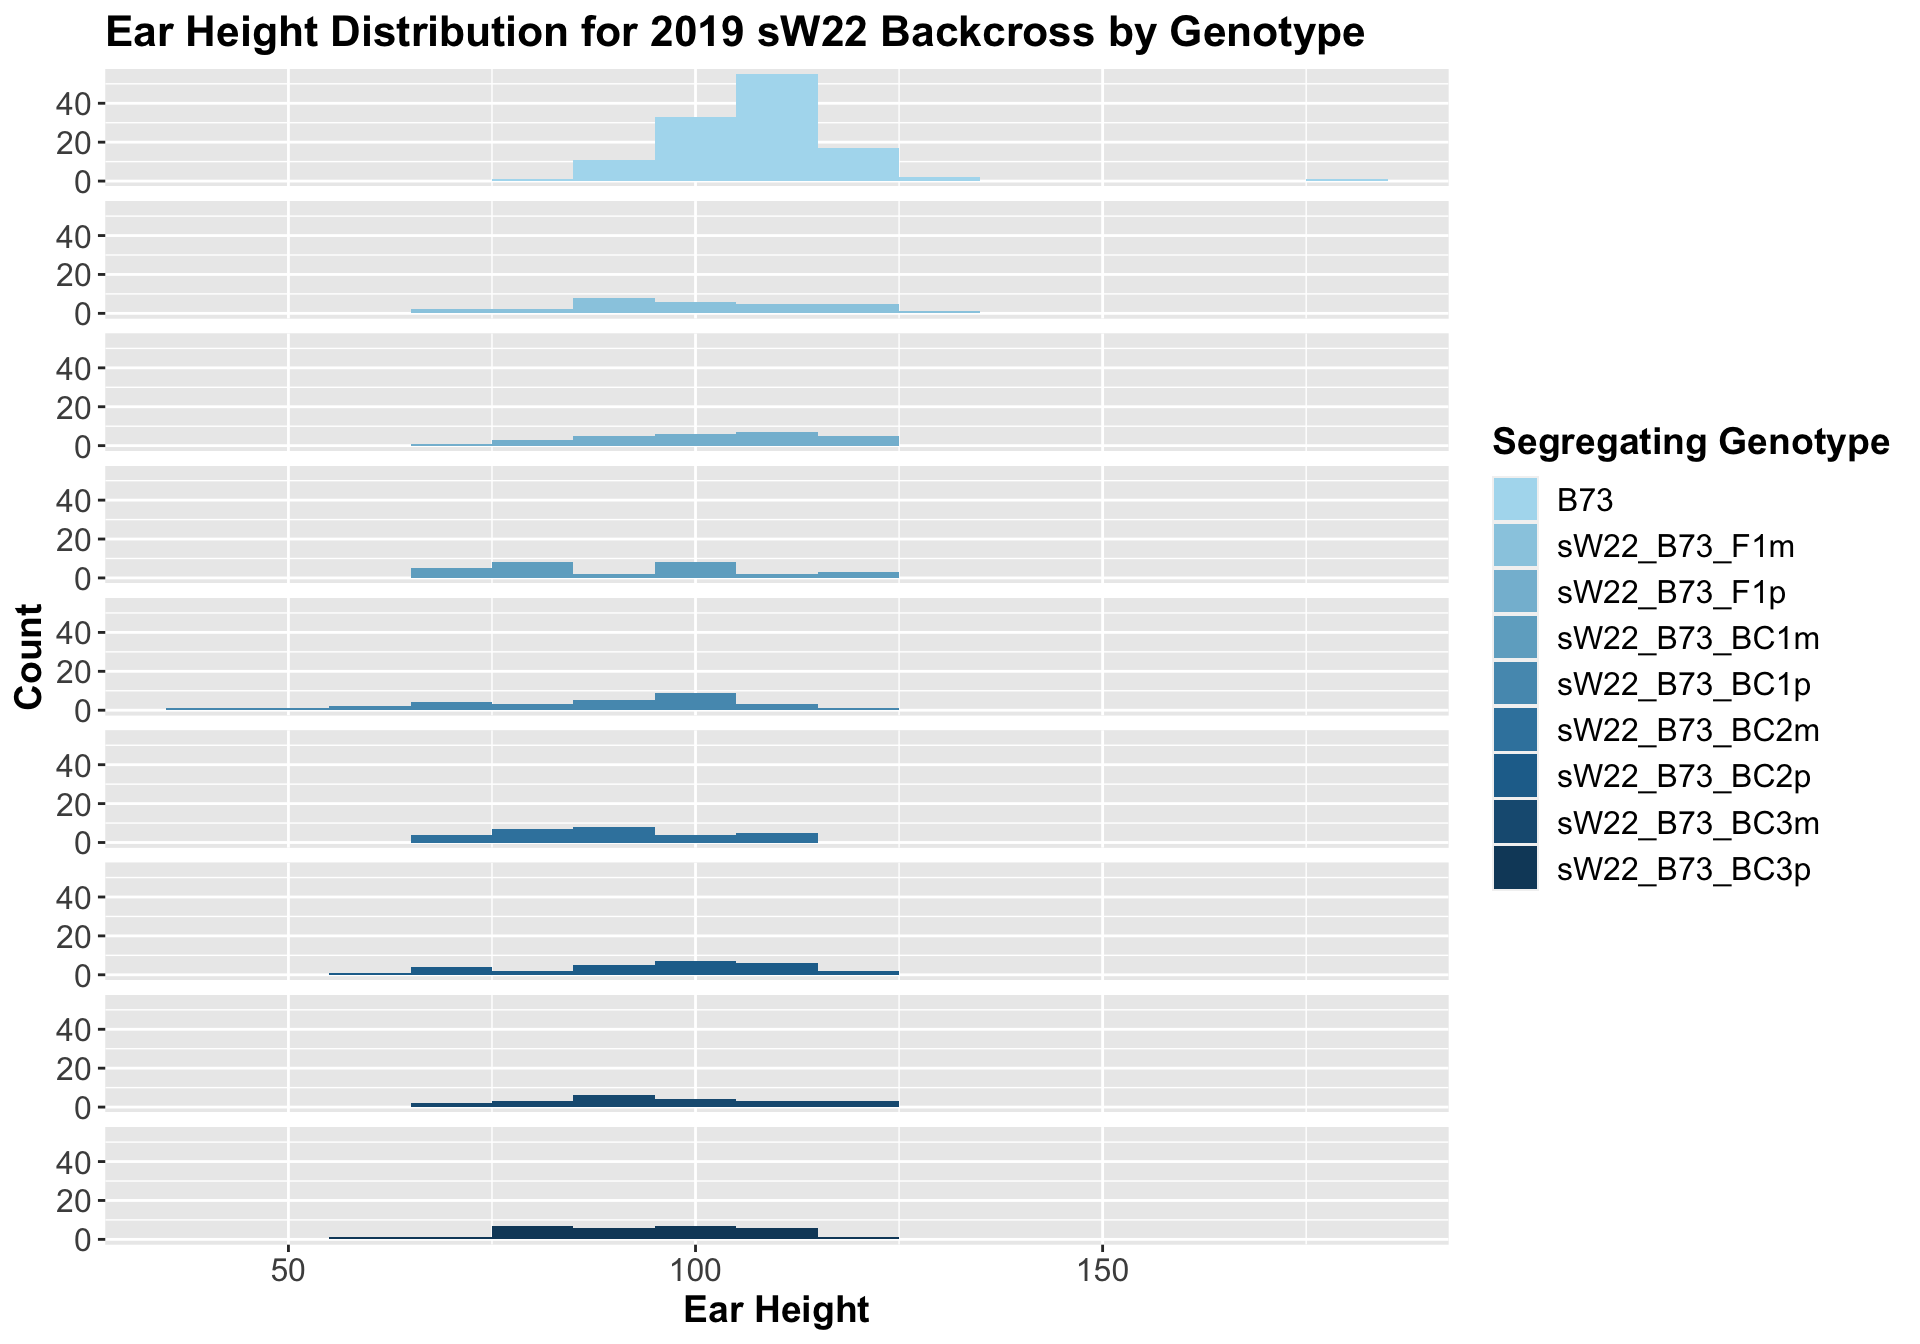
## 1 B73 120 108.10000 10.57141 0.9650329
## 2 sW22_B73_F1m 29 100.82759 15.86791 2.9465973
## 3 sW22_B73_F1p 27 102.40741 13.14786 2.5303059
## 4 sW22_B73_BC1m 28 91.35714 16.10662 3.0438655
## 5 sW22_B73_BC1p 29 87.72414 19.24818 3.5742982
## 6 sW22_B73_BC2m 28 90.35714 12.09289 2.2853422
## 7 sW22_B73_BC2p 27 96.48148 16.19442 3.1166177
## 8 sW22_B73_BC3m 21 97.09524 15.40748 3.3621880
## 9 sW22_B73_BC3p 29 94.86207 13.28190 2.4663869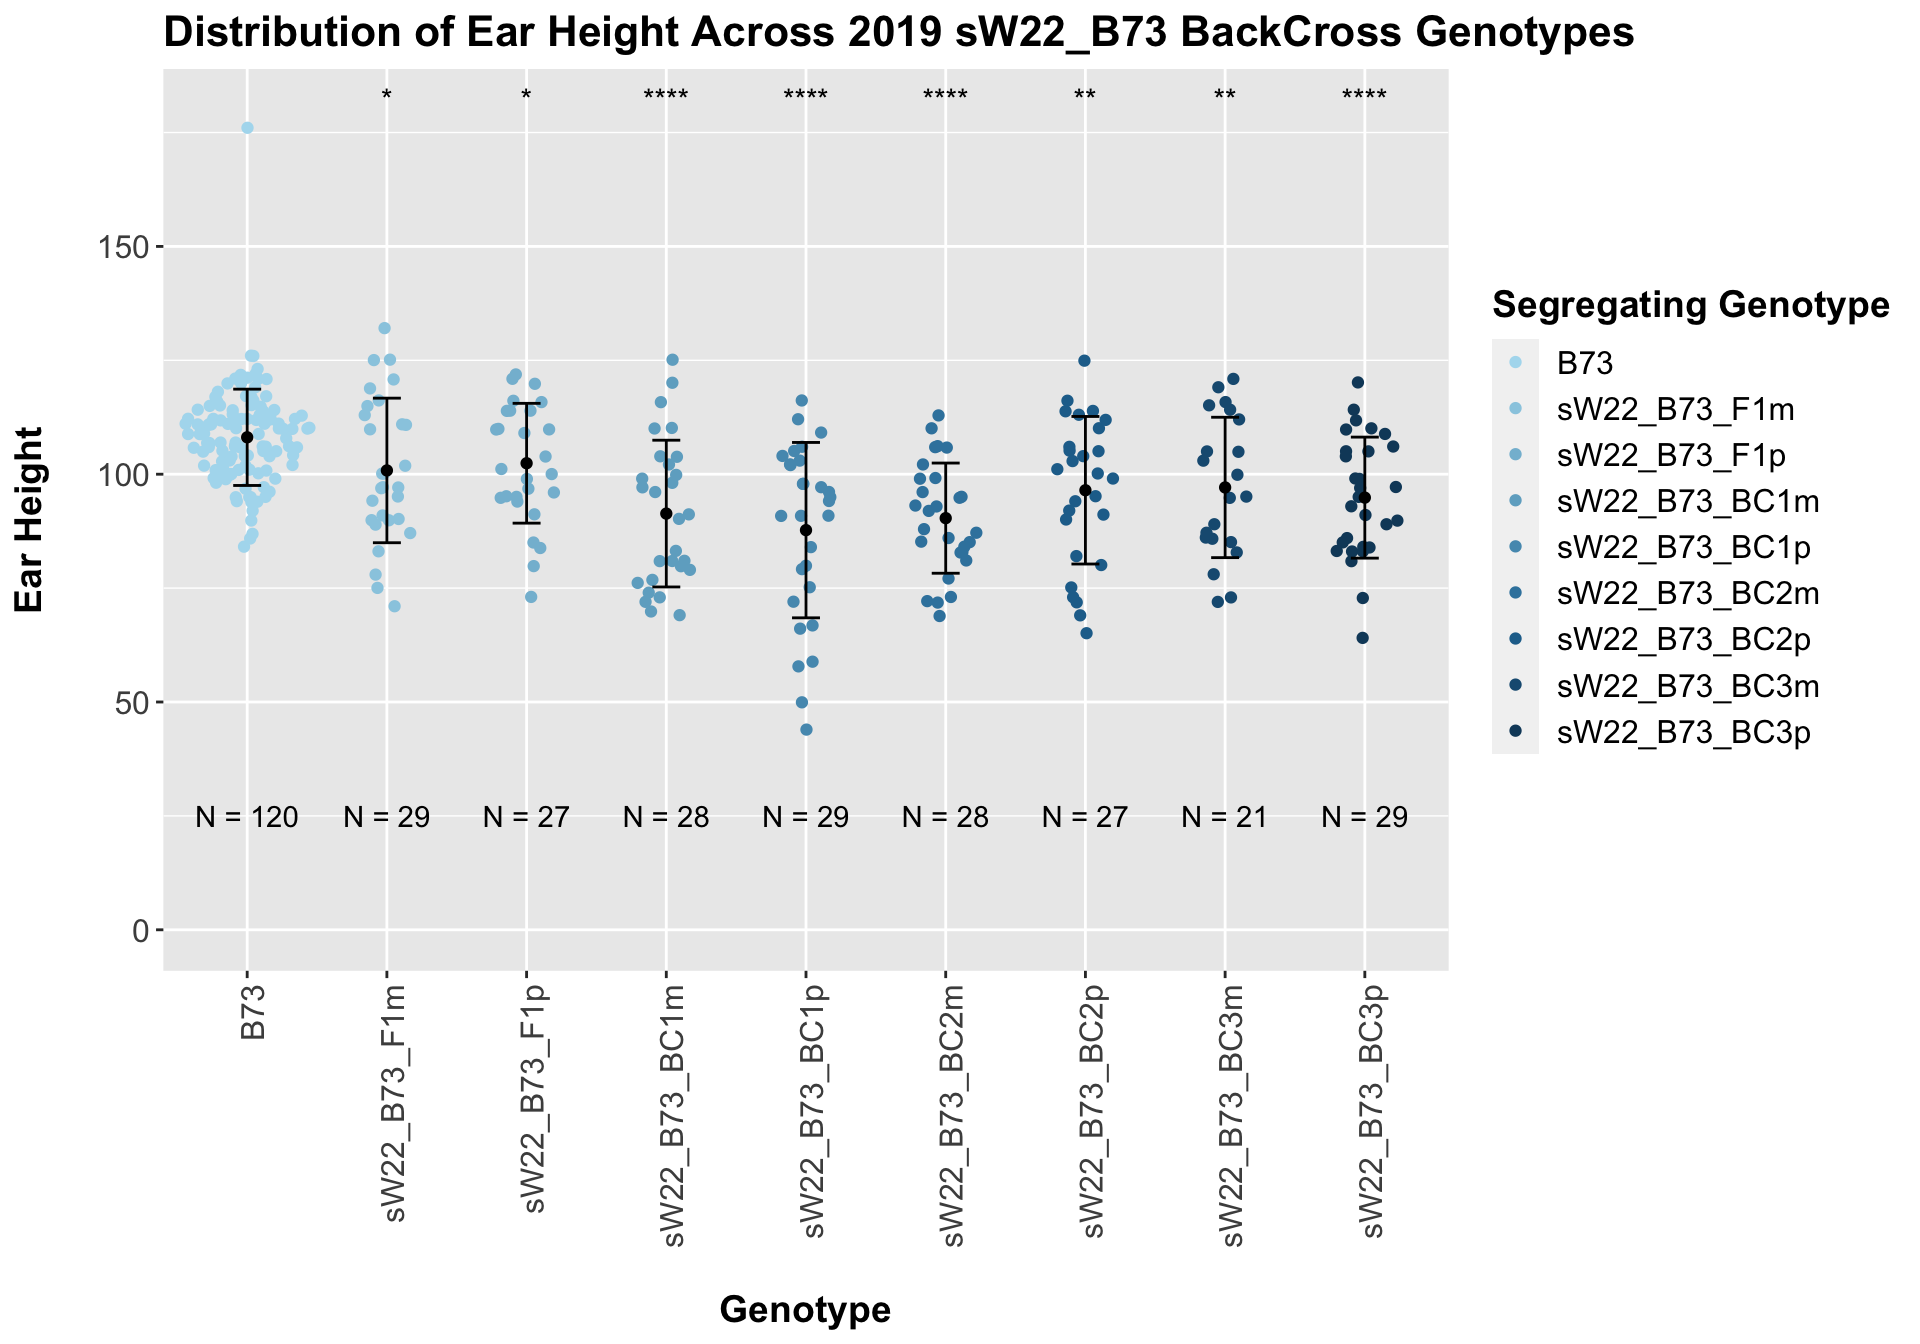
## # A tibble: 8 x 8
##   .y.         group1 group2                 p     p.adj p.format p.signif method
##   <chr>       <chr>  <chr>              <dbl>     <dbl> <chr>    <chr>    <chr>
## 1 Plant_Heig… B73    sW22_B73_F1m     2.49e-2   5.00e-2 0.0249   *        T-test
## 2 Plant_Heig… B73    sW22_B73_F1p     4.30e-2   5.00e-2 0.0430   *        T-test
## 3 Plant_Heig… B73    sW22_B73_BC…     9.28e-6   5.60e-5 9.3e-06  ****     T-test
## 4 Plant_Heig… B73    sW22_B73_BC…     4.50e-6   3.20e-5 4.5e-06  ****     T-test
## 5 Plant_Heig… B73    sW22_B73_BC…     1.72e-8   1.40e-7 1.7e-08  ****     T-test
## 6 Plant_Heig… B73    sW22_B73_BC…     1.21e-3   4.80e-3 0.0012   **       T-test
## 7 Plant_Heig… B73    sW22_B73_BC…     4.46e-3   1.30e-2 0.0045   **       T-test
## 8 Plant_Heig… B73    sW22_B73_BC…     1.42e-5   7.10e-5 1.4e-05  ****     T-test
Unlike with plant height, where we normally see an increase in plant height followed by a decline across subsequent backcrosses, we see a steady decline in ear height across backcross generations. We can check to see whether this trend is driven by data from one field or if it holds true when we stratify the data.
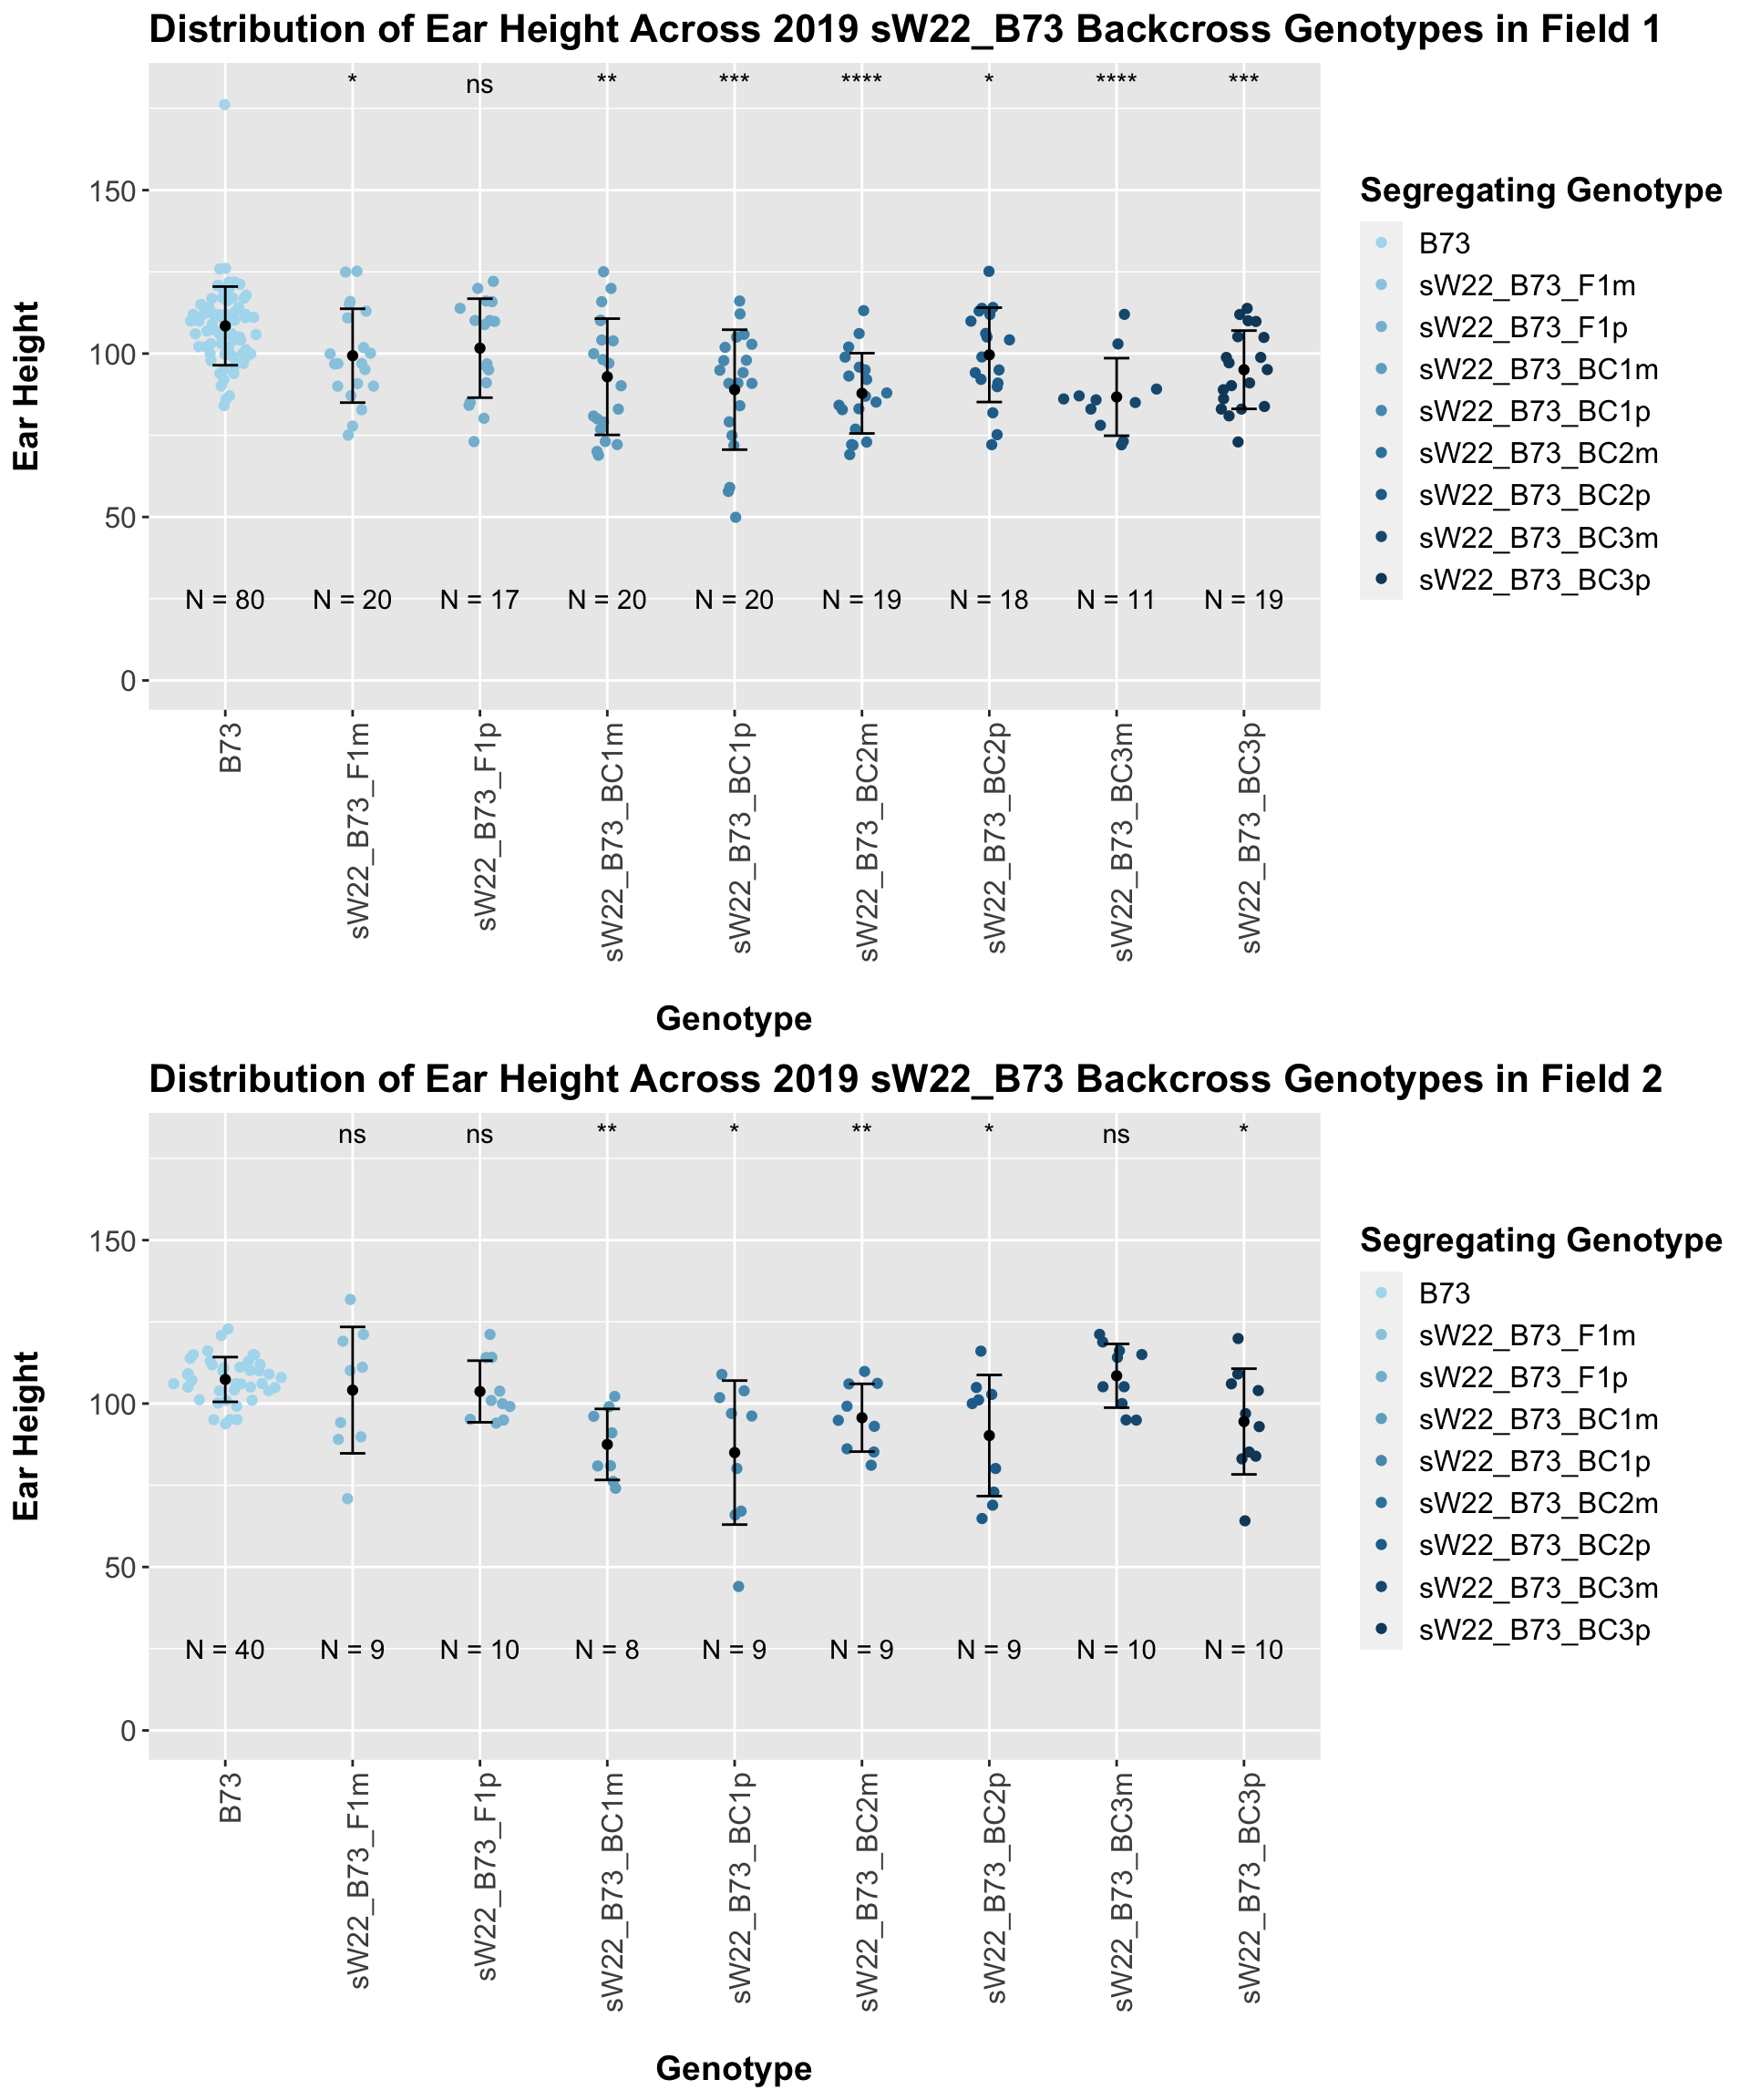
If we separate by field, the trend is very similar. It seems ear height modestly declines across backcross generations. This seems to be counter to what we would expect.
We can compare this data to our W22 backcrossed to B73 lineage.
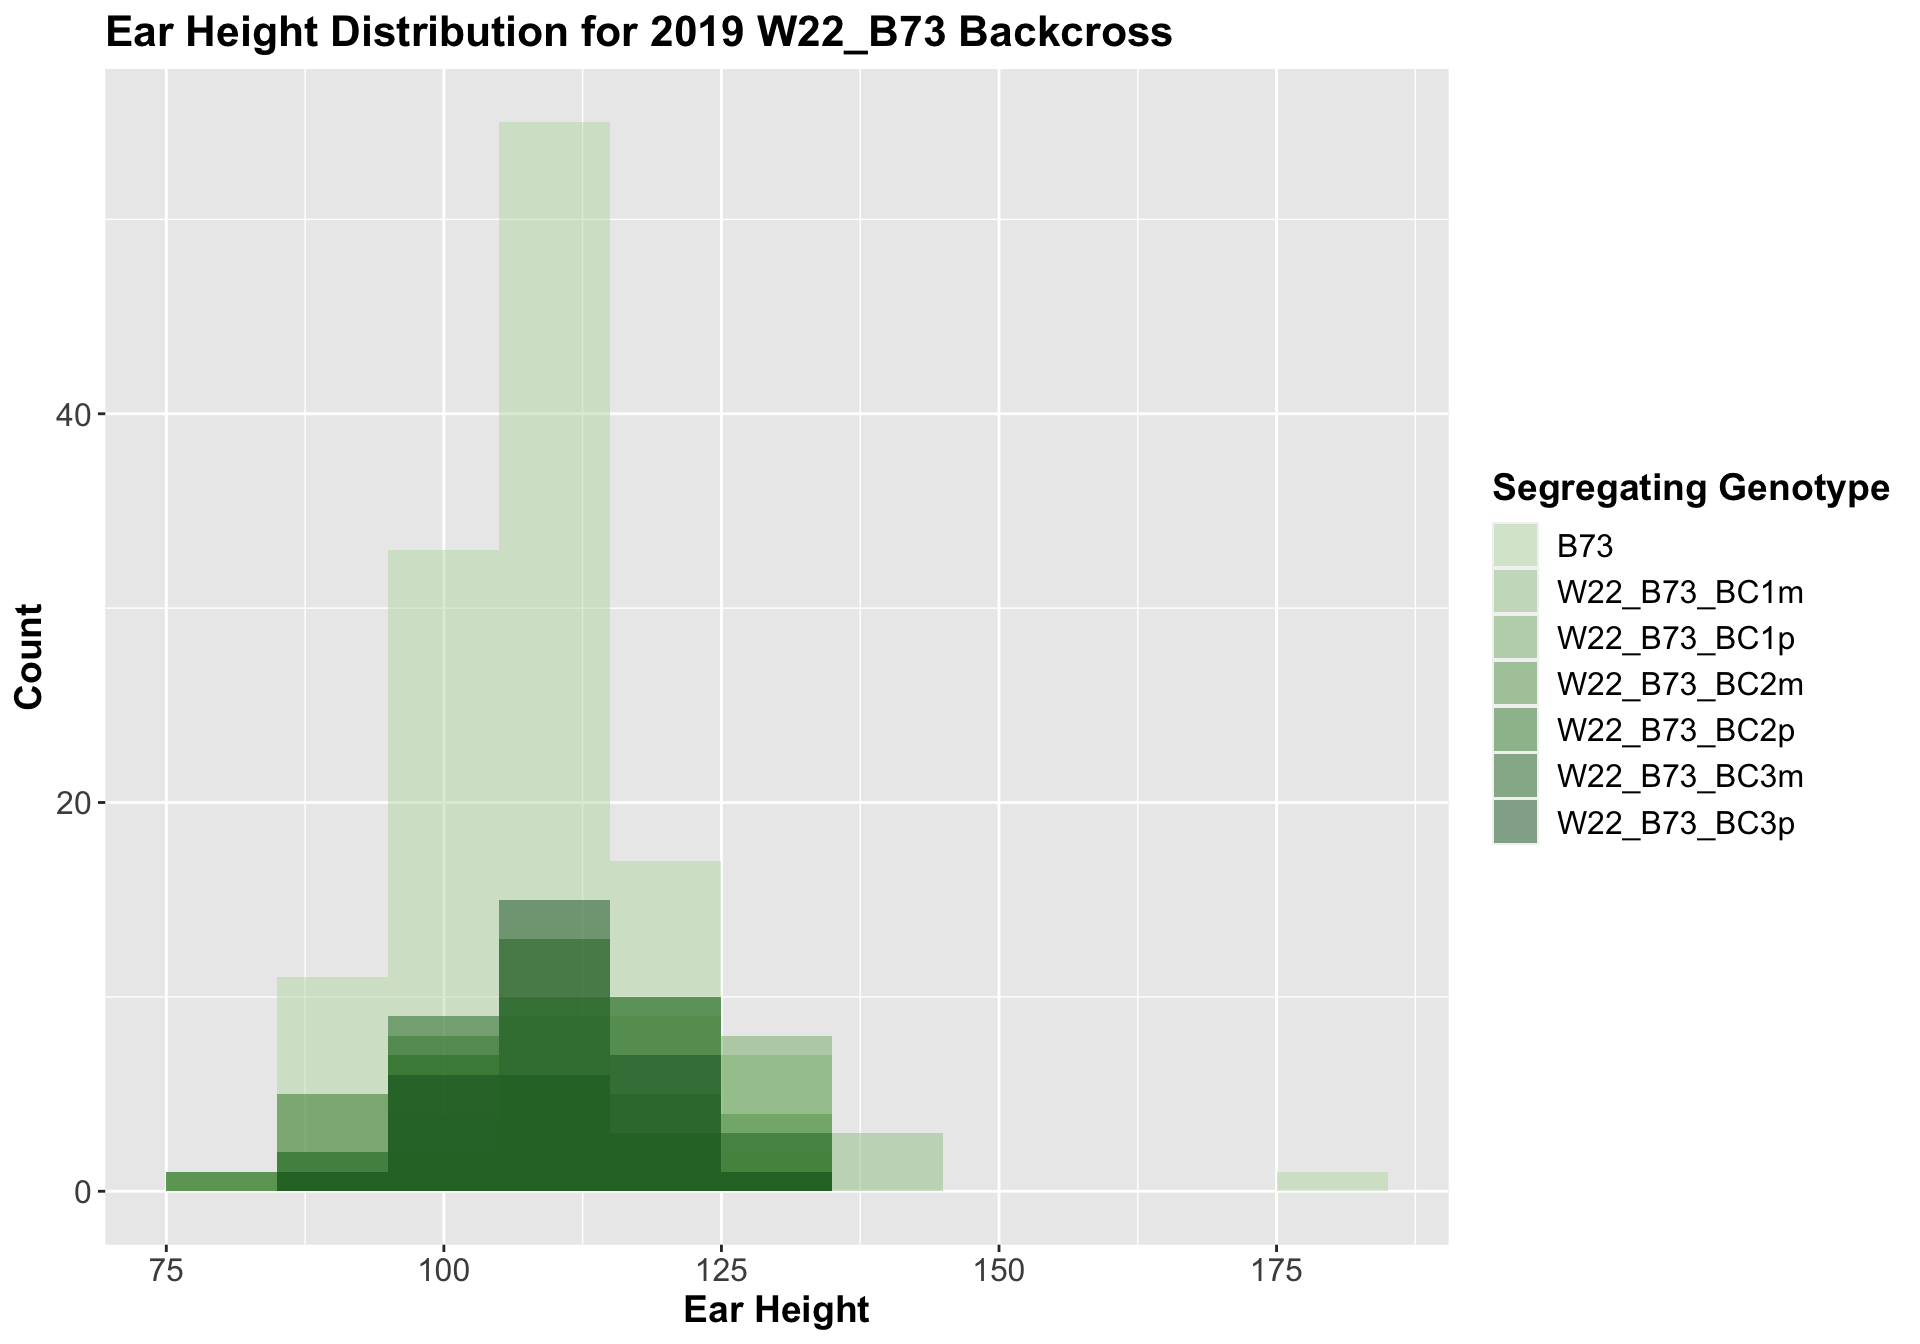
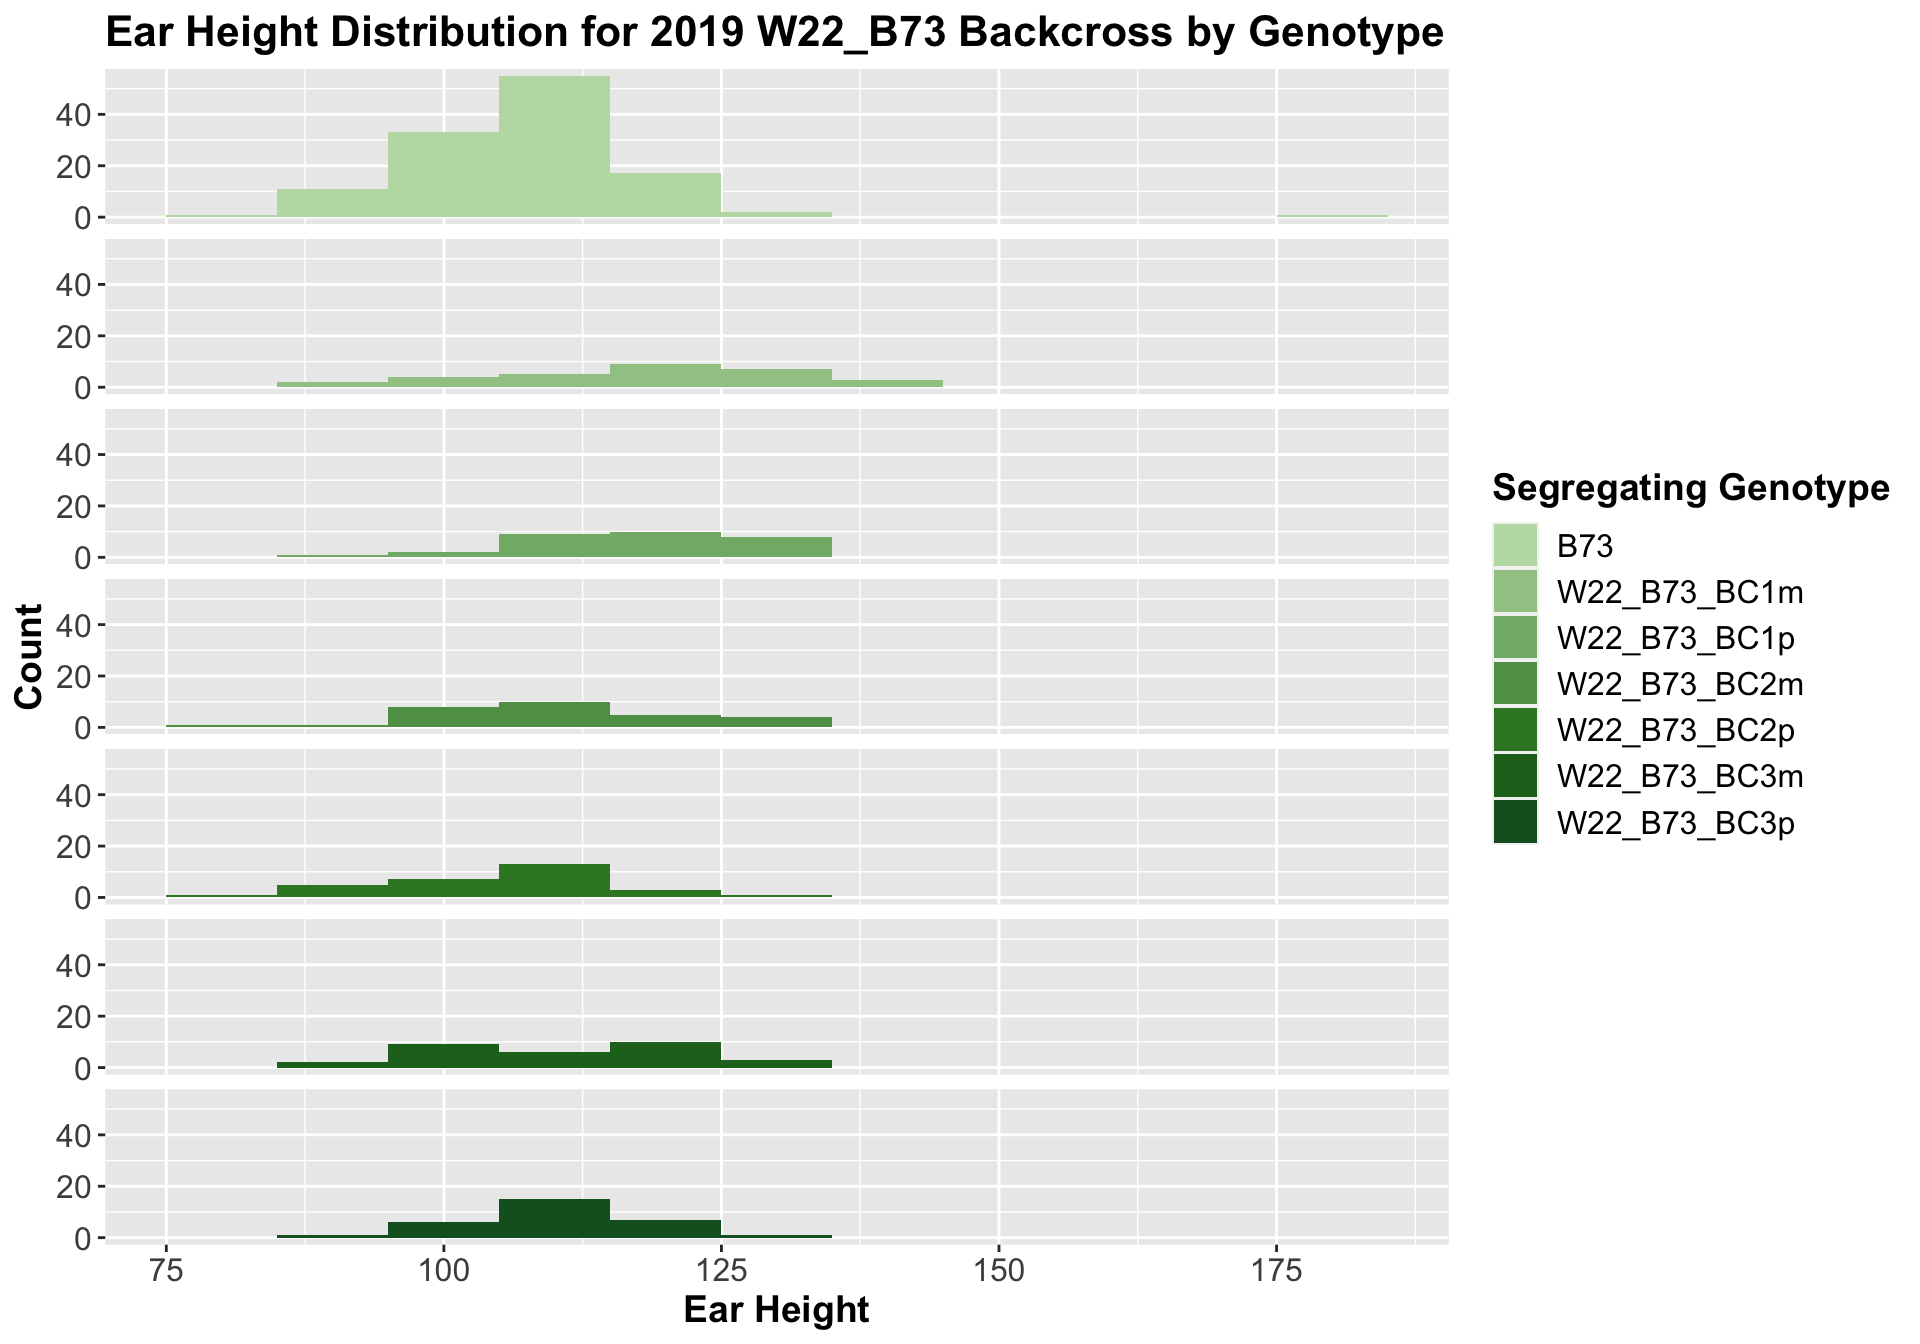
##
##  Mean, SD, and SE for each genotype
## Seg_Genotype N mean sd se
## 1 B73 120 108.1000 10.571406 0.9650329
## 2 W22_B73_BC1m 30 118.1667 13.844166 2.5275873
## 3 W22_B73_BC1p 30 117.7333 10.167336 1.8562930
## 4 W22_B73_BC2m 29 110.7586 12.724148 2.3628150
## 5 W22_B73_BC2p 30 106.1333 10.588651 1.9332144
## 6 W22_B73_BC3m 30 111.4667 11.667028 2.1300981
## 7 W22_B73_BC3p 30 110.6667 7.317119 1.3359170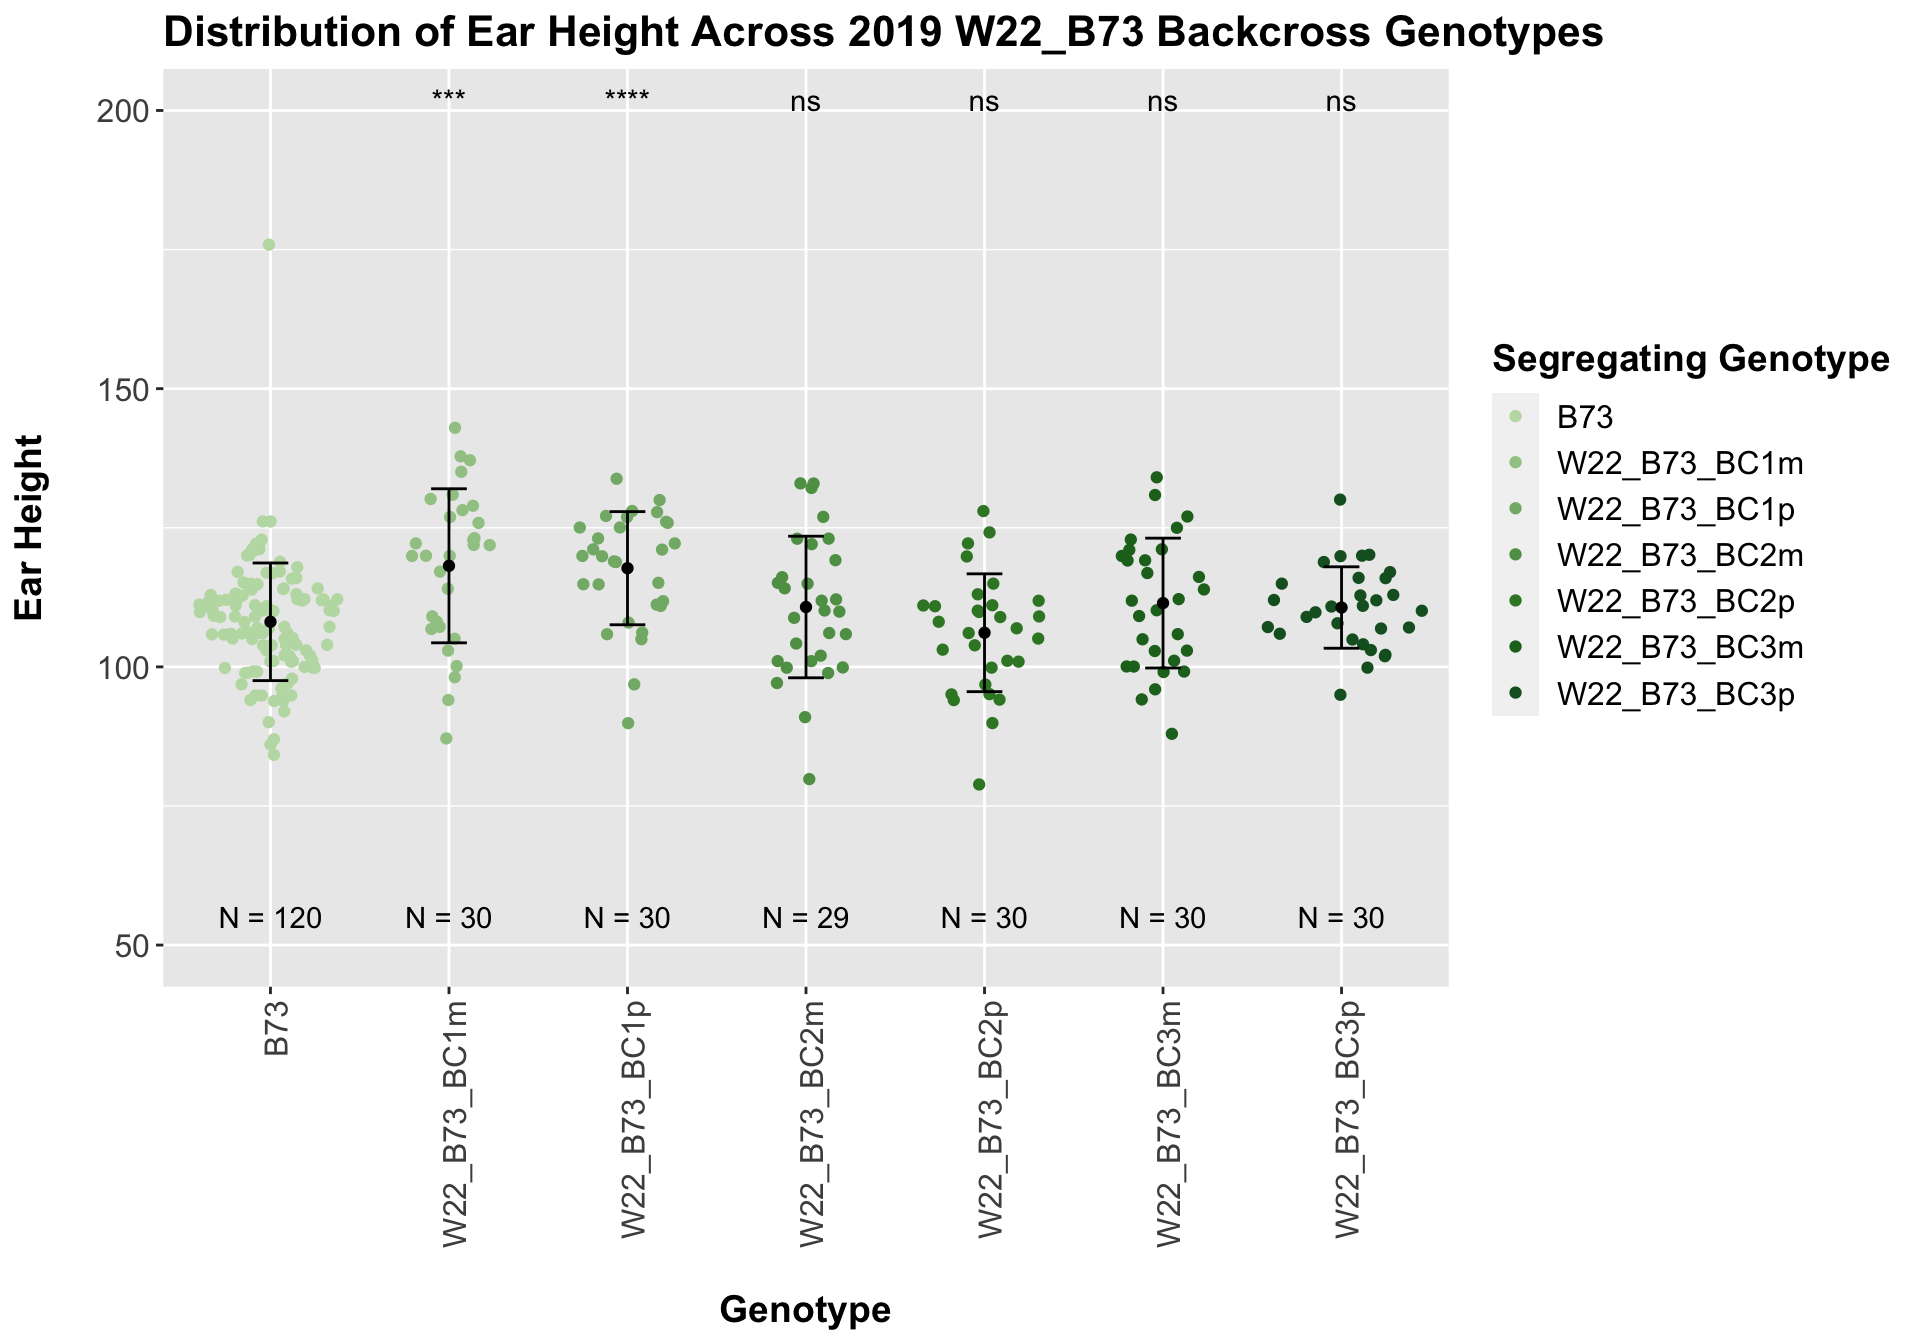
## # A tibble: 6 x 8
##   .y.          group1 group2               p  p.adj p.format p.signif method
##   <chr>        <chr>  <chr>            <dbl>  <dbl> <chr>    <chr>    <chr>
## 1 Plant_Height B73    W22_B73_BC1m 0.000642  0.0032 0.00064  ***      T-test
## 2 Plant_Height B73    W22_B73_BC1p 0.0000327 0.0002 3.3e-05  ****     T-test
## 3 Plant_Height B73    W22_B73_BC2m 0.304     0.61   0.30417  ns       T-test
## 4 Plant_Height B73    W22_B73_BC2p 0.368     0.61   0.36761  ns       T-test
## 5 Plant_Height B73    W22_B73_BC3m 0.157     0.5    0.15743  ns       T-test
## 6 Plant_Height B73    W22_B73_BC3p 0.124     0.5    0.12438  ns       T-test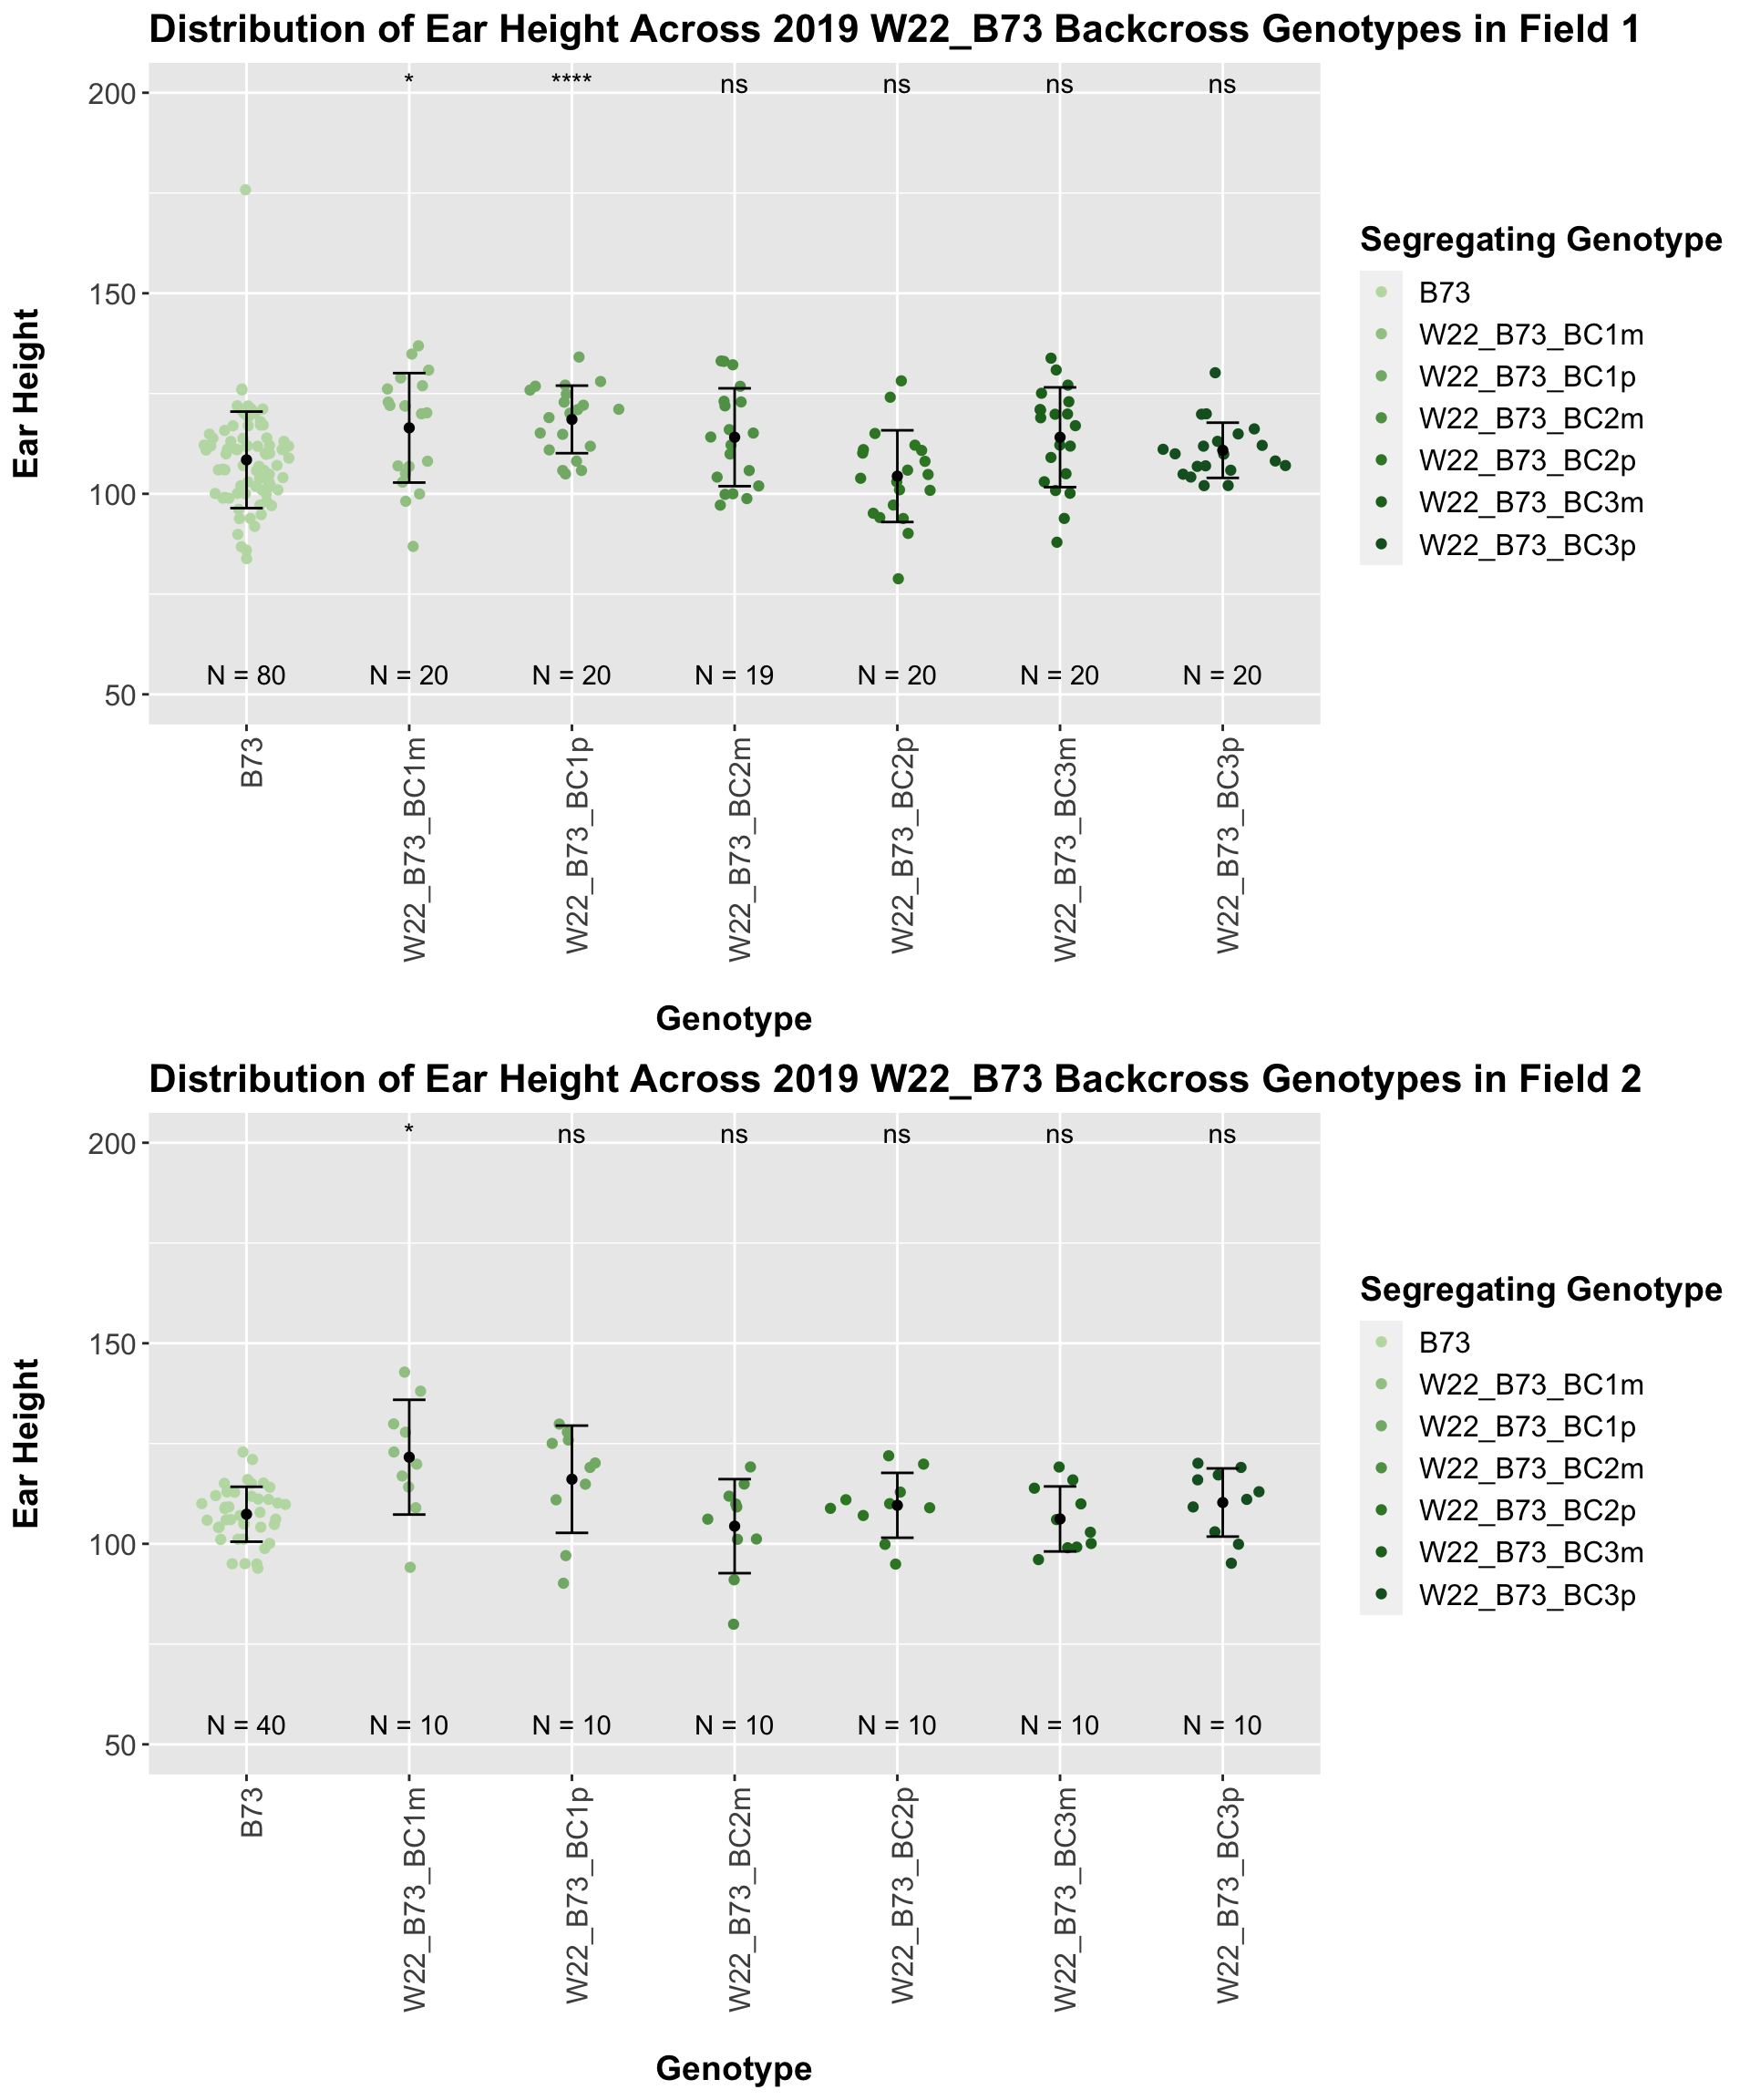
Interestingly, we see the expected pattern occur for our w22 backcrosses. There is an initial increase in ear height among F1s and early backcrosses that eventually returns to the ear height of the B73 line.
We may also compare the distribution for sW22_B73 backcrosses to W22_B73 backcrosses and each generation compares across these two sets. Note: when looking at these plots, just be aware that the genotypes don't align perfectly across backcrosses because we don't have a few crosses for the W22_B73 genotypes.
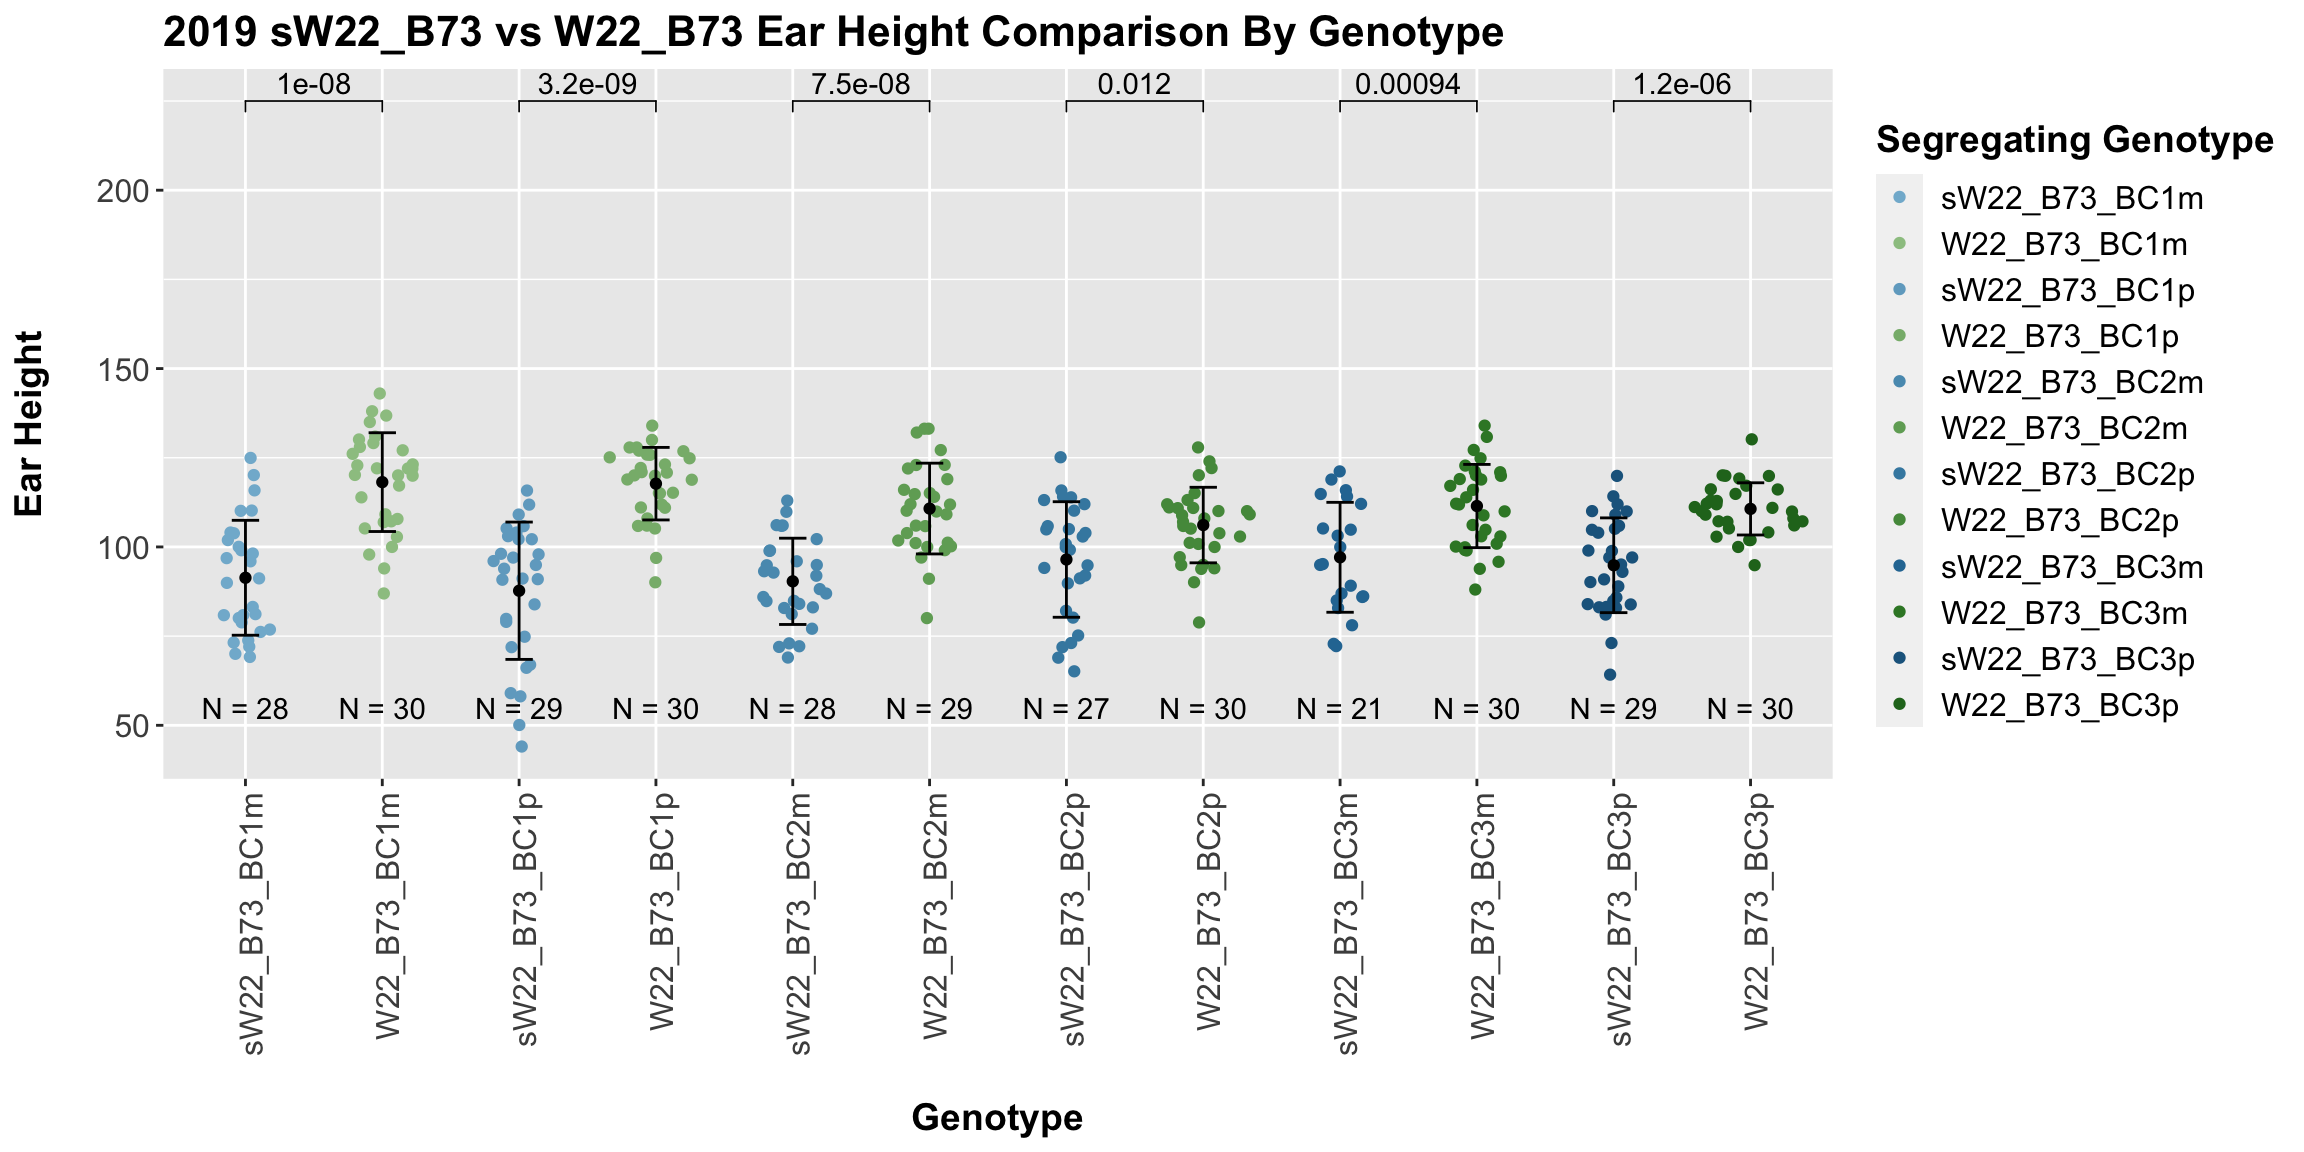
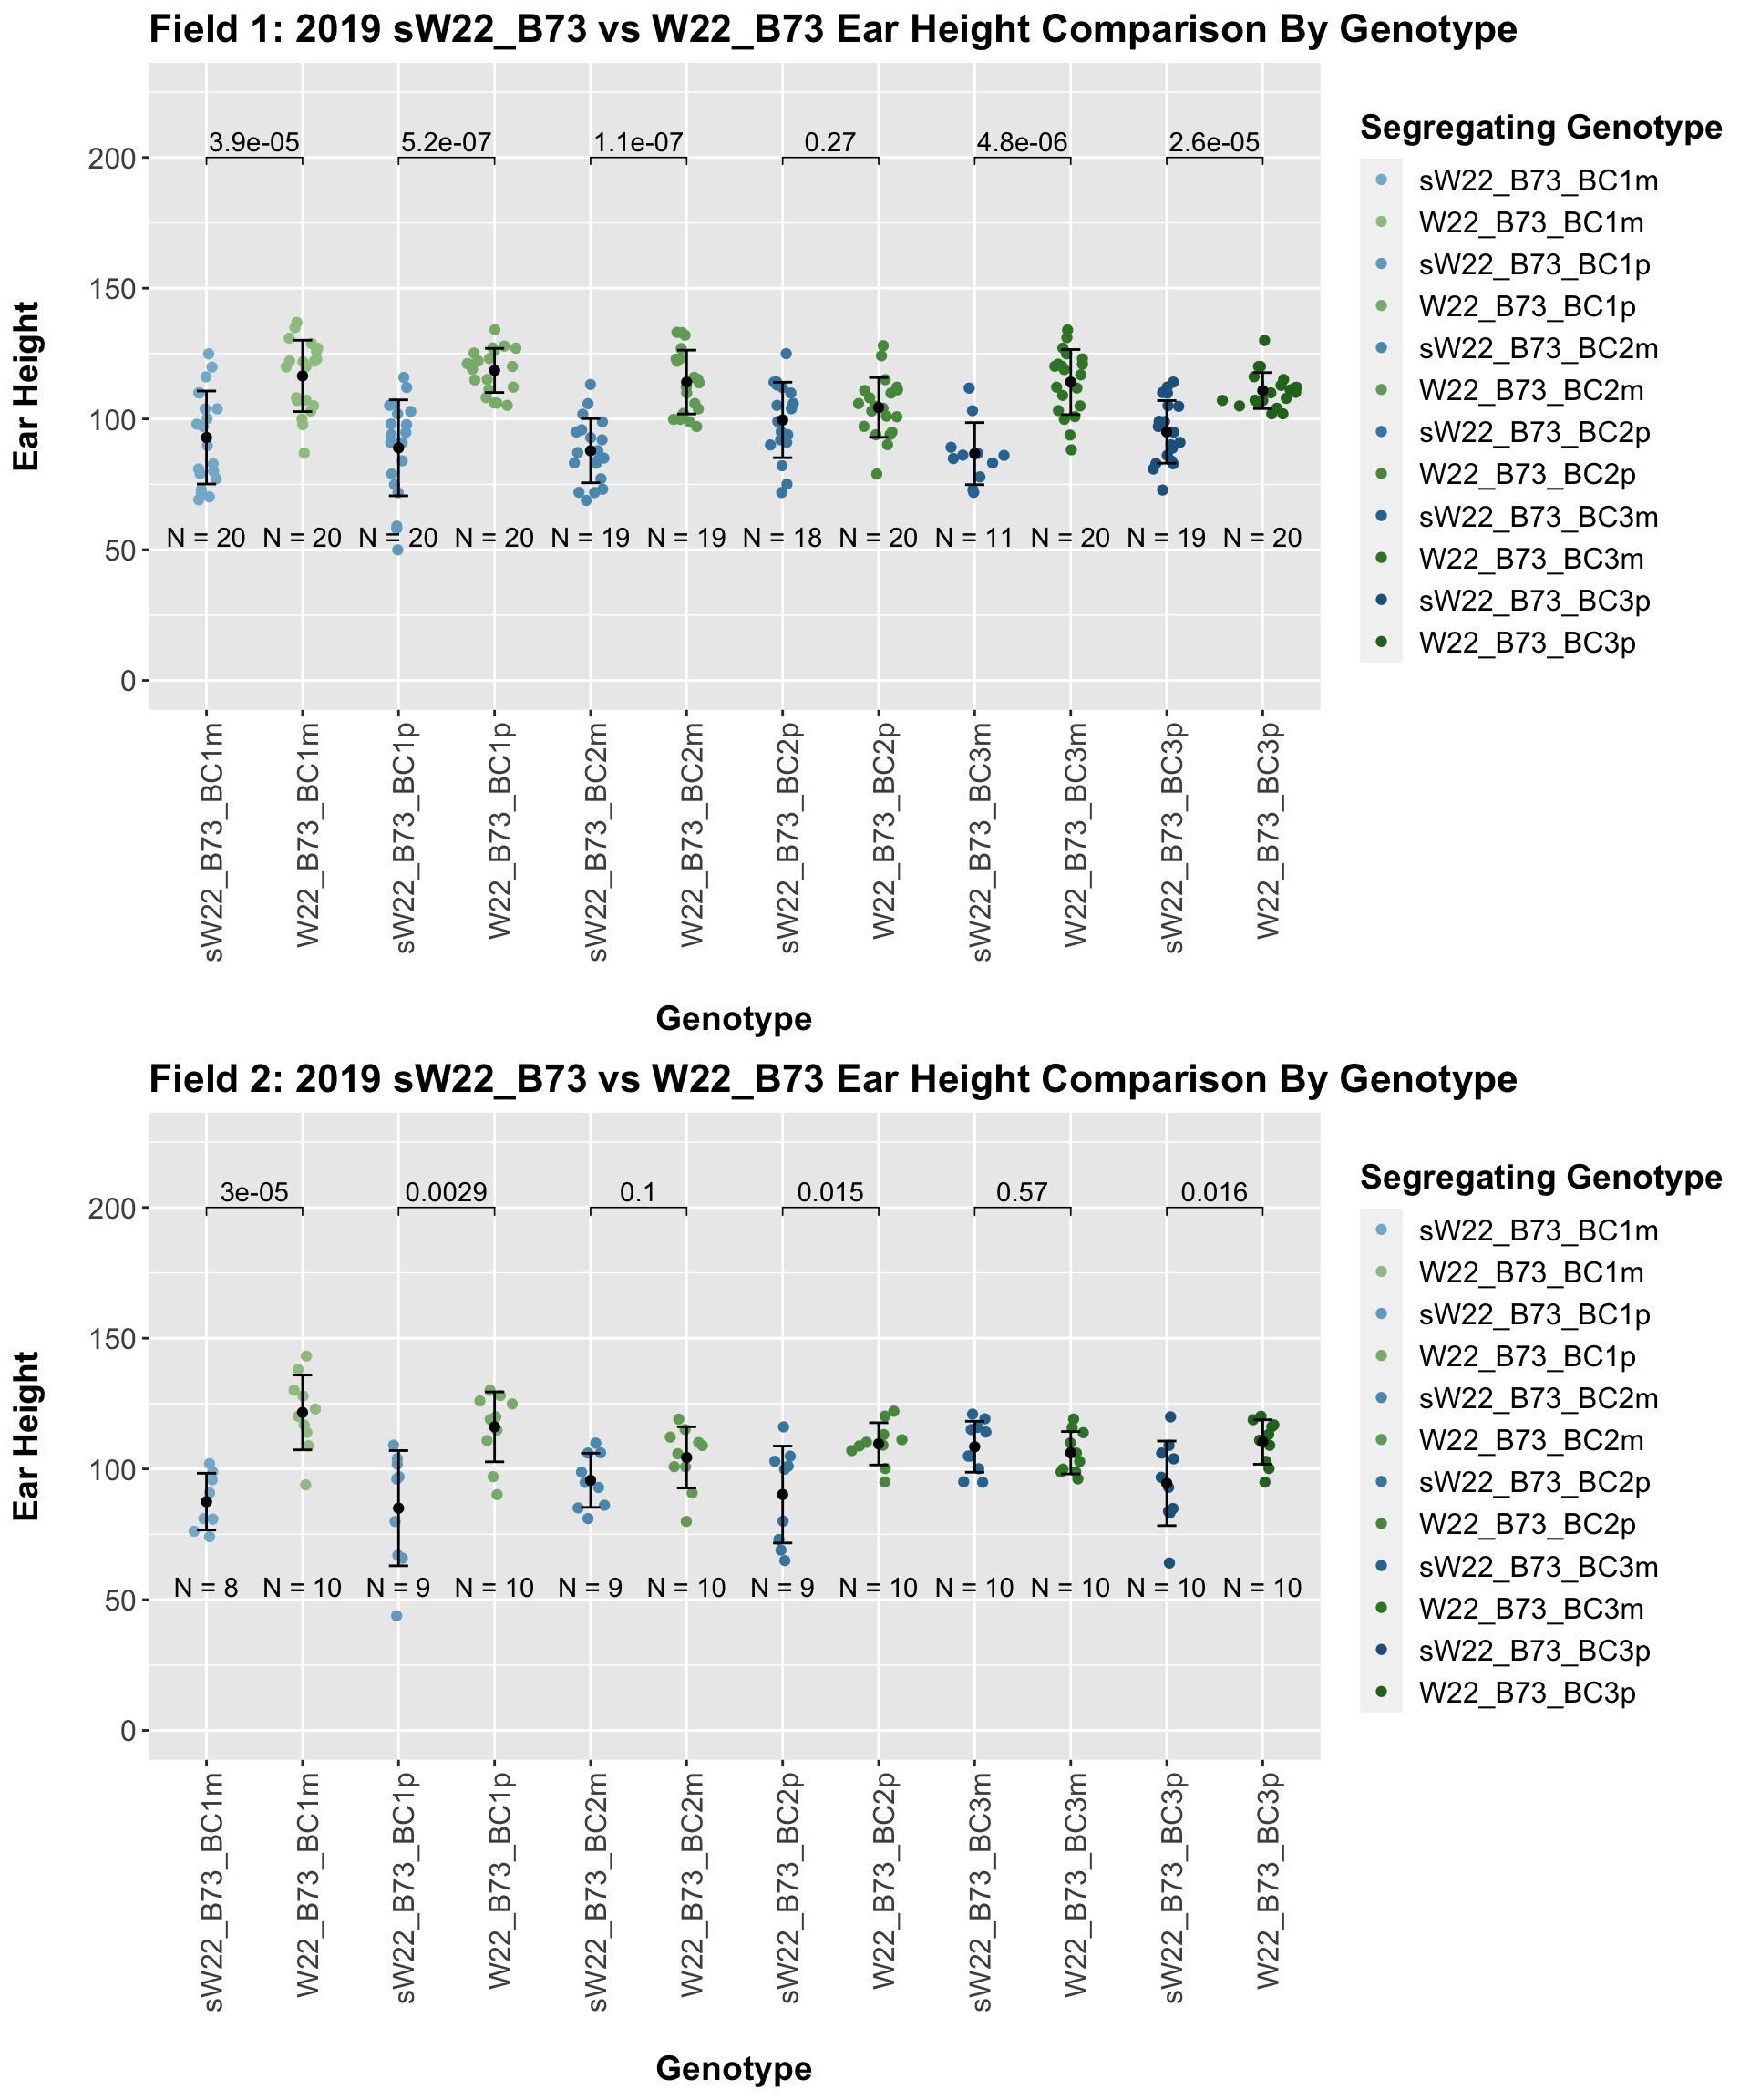
When we specifically compare the height between sW22 and W22 backcrosses at each generation, we see a significant reduction in ear height of the sW22 backcross against the W22 backcross. This holds even if we stratify the data by field. So, while the trend for our sW22_B73 backcrosses is not quite what we would expect, we still find that that the sW22_B73 lineage is shorter than the W22_B73 lineage at each generation.
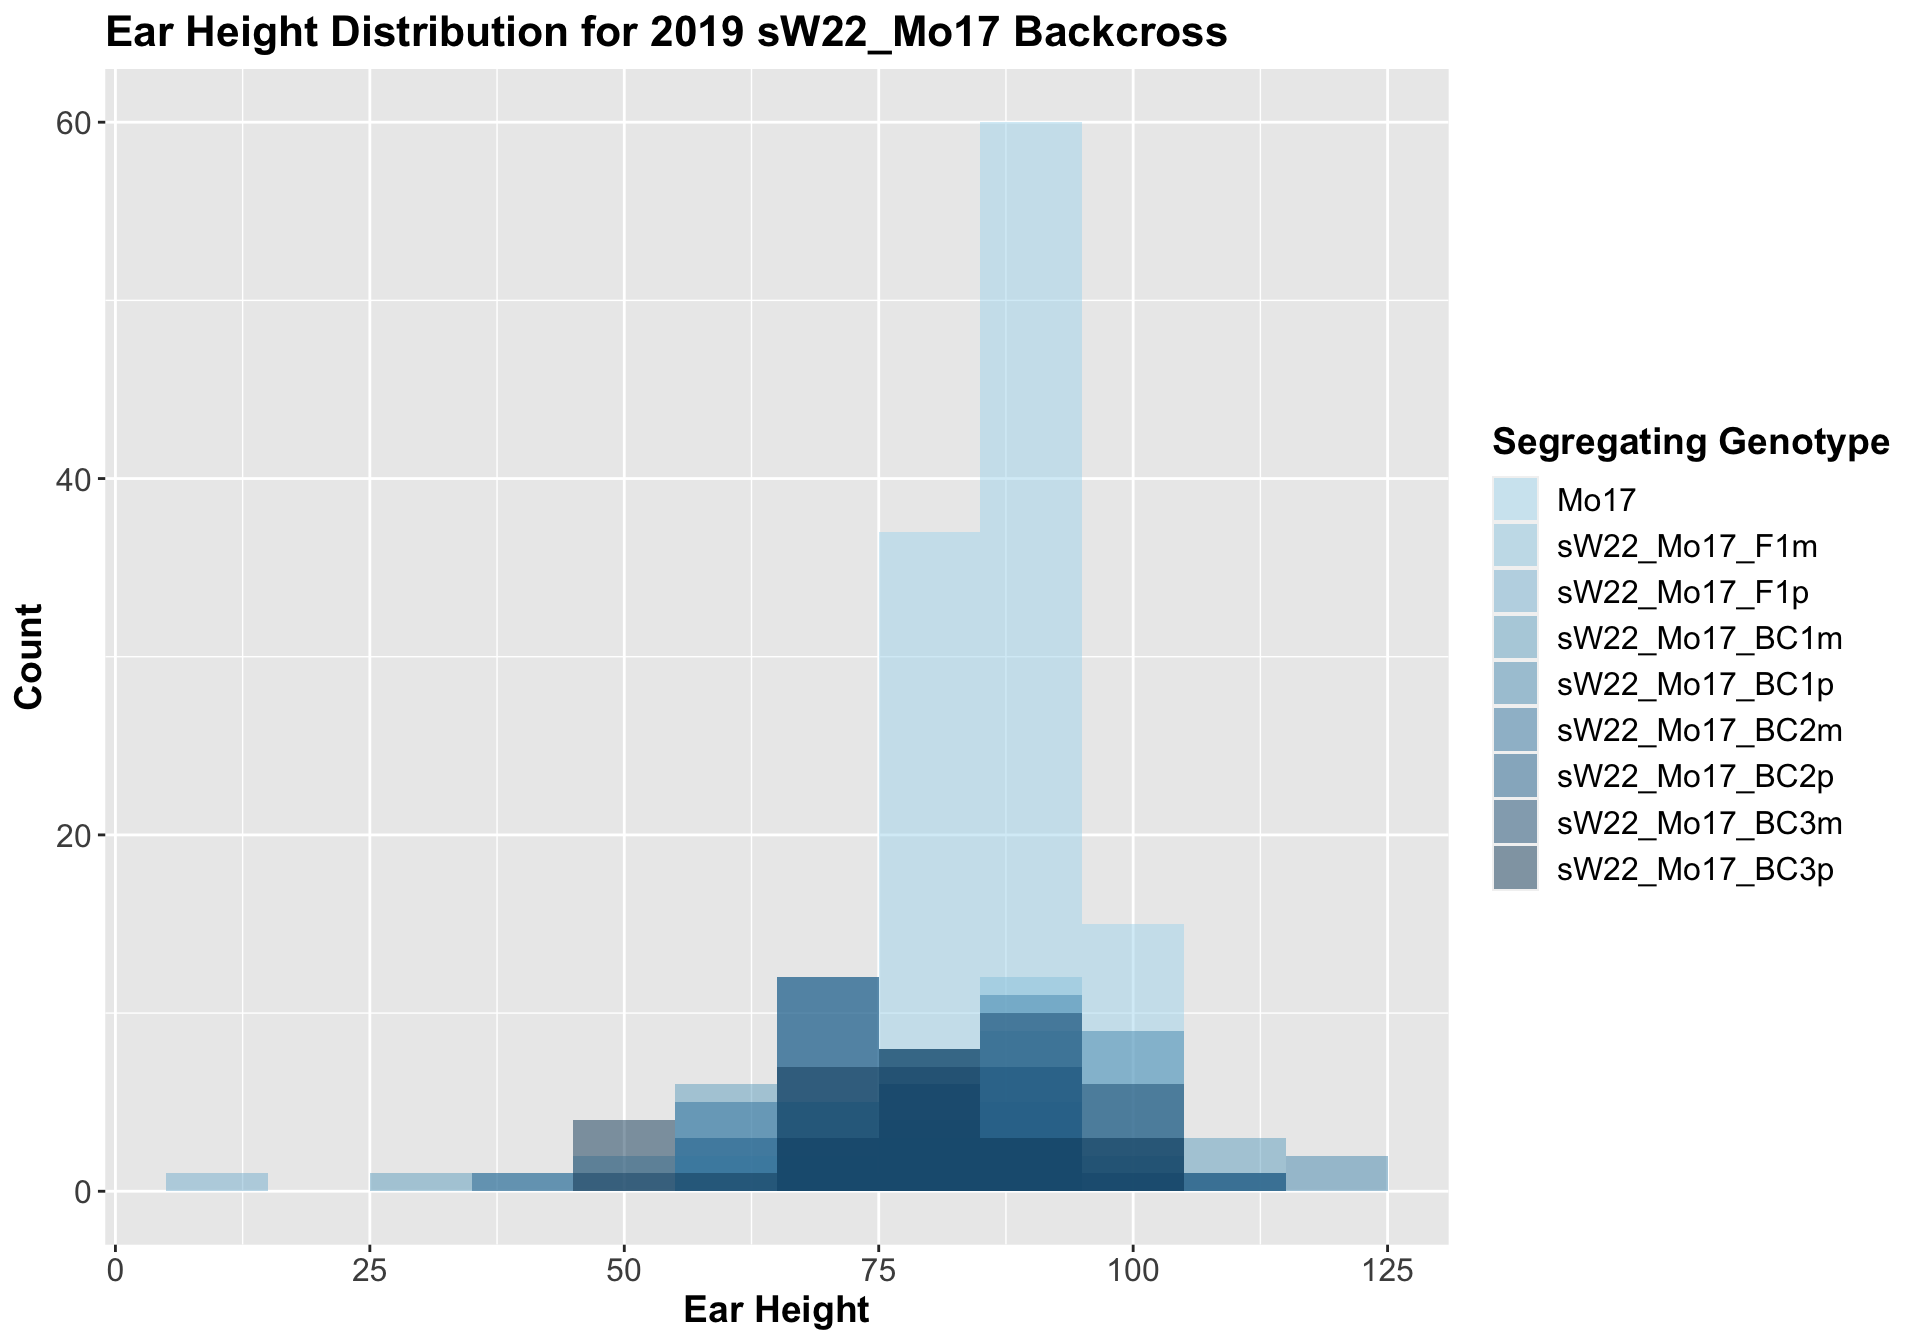
4.1.3 2019 sW22 and W22 backcrossed to Mo17
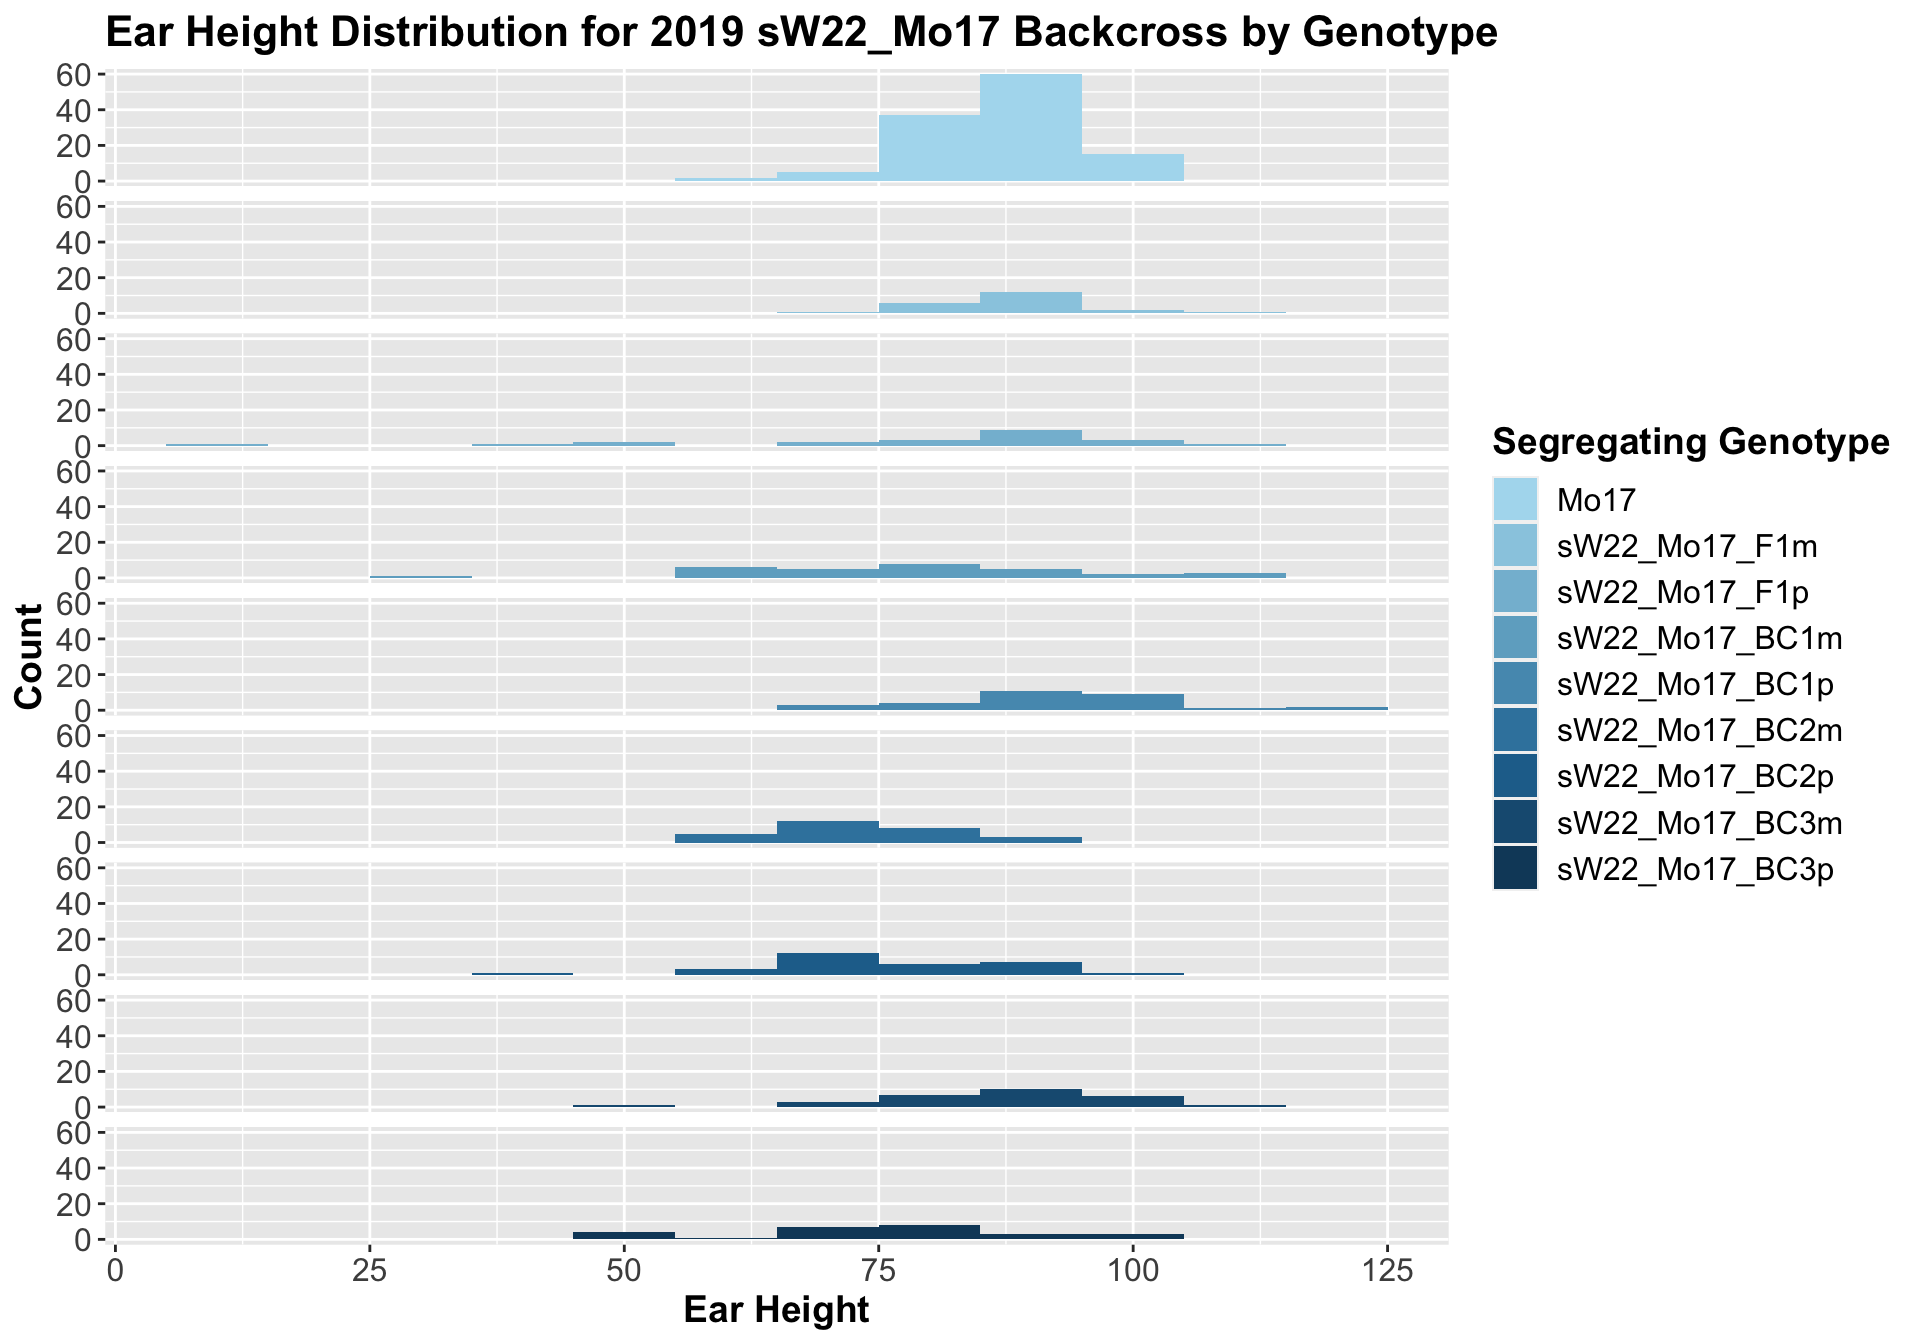
##
##  Mean, SD, and SE for each genotype
## Seg_Genotype N mean sd se
## 1 Mo17 119 87.67227 7.880580 0.7224116
## 2 sW22_Mo17_F1m 22 87.90909 7.552414 1.6101801
## 3 sW22_Mo17_F1p 22 81.54545 23.790209 5.0720895
## 4 sW22_Mo17_BC1m 30 79.36667 17.531220 3.2007482
## 5 sW22_Mo17_BC1p 30 92.86667 11.720107 2.1397891
## 6 sW22_Mo17_BC2m 28 74.14286 9.090957 1.7180294
## 7 sW22_Mo17_BC2p 30 76.26667 11.703030 2.1366712
## 8 sW22_Mo17_BC3m 28 86.53571 12.521040 2.3662542
## 9 sW22_Mo17_BC3p 26 76.46154 14.604741 2.8642254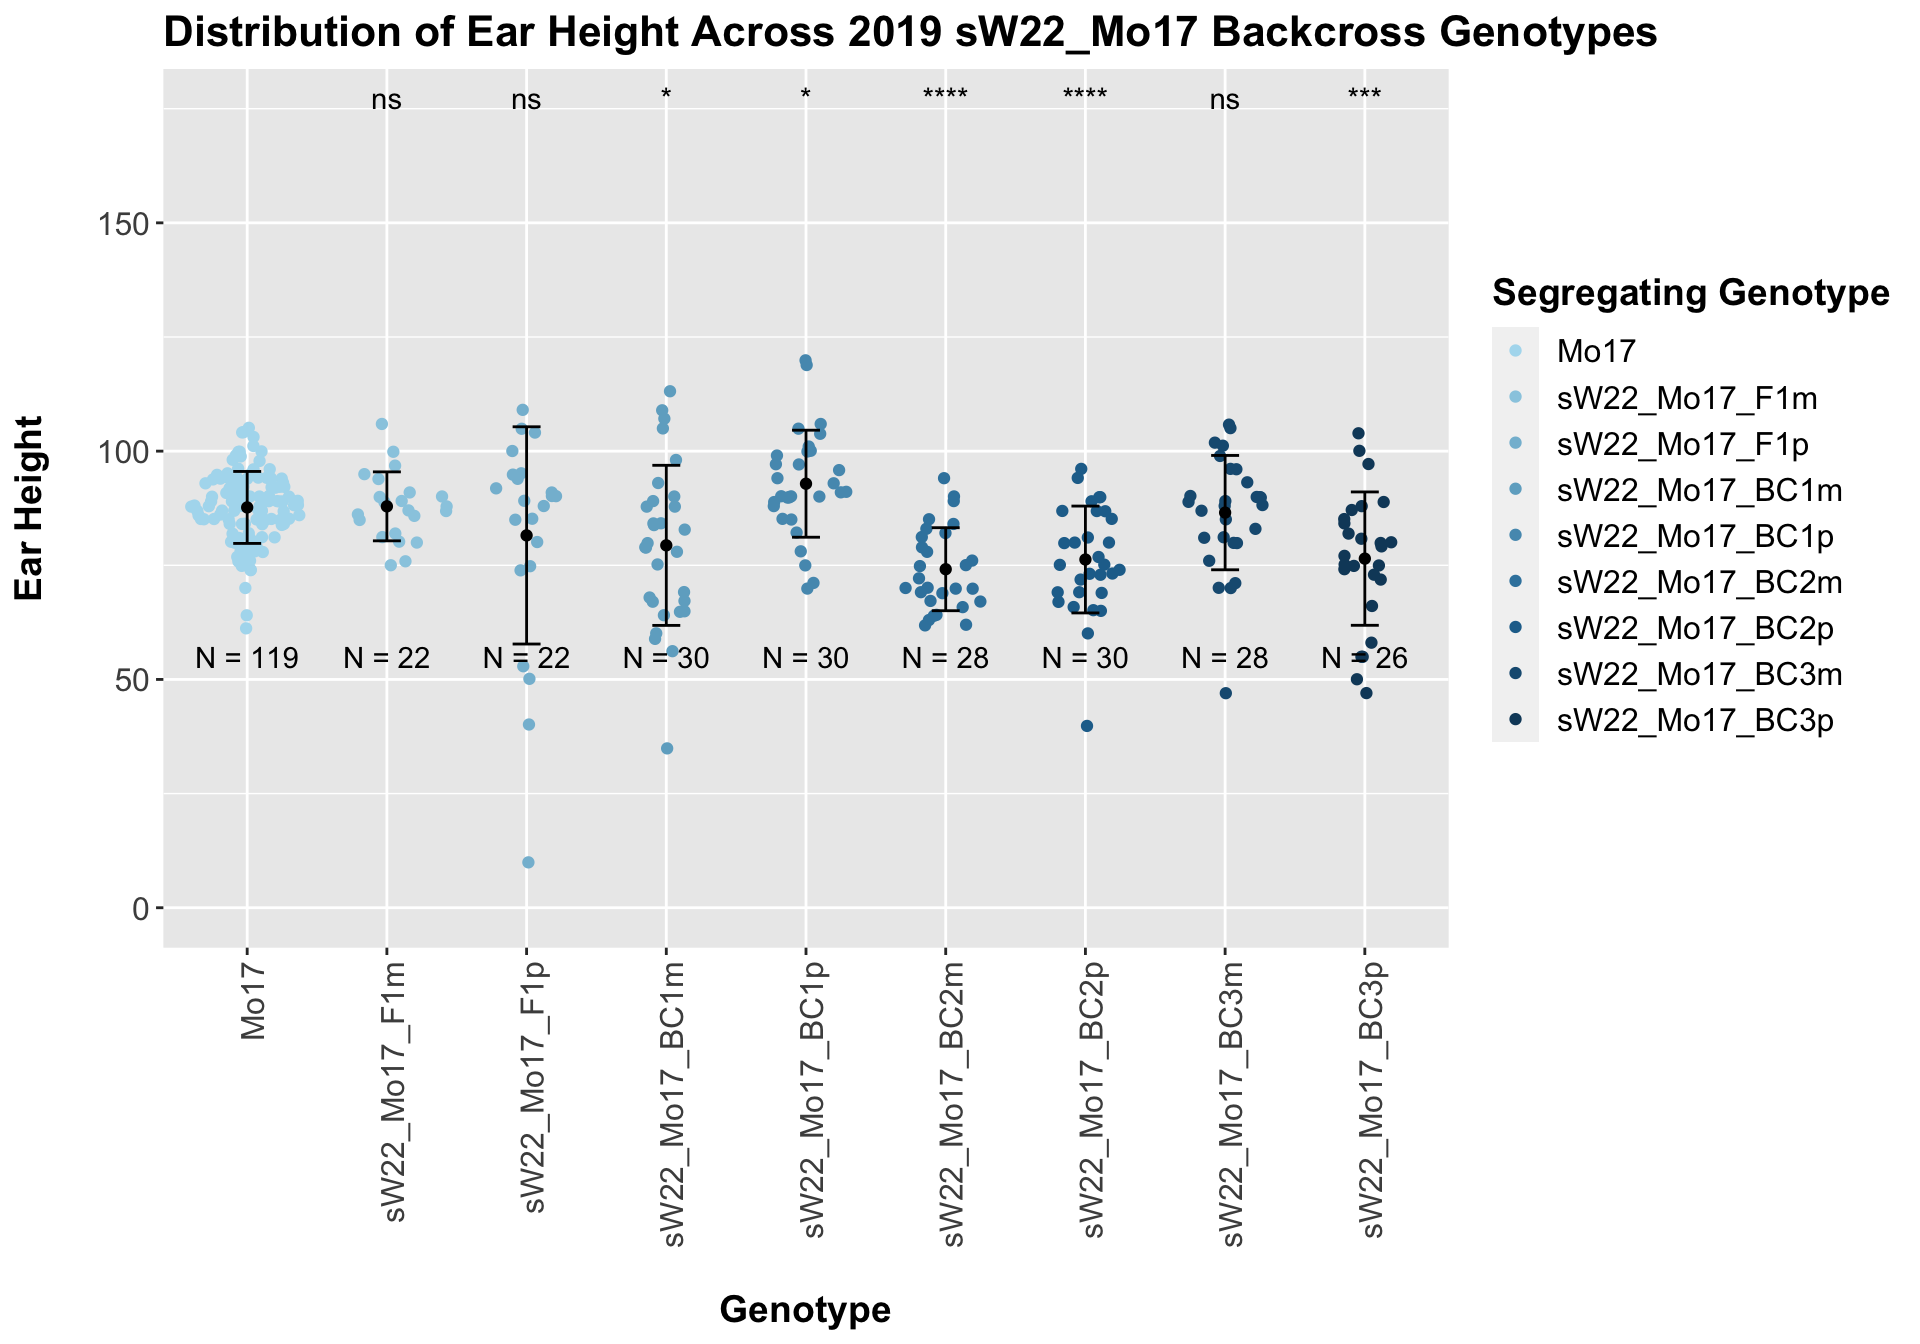
## # A tibble: 8 x 8
## .y. group1 group2 p p.adj p.format p.signif method
## <chr> <chr> <chr> <dbl> <dbl> <chr> <chr> <chr>
## 1 Plant_Heig… Mo17 sW22_Mo17_F1m 8.94e-1 1.00e+0 0.89415 ns T-test
## 2 Plant_Heig… Mo17 sW22_Mo17_F1p 2.45e-1 7.30e-1 0.24456 ns T-test
## 3 Plant_Heig… Mo17 sW22_Mo17_BC… 1.65e-2 8.20e-2 0.01648 * T-test
## 4 Plant_Heig… Mo17 sW22_Mo17_BC… 2.74e-2 1.10e-1 0.02738 * T-test
## 5 Plant_Heig… Mo17 sW22_Mo17_BC… 1.26e-8 1.00e-7 1.3e-08 **** T-test
## 6 Plant_Heig… Mo17 sW22_Mo17_BC… 1.27e-5 8.90e-5 1.3e-05 **** T-test
## 7 Plant_Heig… Mo17 sW22_Mo17_BC… 6.49e-1 1.00e+0 0.64904 ns T-test
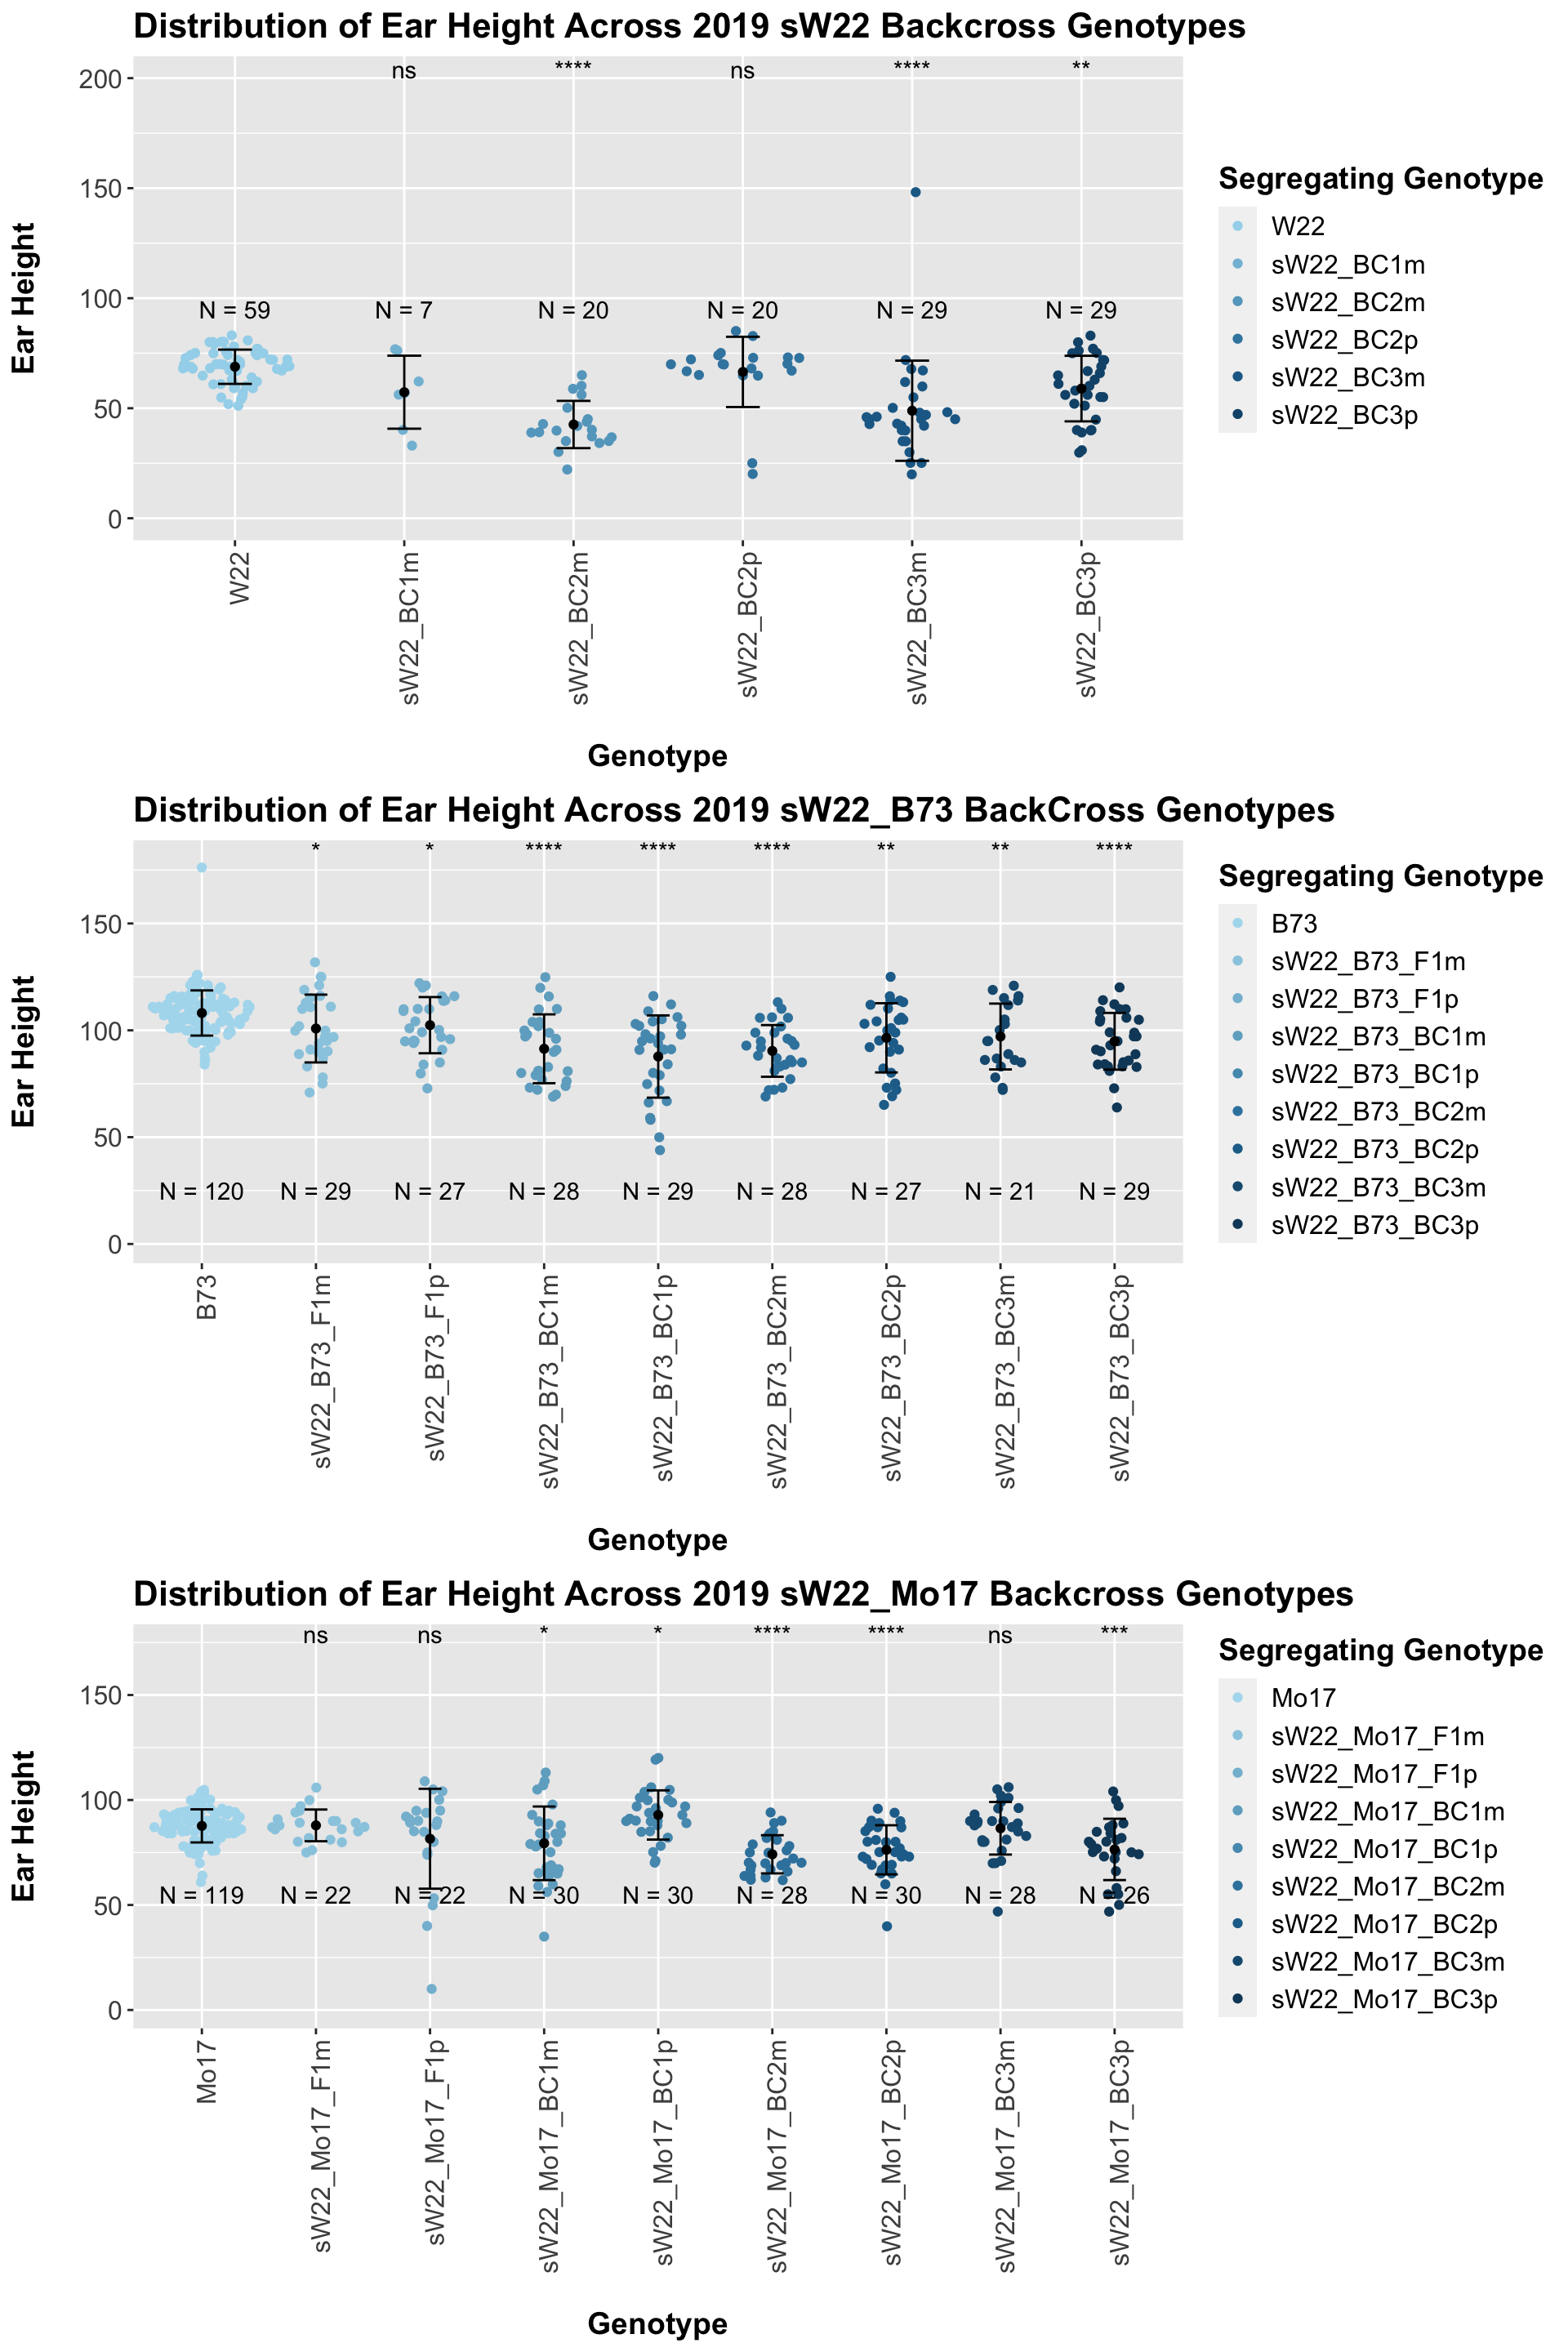
## 8 Plant_Heig… Mo17 sW22_Mo17_BC… 7.18e-4 4.30e-3 0.00072 *** T-testWe find that ear height is similar among the F1 and early backcrosses before seeming to decline across more backcrosses. This is similar to what we saw for the sW22_B73 backcrosses this season. We can check whether this holds if we separate the data by field.
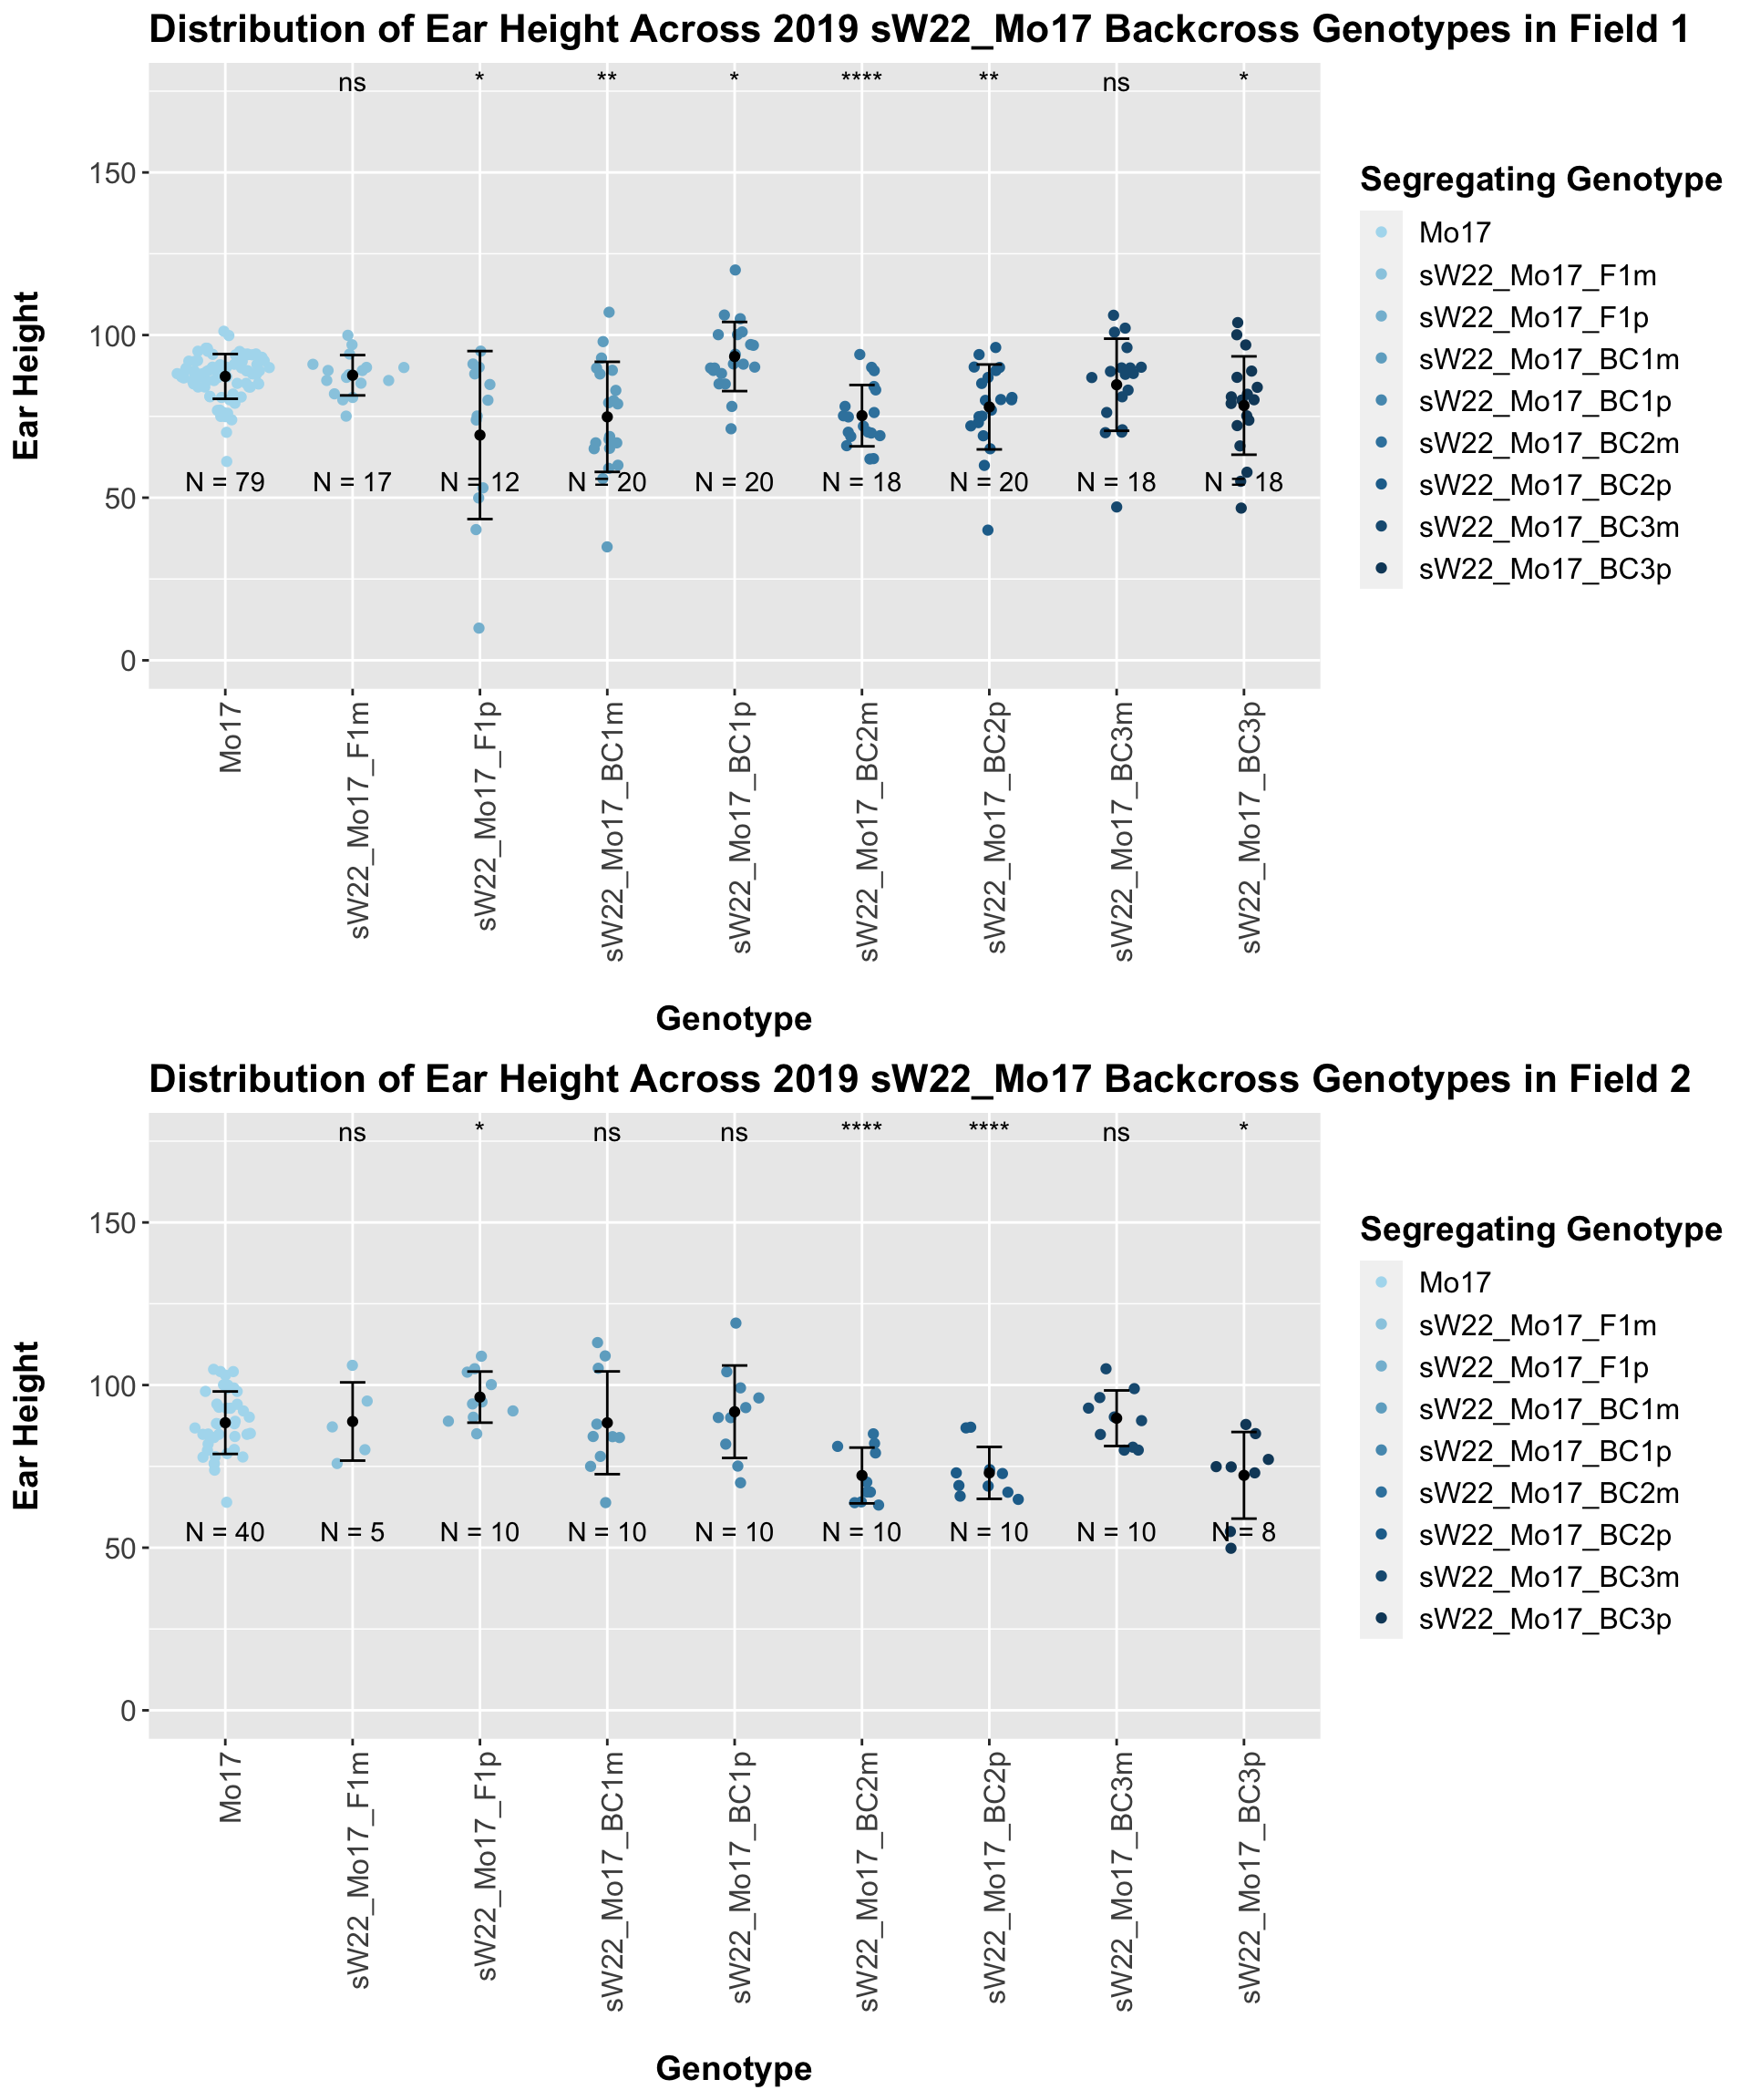
The field data is very similar to the data in aggregate. Our ear height data for the sW22_Mo17 backcross is very similar to what we see for our sW22_B73 backcrosses. We can also assess the ear height of our W22_Mo17 backcrosses and see how they compare to the sW22_Mo17 crosses.
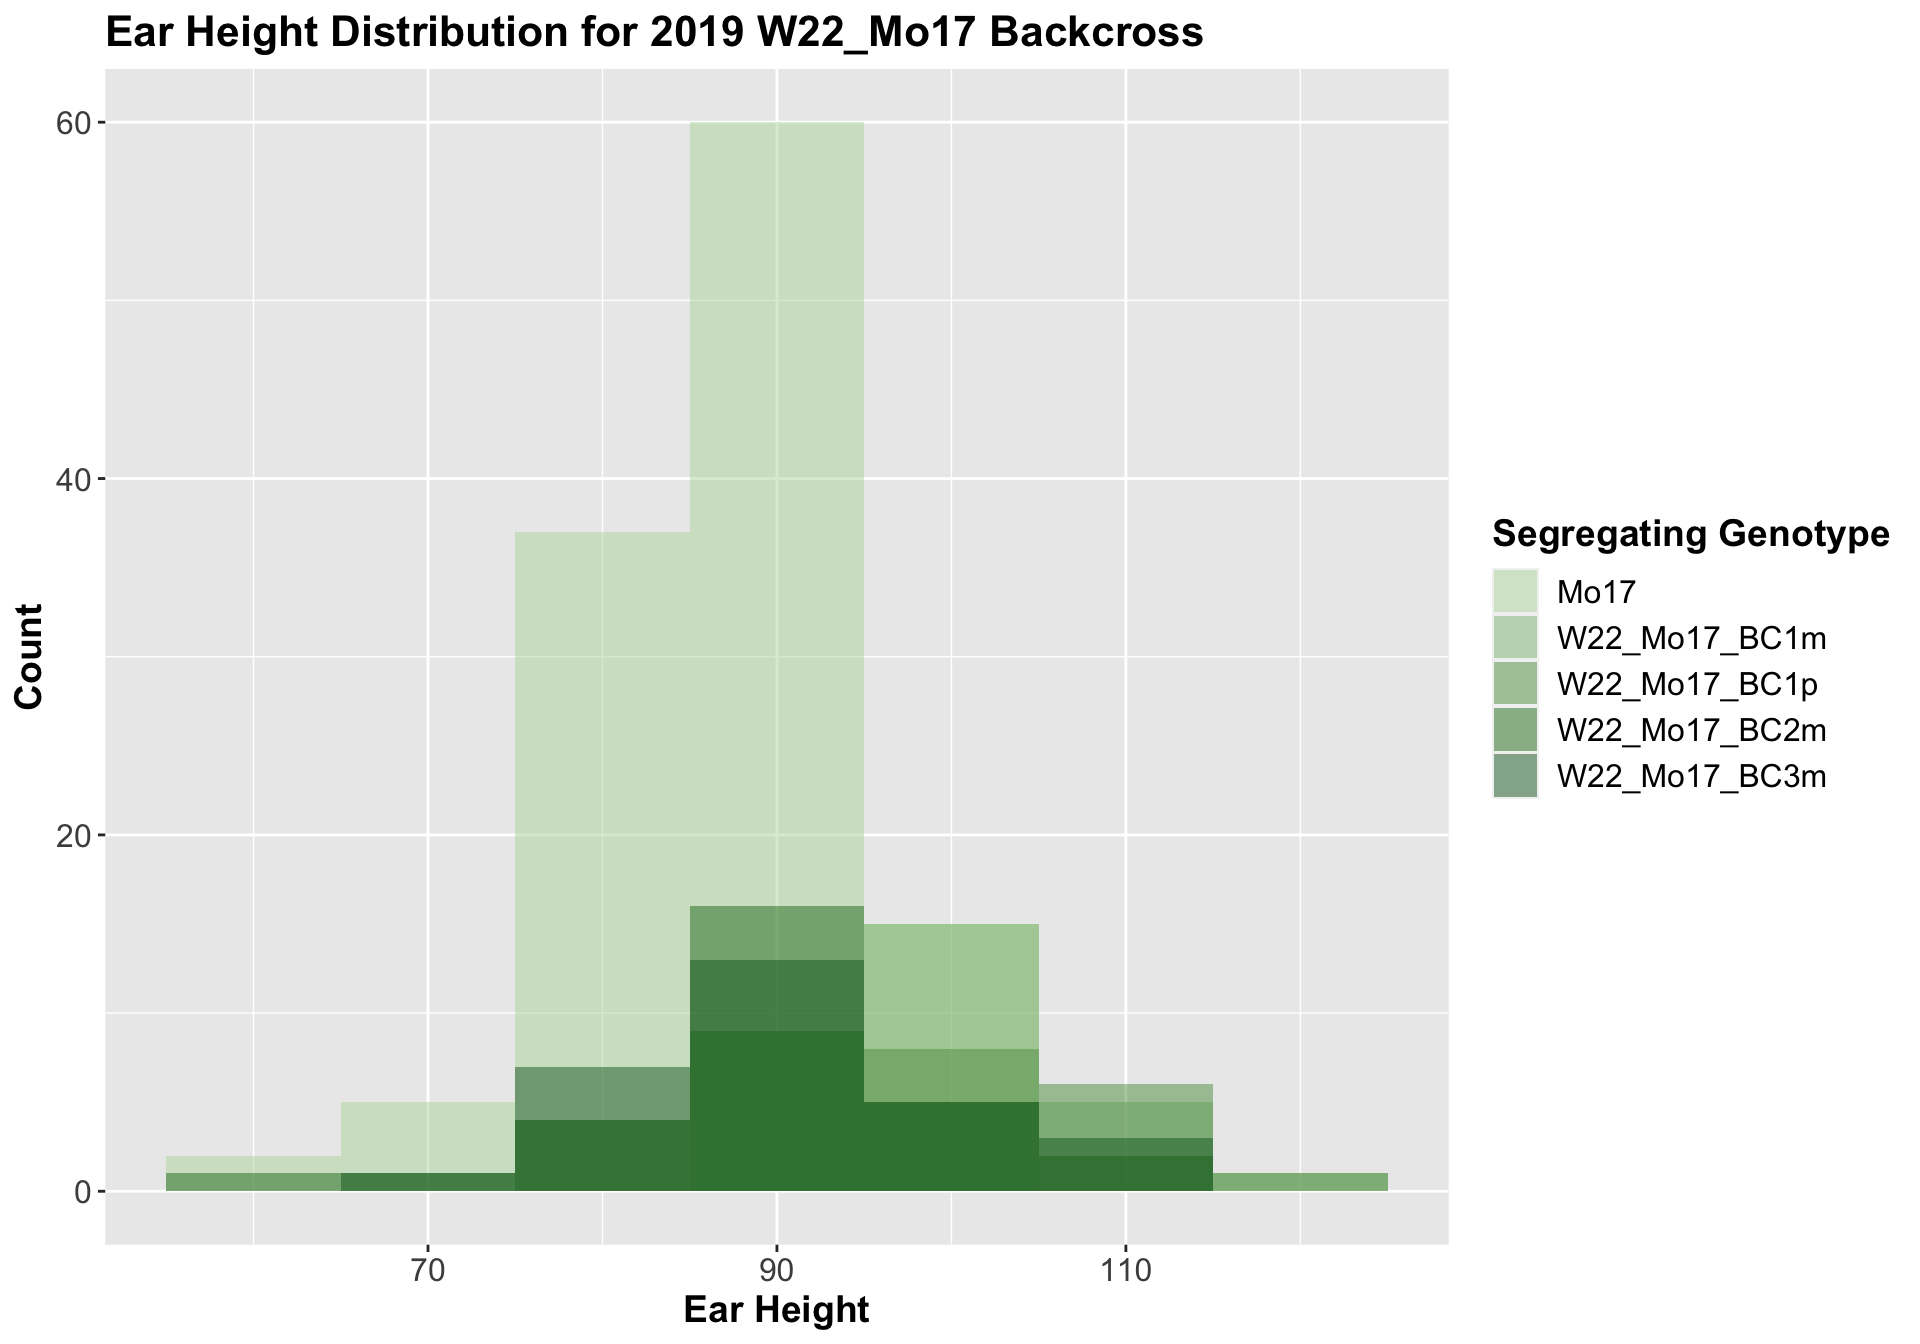
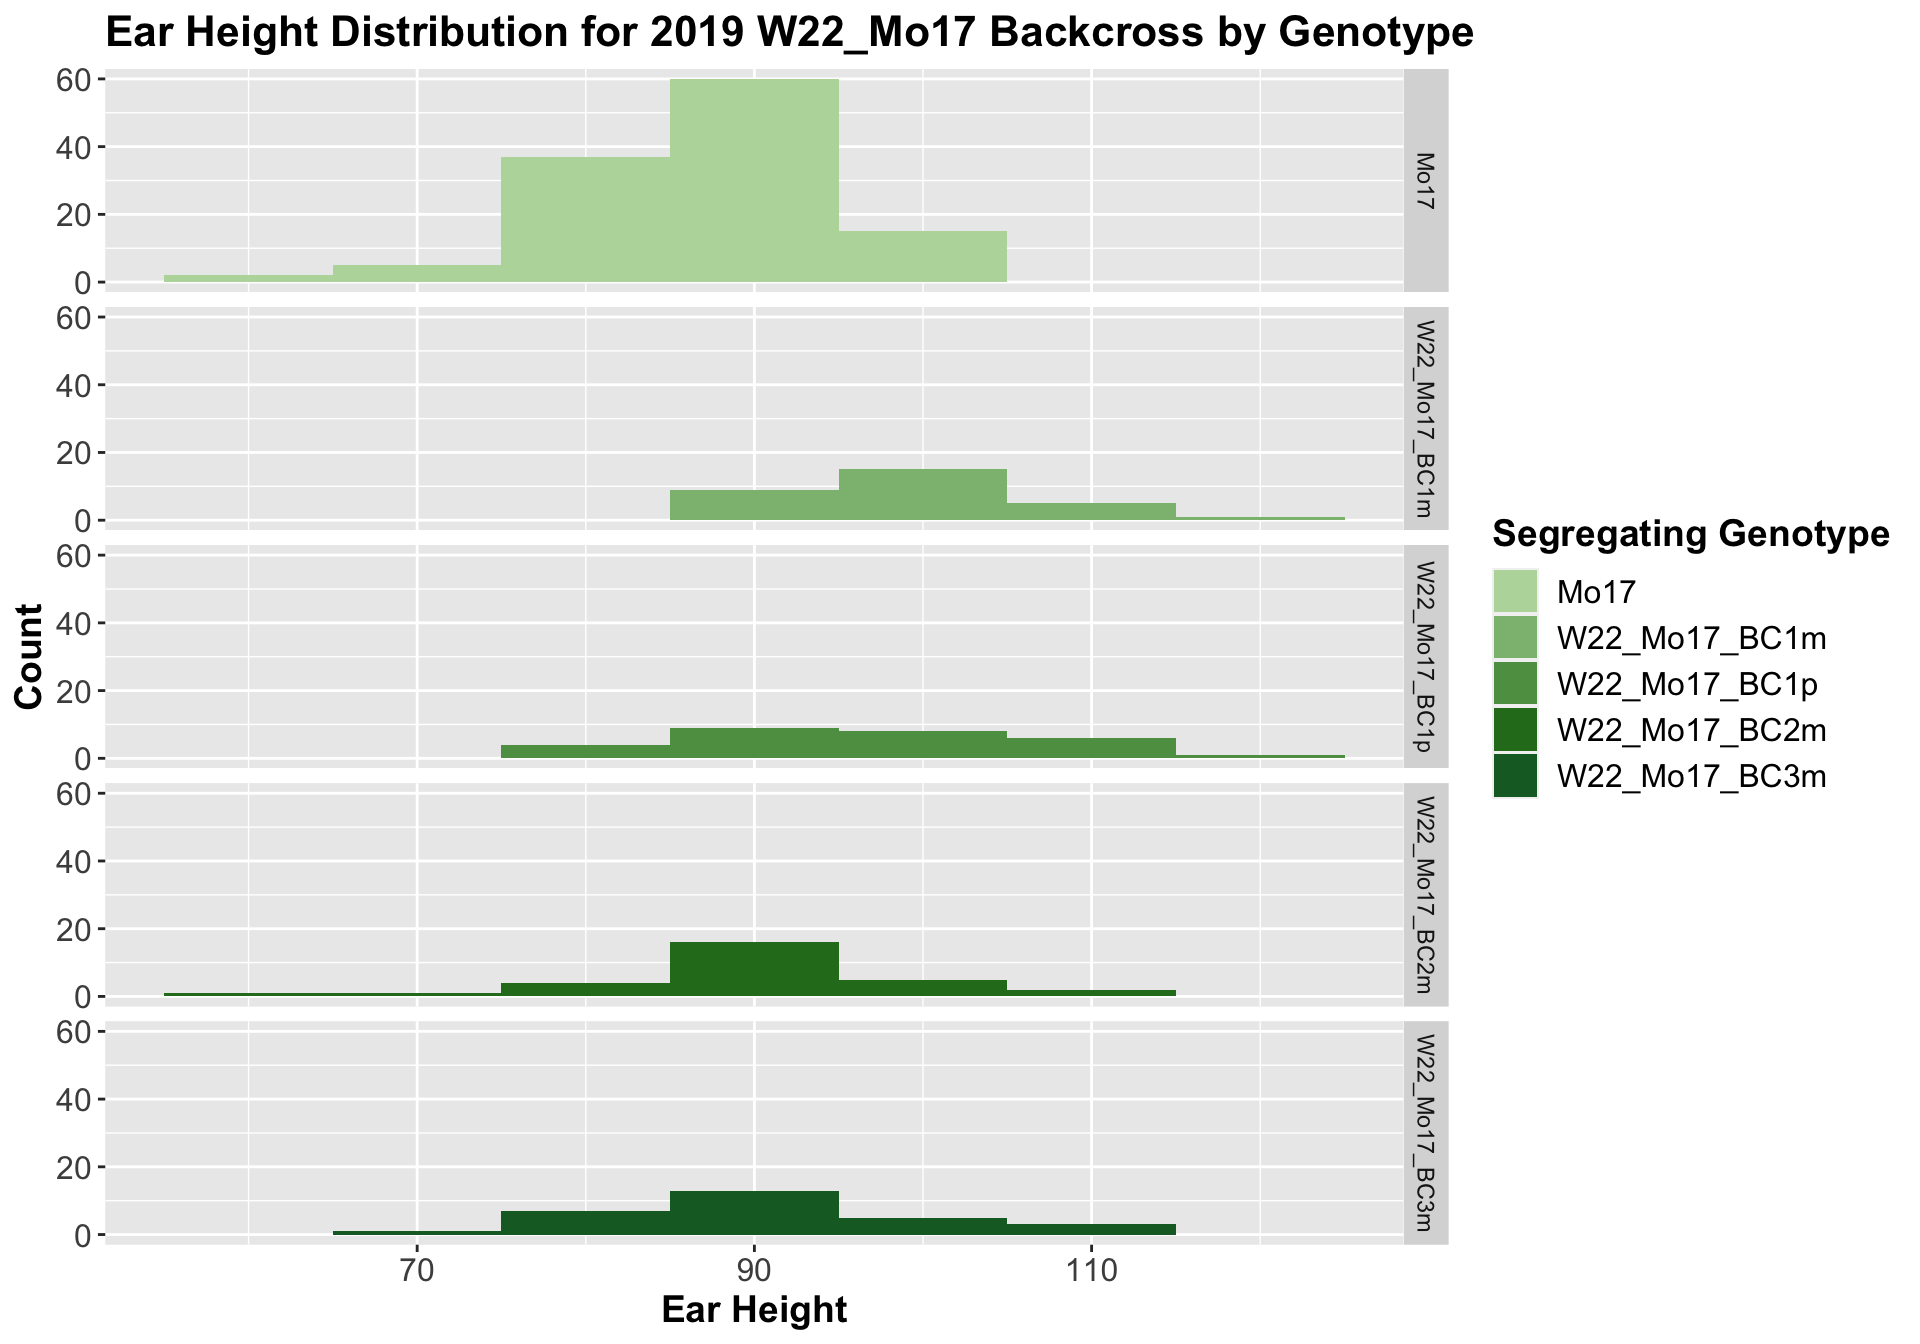
##
##  Mean, SD, and SE for each genotype
## Seg_Genotype N mean sd se
## 1 Mo17 119 87.67227 7.88058 0.7224116
## 2 W22_Mo17_BC1m 30 100.03333 7.51313 1.3717036
## 3 W22_Mo17_BC1p 28 97.89286 11.36707 2.1481746
## 4 W22_Mo17_BC2m 29 90.96552 10.30424 1.9134491
## 5 W22_Mo17_BC3m 29 91.31034 10.35824 1.9234766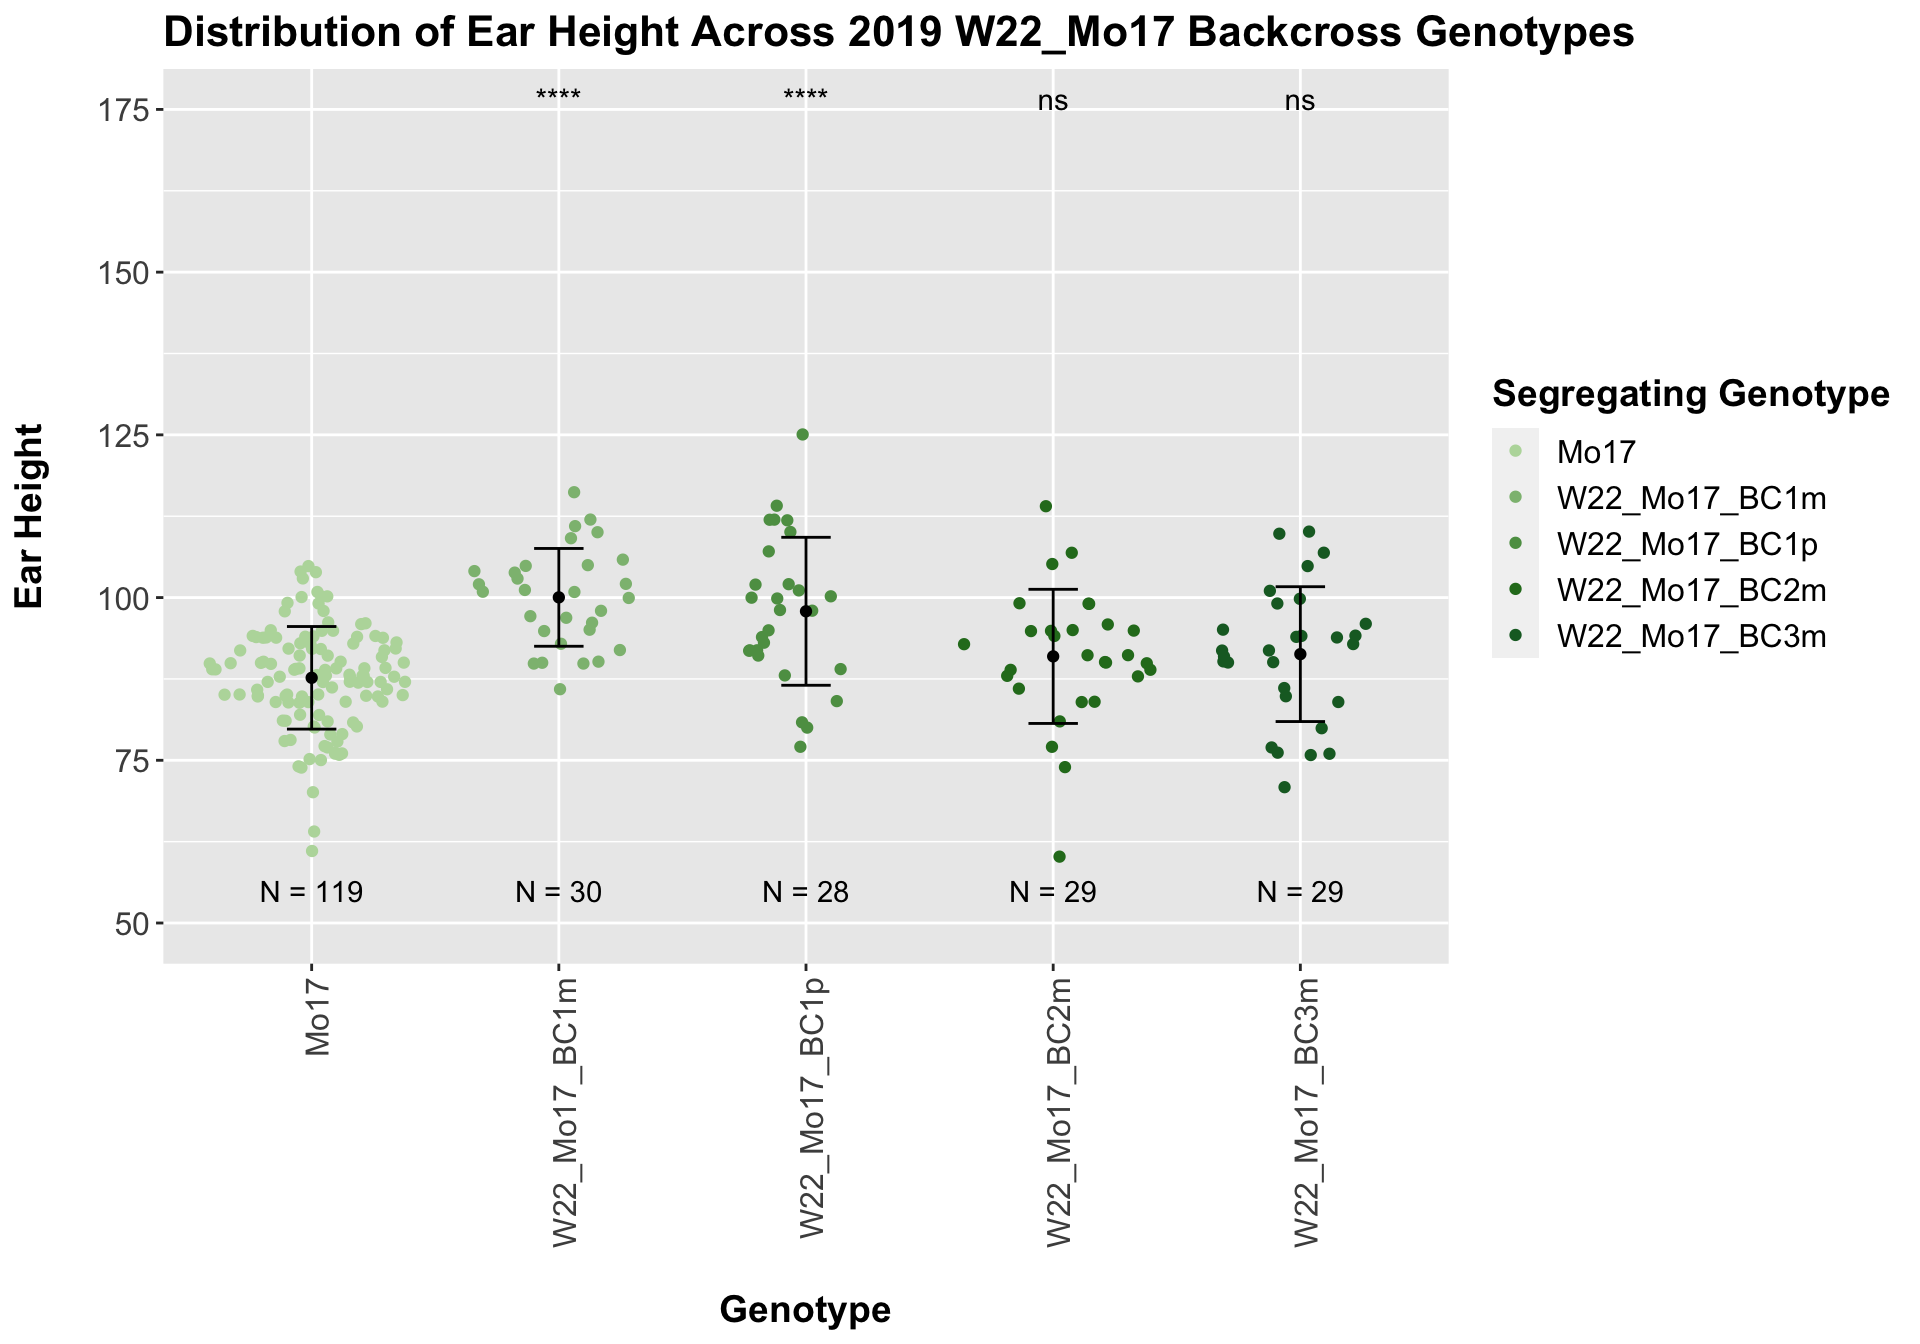
## # A tibble: 4 x 8
##   .y.          group1 group2              p       p.adj p.format p.signif method
##   <chr>        <chr>  <chr>           <dbl>       <dbl> <chr>    <chr>    <chr>
## 1 Plant_Height Mo17   W22_Mo17_BC… 3.03e-10     1.20e-9 3.0e-10  ****     T-test
## 2 Plant_Height Mo17   W22_Mo17_BC… 7.61e- 5     2.30e-4 7.6e-05  ****     T-test
## 3 Plant_Height Mo17   W22_Mo17_BC… 1.16e- 1     1.70e-1 0.116    ns       T-test
## 4 Plant_Height Mo17   W22_Mo17_BC… 8.50e- 2     1.70e-1 0.085    ns       T-test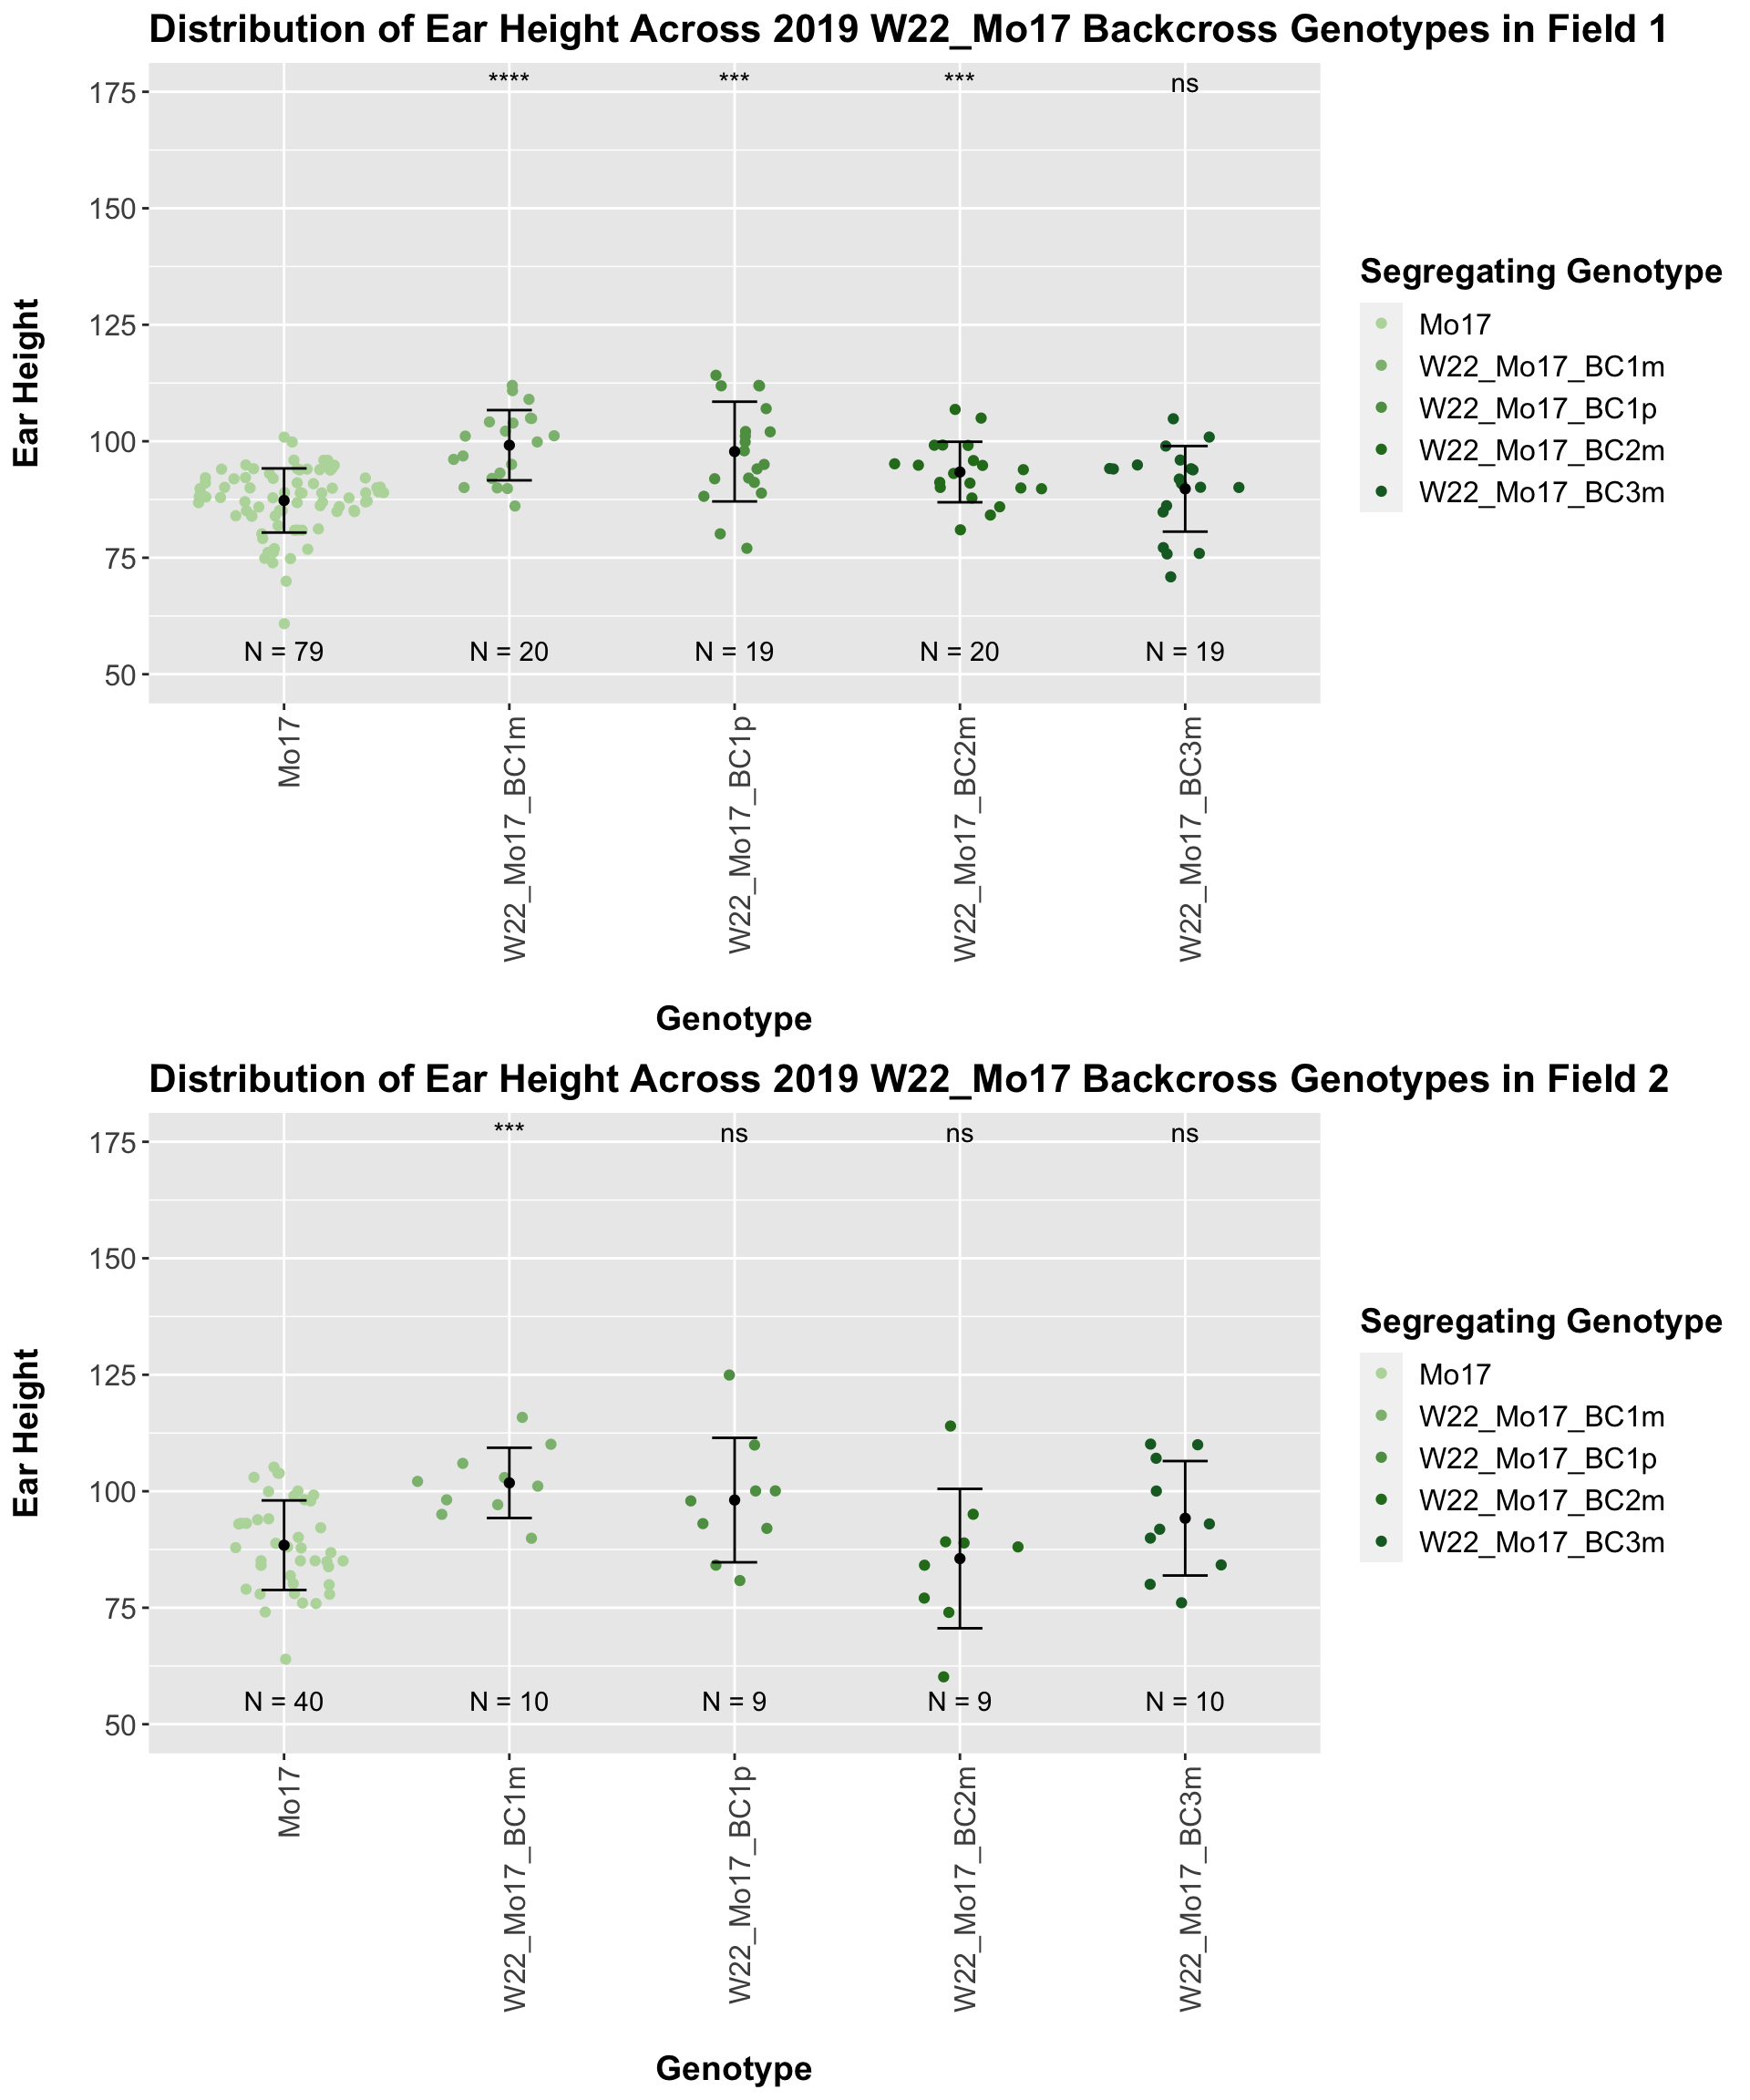
For the W22_Mo17 cross, we once again see an increase in height among early generations followed by a decline. In Field 2, we find that the later generations are not significantly different from the Mo17 line.
We now compare the distribution for sW22_Mo17 backcrosses to W22_Mo17 backcrosses and how each generaiton compares across these two sets. Note: when looking at these plots, just be aware that the genotypes don't align perfectly across backcrosses because we don't have a few crosses for the W22_Mo17 genotypes.
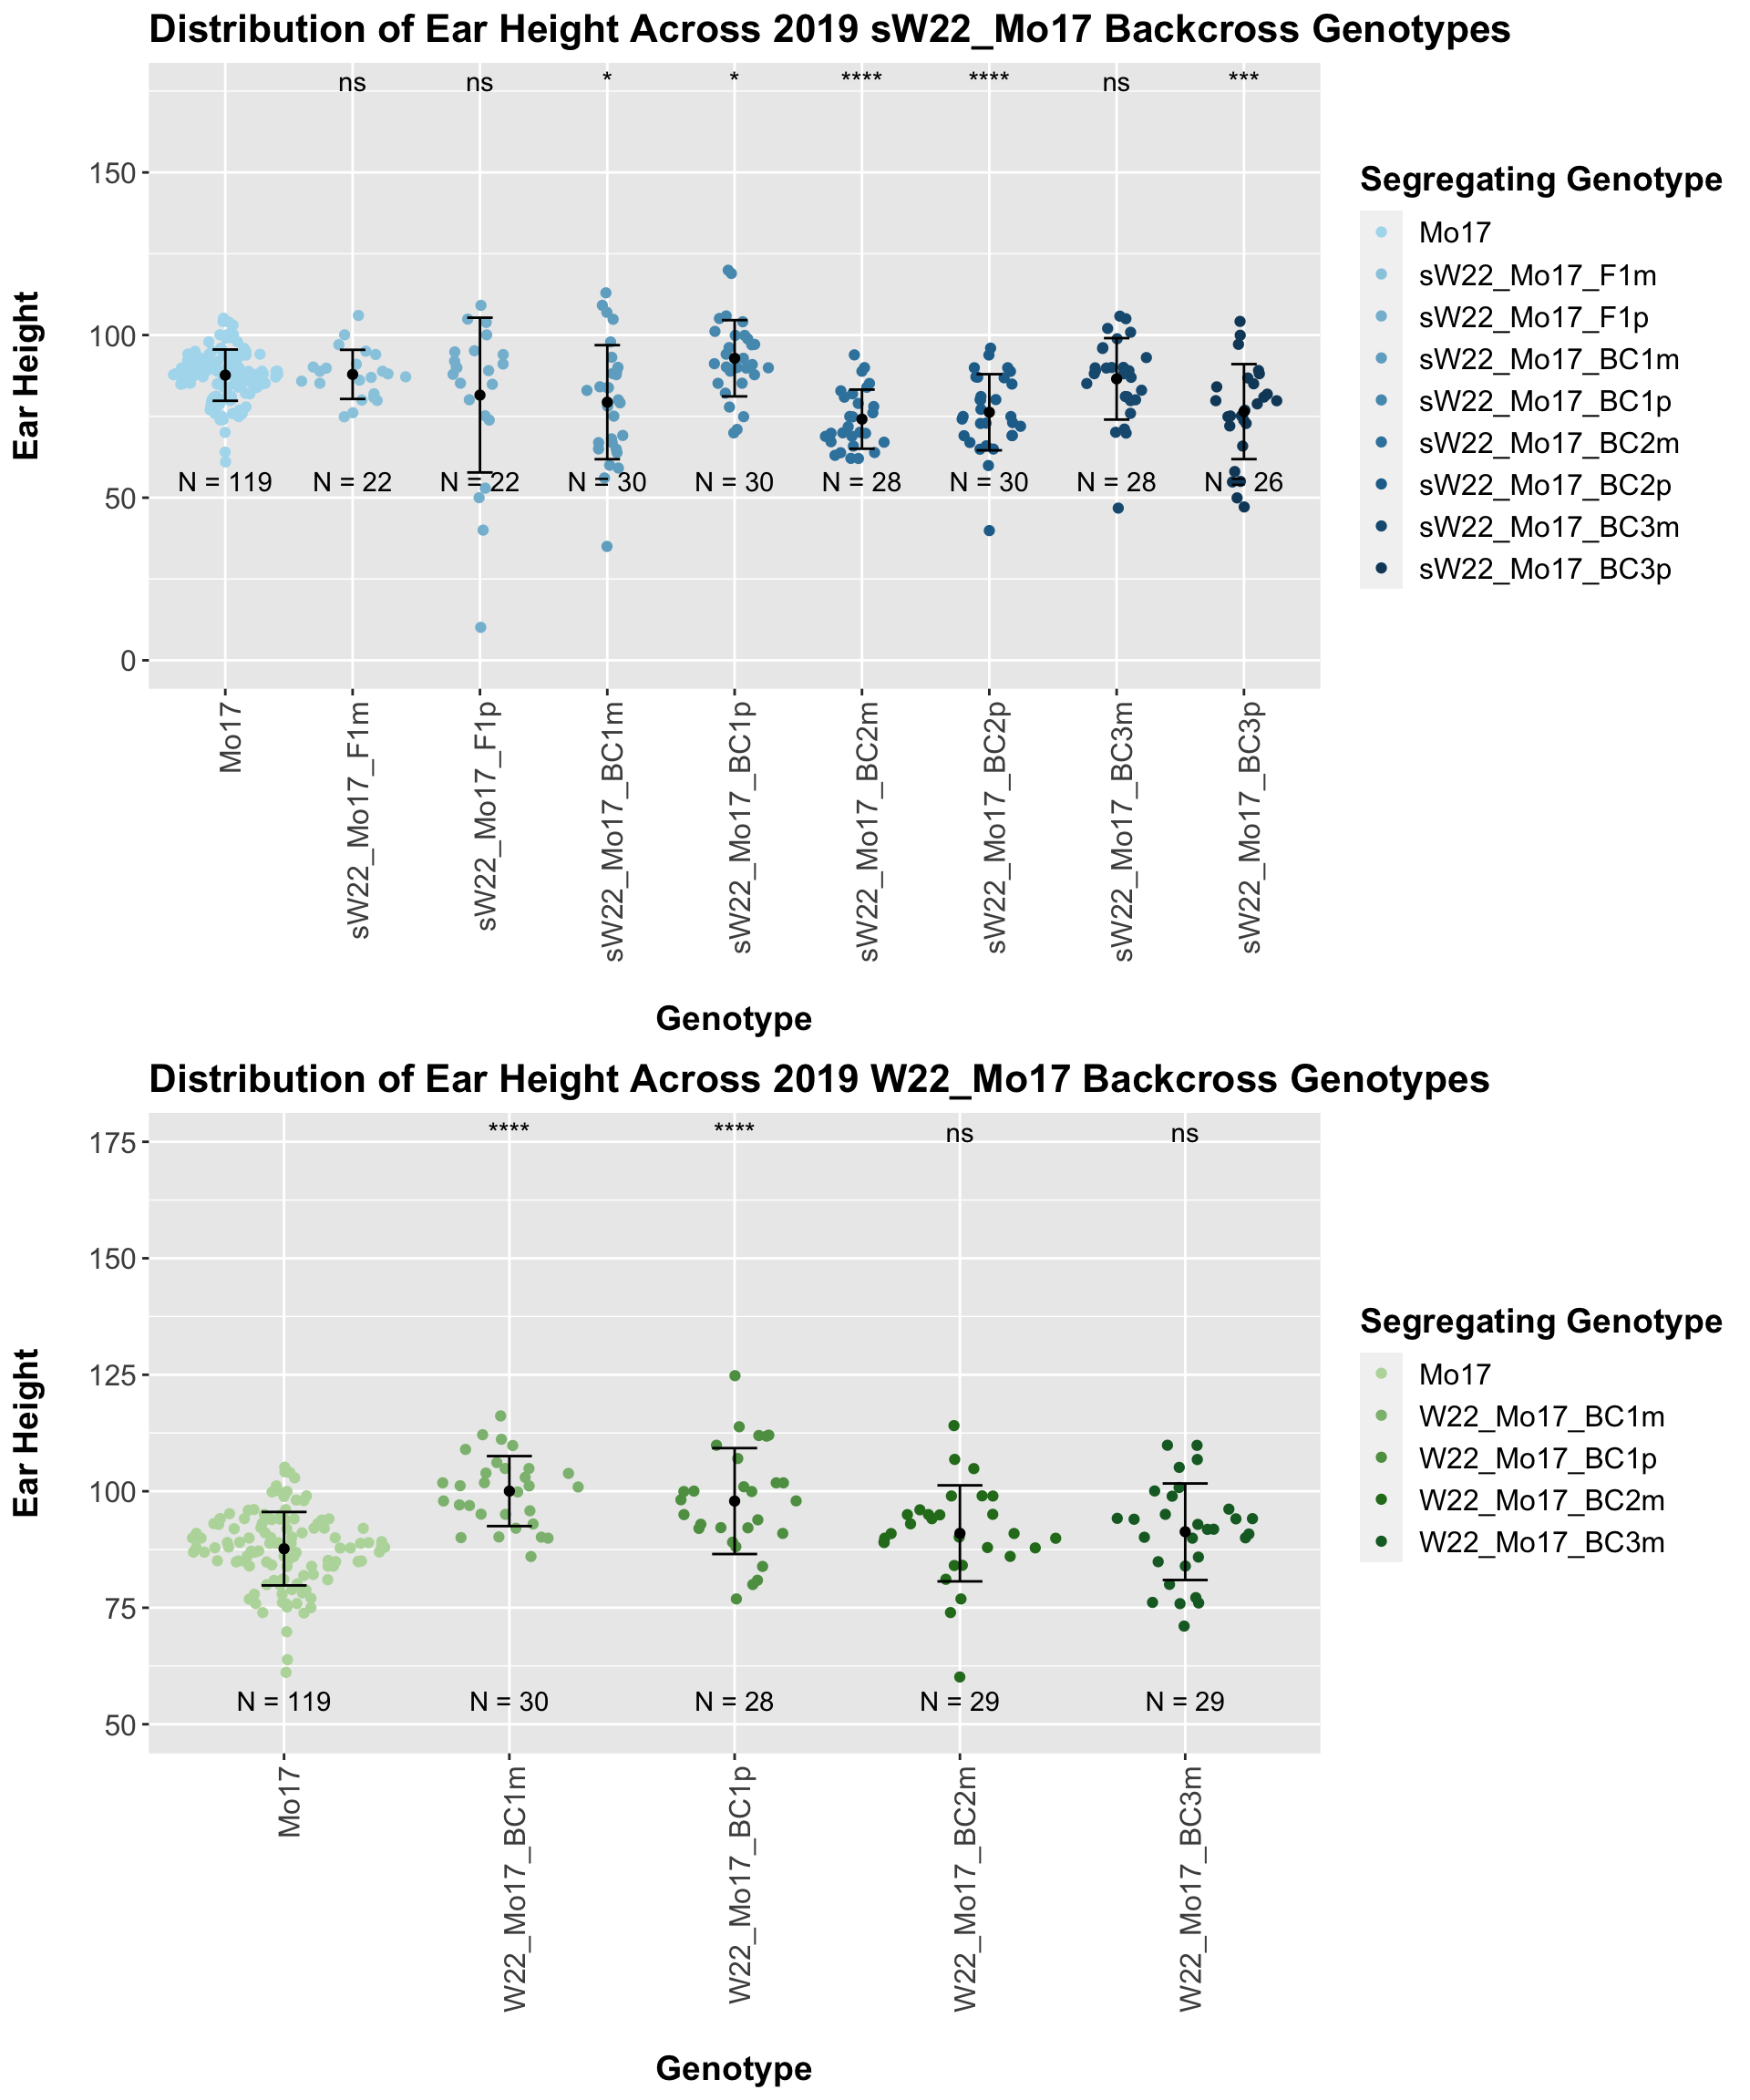
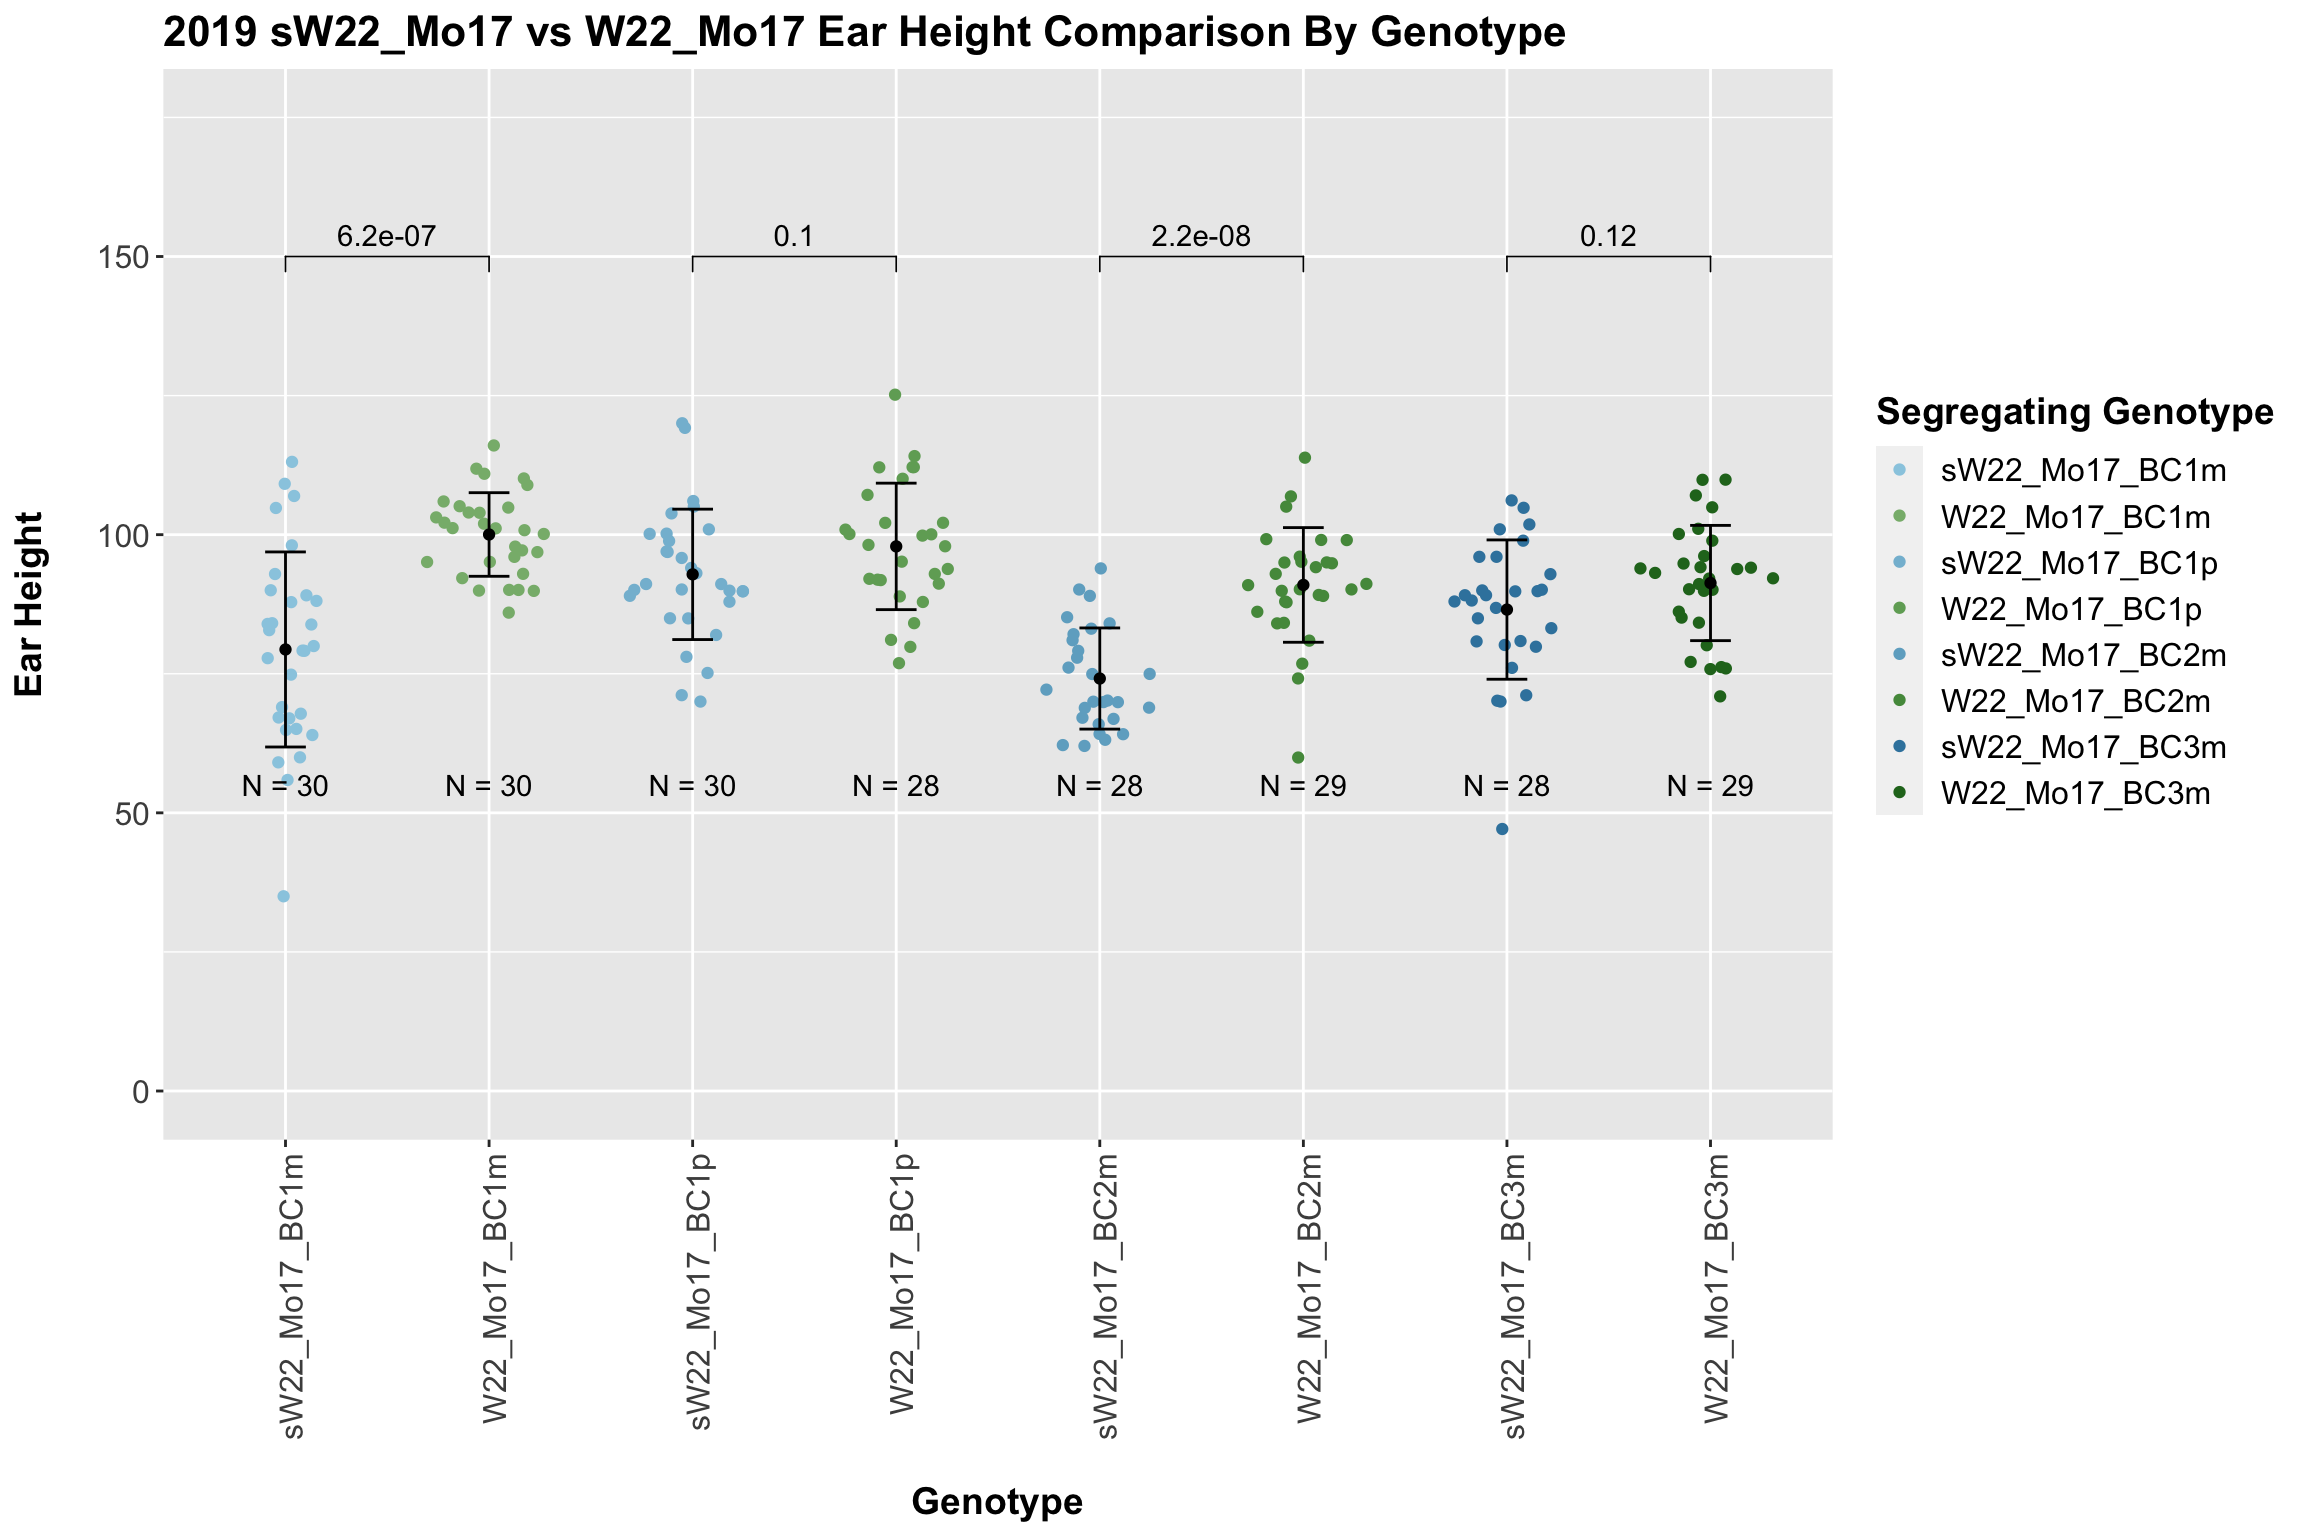
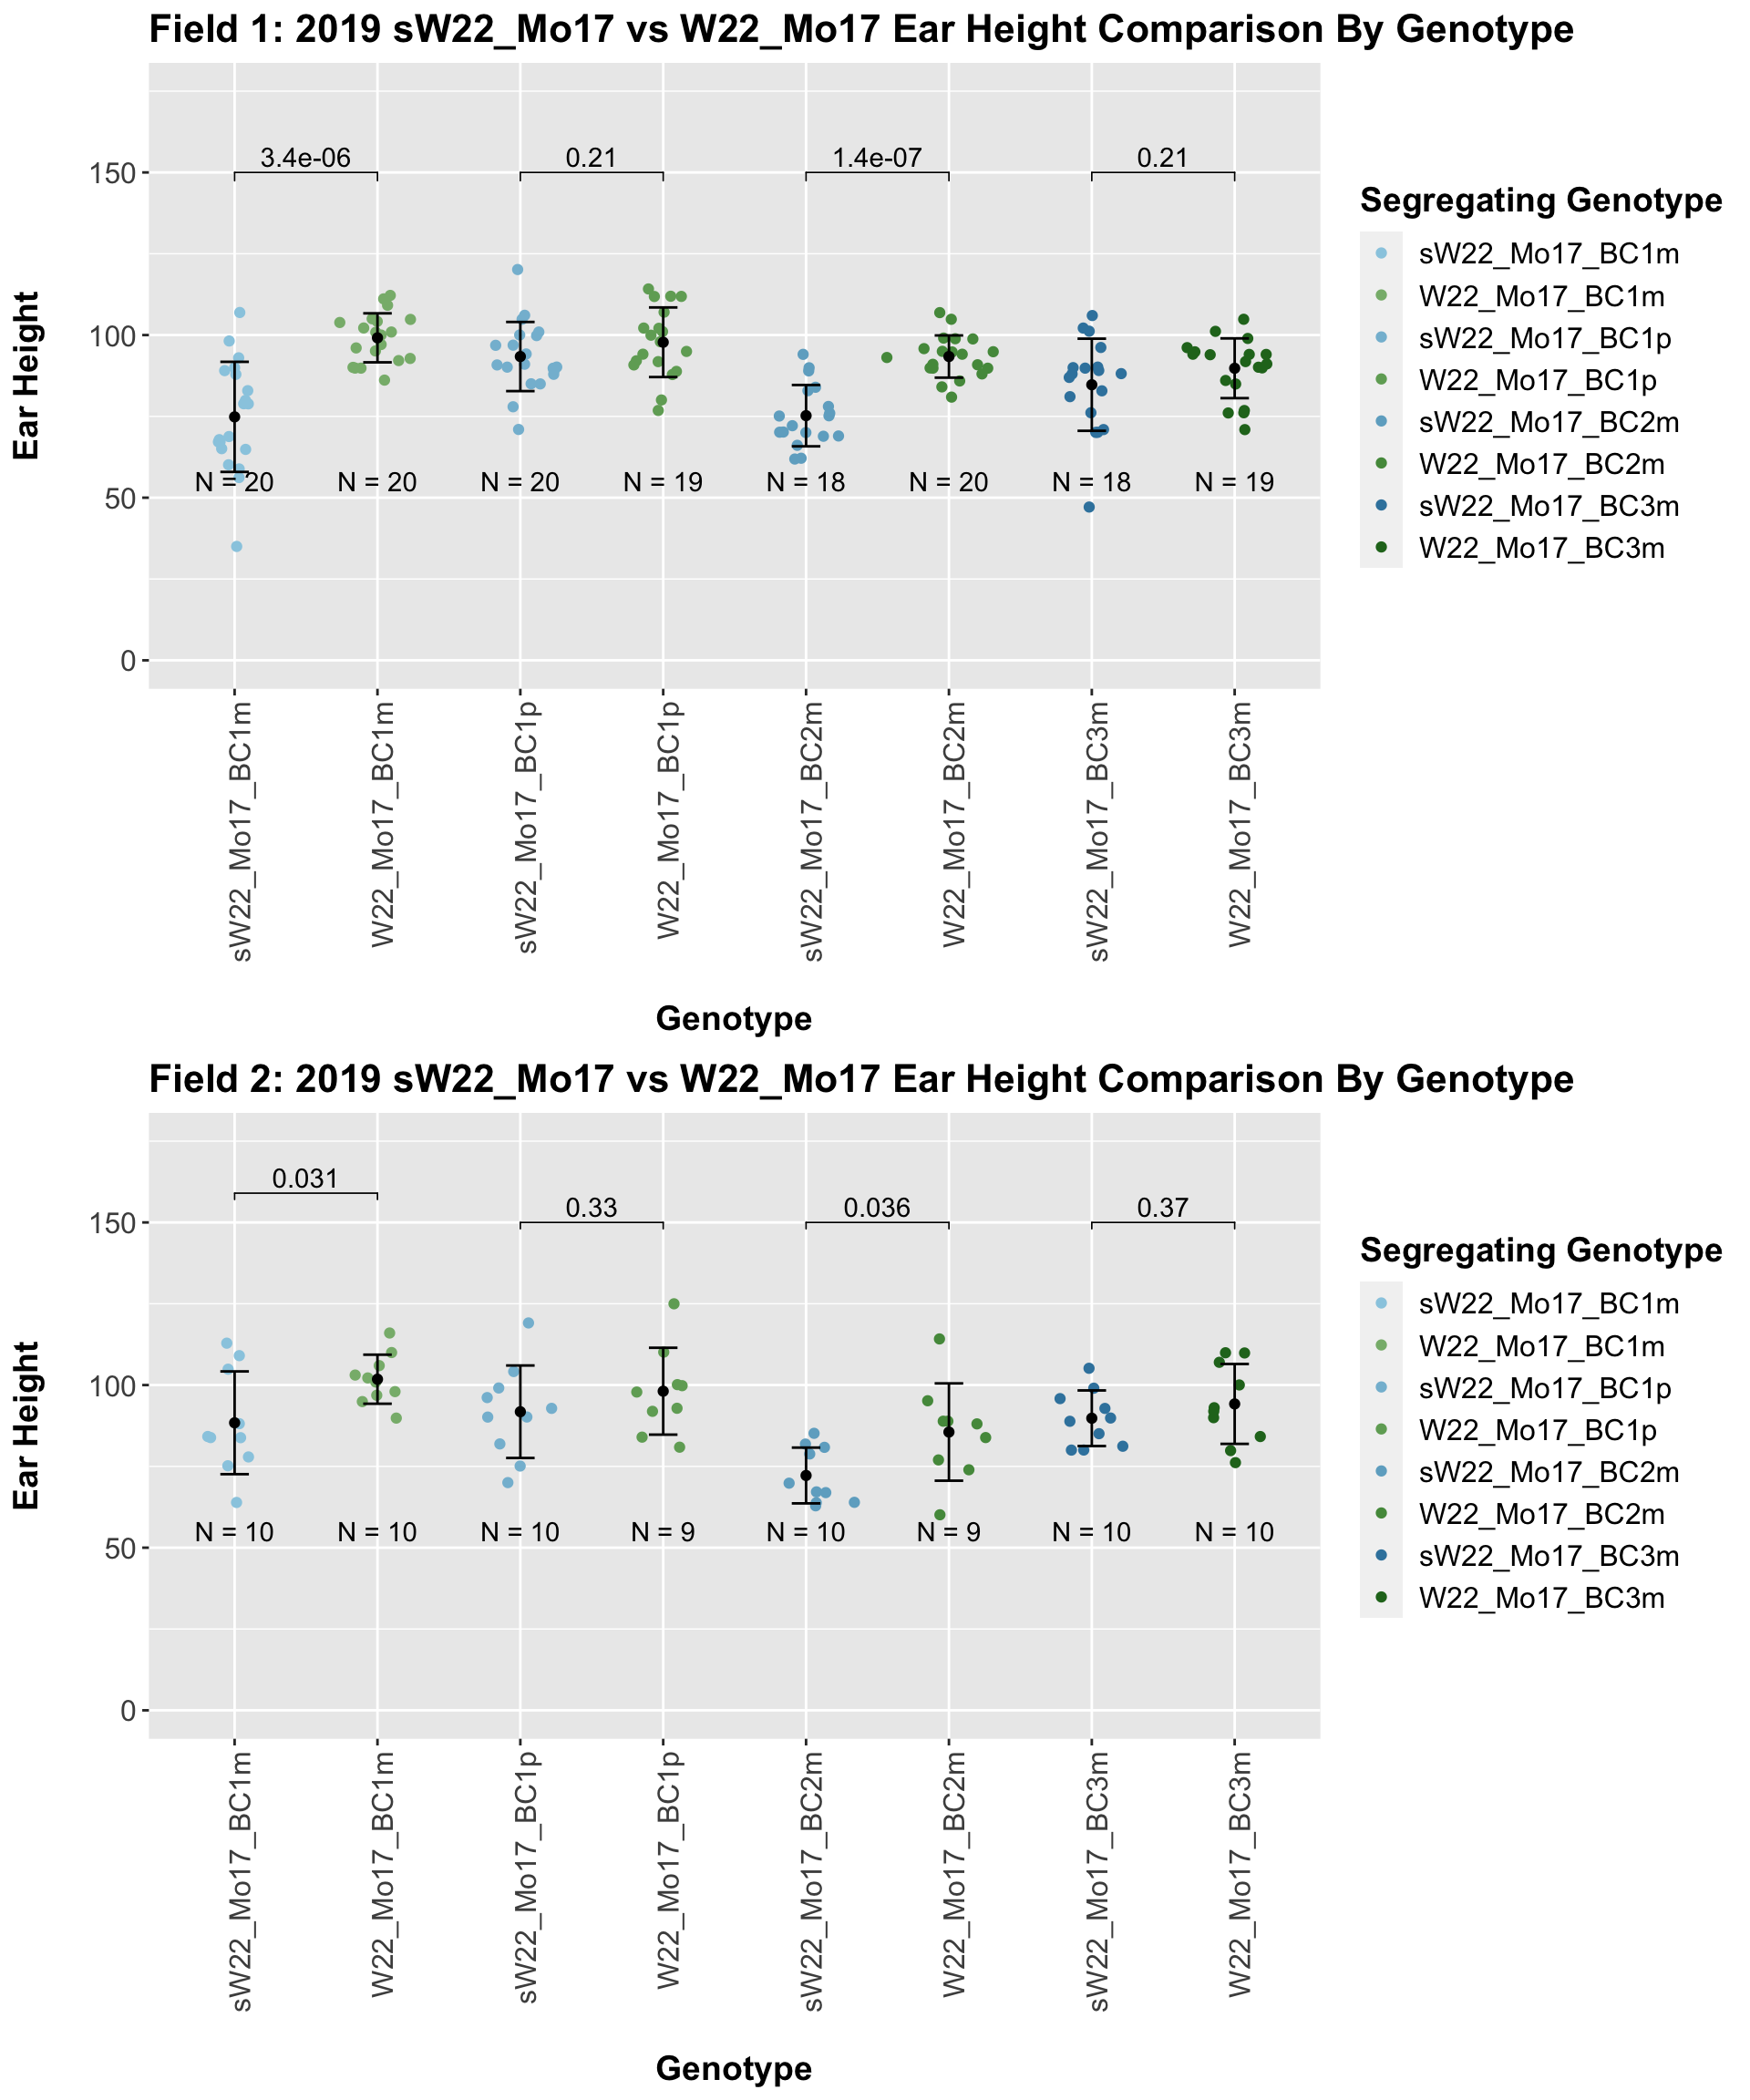
Here, we do not see a consistent difference in ear height between the sW22_Mo17 and W22_Mo17 backcrosses. This holds even we stratify the data by field.
We may also be interested the distribution for all sW22 backcrosses (crossed to W22, B73, and Mo17 respectively). Note: when looking at these plots, just be aware that the genotypes don't align perfectly across backcrosses so be sure to check the x-axis.
4.1.4 2019 ANOVA for Ear Height
We have only tested the difference between the mean of eac segregating genotype against the external control it has been backcrossed to. We now want to test whether (1) plant height is impacted by the sex of the sick parent and (2) the means across each backcross generation change NOTE: I was not fully confident in how/whether to incorporate the external stock information (W22, B73,Mo17) as these lineages were selfed and therefore had no sick parent to test the sex of. We also transformed the categorical genotype values (F1,BC1,BC2,BC3,BC4,BC5) to numerical values (0,1,2,3,4,5). NOTE: I'm not sure if this is appropriate. It'd be fairly simple to switch this back to categorical values if that would be better
We start by fitting a series of linear models:
- mod_full_int: Ear_Height (Numerical) ~ Field (Cateogrical) + Genotype (Numerical) + Sick_Sex (Categorical) + Genotype*Sick_Sex
- mod_full: Ear_Height (Numerical) ~ Field (Categorical) + Genotype (Numerical) + Sick_Sex (Categorical)
- mod_geno: Ear_Height (Numerical) ~ Field (Cateogrical) + Genotype (Numerical)
- mod_sex: Ear_Height (Numerical) ~ Field + Sick_Sex (Categorical)
We can then compare the fit of these models to our data using an ANOVA to test whether the more complex model (mod_full) is significantly better at capturing our height data than either of our simpler models. This will tell us whether incorporating sex/genotype significantly improves our model.
We can summarize the results of this across each set of genotypes. The significance codes are as follows:
- '***' - between 0 and 0.001
- '**' - between 0.001 and 0.01
- '*' - between 0.01 and 0.05
- '.' - between 0.05 and 0.1
- ' ' - between 0.1 and 1
##    Geno_Set   Sex_PValue Sex_Signif Genotype_PValue Genotype_Signif
## 1  sW22_W22 3.665082e-05        ***     0.309965633
## 2  sW22_B73 7.804580e-01                0.124893342
## 3 sW22_Mo17 9.014953e-01                0.030426895               *
## 4   W22_B73 2.507820e-01                0.001321369              **
## 5  W22_Mo17 8.105126e-01                0.001210510              **
##   Sex_Geno_Int_PValue Sex_Geno_Int_Signif
## 1           0.2897093
## 2           0.8121991
## 3           0.1399179
## 4           0.9310201
## 5                  NA
The results of our ANOVA do not show that all of our lineages are significantly impacted by the segregating genotype, the sex of the sick parent, or an interaction between the two of them. Only sW22 backcrossed to W22 is significantly impacted by the sex of the sick parent. W22_B73, sW22_Mo17, and W22_Mo17 show a significant influence of the segregating genotype, and we find that no lineage has a significant interaction between these terms.