8.3 One respondent
8.3.1 Estimate part-worths and importance weights
While some software requires you to first create dummy variables representing the attribute levels and then run a regression, Radiant does not require you to do so. You can simply use the attributes (each with multiple levels) as variables. We’ll first carry out a conjoint analysis on the data of one respondent (Individual 1):
respondent1 <- icecream %>% filter(respondent == "Individual 1")

# save the conjoint analysis in an object, because we'll use it as input to summary(), plot(), and predict() later on
conjoint_respondent1 <- conjoint(respondent1, rvar = "rating", evar = c("Flavor","Packaging","Light","Organic"))

summary(conjoint_respondent1)
## Conjoint analysis
## Data : respondent1
## Response variable : rating
## Explanatory variables: Flavor, Packaging, Light, Organic
##
## Conjoint part-worths:
## Attributes Levels PW
## Flavor Chocolate 0.000
## Flavor Mango 5.000
## Flavor Raspberry -1.500
## Flavor Strawberry 5.000
## Flavor Vanilla 3.500
## Packaging Cone 0.000
## Packaging Homemade waffle 0.000
## Packaging Pint -2.000
## Light Low fat 0.000
## Light No low fat -1.000
## Organic Not organic 0.000
## Organic Organic 1.400
## Base utility ~ 3.800
##
## Conjoint importance weights:
## Attributes IW
## Flavor 0.596
## Packaging 0.183
## Light 0.092
## Organic 0.128
##
## Conjoint regression results:
##
## coefficient
## (Intercept) 3.800
## Flavor|Mango 5.000
## Flavor|Raspberry -1.500
## Flavor|Strawberry 5.000
## Flavor|Vanilla 3.500
## Packaging|Homemade waffle 0.000
## Packaging|Pint -2.000
## Light|No low fat -1.000
## Organic|Organic 1.400The output gives part-worths, importance weights, and regression coefficients. The part-worths and the regression coefficients give the same information: compared to the reference level (the first level of an attribute; you’ll see that the part-worths are always zero for this level), how much does each attribute level increase or decrease the rating of an ice cream? We can plot these results:
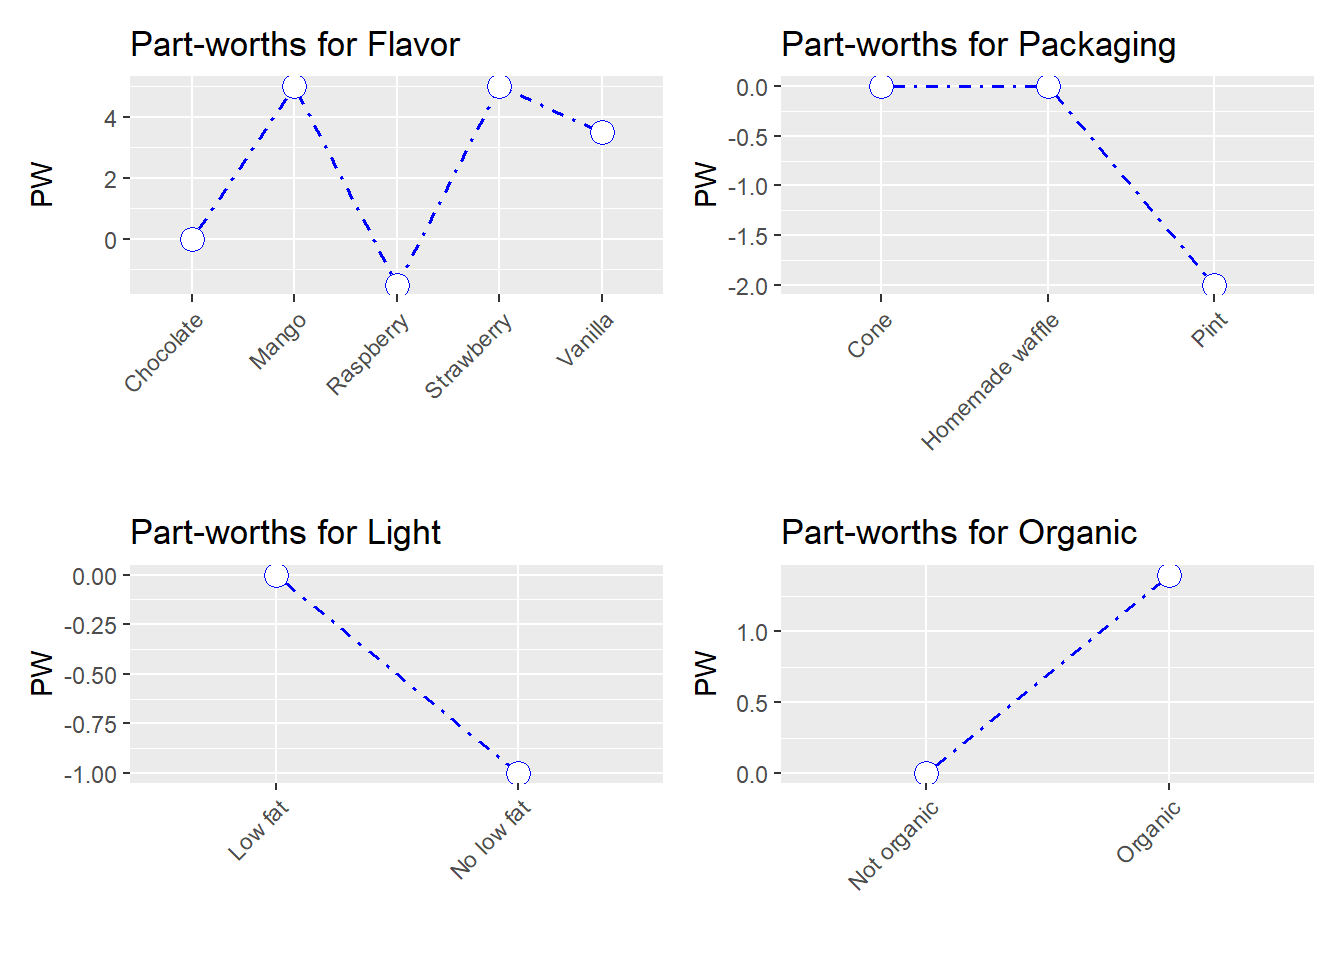
And then we easily see that this person would enjoy a low fat, organic, mango or strawberry ice cream in a cone or one a homemade waffle the most.
Note that the Conjoint regression results are simply the results of a multiple linear regression:
# Run this regression if you're interested in learning which predictor is significant or what the R-squared of the overall model is.
summary(lm(rating ~ Flavor + Packaging + Light + Organic, data = respondent1))
##
## Call:
## lm(formula = rating ~ Flavor + Packaging + Light + Organic, data = respondent1)
##
## Residuals:
## 1 2 3 4 5 6 7 8 9 10
## -0.3 -0.2 0.3 -0.2 0.2 0.2 -0.3 -0.2 0.2 0.3
##
## Coefficients:
## Estimate Std. Error t value Pr(>|t|)
## (Intercept) 3.800e+00 8.426e-01 4.510 0.139
## FlavorMango 5.000e+00 9.747e-01 5.130 0.123
## FlavorRaspberry -1.500e+00 9.747e-01 -1.539 0.367
## FlavorStrawberry 5.000e+00 8.660e-01 5.774 0.109
## FlavorVanilla 3.500e+00 9.747e-01 3.591 0.173
## PackagingHomemade waffle 1.570e-15 8.944e-01 0.000 1.000
## PackagingPint -2.000e+00 8.660e-01 -2.309 0.260
## LightNo low fat -1.000e+00 5.916e-01 -1.690 0.340
## OrganicOrganic 1.400e+00 4.899e-01 2.858 0.214
##
## Residual standard error: 0.7746 on 1 degrees of freedom
## Multiple R-squared: 0.9927, Adjusted R-squared: 0.9345
## F-statistic: 17.06 on 8 and 1 DF, p-value: 0.1852Finally, the importance weights tell us how strongly each attribute determines the rating of an ice cream. For this respondent, flavor is the most important attribute and light is the least important attribute. This respondent’s rating is determined for 59.6 percent by flavor and for 9.2 percent by light.
8.3.2 Profiles: predicted utilities
Predicting the ratings (utilities) of the different ice creams is very easy in R. First, let’s make sure we have a dataset with the different profiles that were tested:
profiles <- icecream %>%
  filter(respondent == "Individual 1") %>%
  select(Flavor,Packaging,Light,Organic)

profiles
## # A tibble: 10 x 4
## Flavor Packaging Light Organic
## <fct> <fct> <fct> <fct>
## 1 Raspberry Homemade waffle No low fat Not organic
## 2 Chocolate Cone No low fat Organic
## 3 Raspberry Pint Low fat Organic
## 4 Strawberry Pint No low fat Organic
## 5 Strawberry Cone Low fat Not organic
## 6 Chocolate Homemade waffle No low fat Not organic
## 7 Vanilla Pint Low fat Not organic
## 8 Mango Homemade waffle Low fat Organic
## 9 Mango Pint No low fat Not organic
## 10 Vanilla Homemade waffle No low fat OrganicThen, we ask the predict function to predict the ratings of the profiles based on the regression function:
## Conjoint Analysis
## Data                 : respondent1
## Response variable    : rating
## Explanatory variables: Flavor, Packaging, Light, Organic
## Prediction dataset   : profiles
##
##      Flavor       Packaging      Light     Organic Prediction
##   Raspberry Homemade waffle No low fat Not organic      1.300
##   Chocolate            Cone No low fat     Organic      4.200
##   Raspberry            Pint    Low fat     Organic      1.700
##  Strawberry            Pint No low fat     Organic      7.200
##  Strawberry            Cone    Low fat Not organic      8.800
##   Chocolate Homemade waffle No low fat Not organic      2.800
##     Vanilla            Pint    Low fat Not organic      5.300
##       Mango Homemade waffle    Low fat     Organic     10.200
##       Mango            Pint No low fat Not organic      5.800
##     Vanilla Homemade waffle No low fat     Organic      7.700
The predicted rating is highest for low fat, organic, mango ice cream on a homemade waffle. But these are predictions for ice creams that the respondent has actually rated. If we wanted to know which ice cream the respondent liked most, we could have just looked at his/her observed (instead of predicted) ratings. It’s more interesting to get predictions for ice creams that the respondent has not rated. For this, we need the profiles for all possible ice creams. We can create these profiles with the expand.grid function. The expand.grid function takes two or more vectors and creates every possible combination of elements of those vectors:
Flavor <- c("Raspberry","Chocolate","Mango","Strawberry","Vanilla")
Organic <- c("Organic","Not organic")

expand.grid(Flavor, Organic)
## Var1 Var2
## 1 Raspberry Organic
## 2 Chocolate Organic
## 3 Mango Organic
## 4 Strawberry Organic
## 5 Vanilla Organic
## 6 Raspberry Not organic
## 7 Chocolate Not organic
## 8 Mango Not organic
## 9 Strawberry Not organic
## 10 Vanilla Not organicLet’s do this for all our attribute levels:
# there's an easier way to get attribute levels than creating the vectors manually:
levels(icecream$Flavor) # make sure that Flavor is factorized first!
## [1] "Chocolate" "Mango" "Raspberry" "Strawberry" "Vanilla"# now create all the profiles
profiles.all <- expand.grid(levels(icecream$Flavor),levels(icecream$Packaging),levels(icecream$Light),levels(icecream$Organic)) %>%
rename("Flavor" = "Var1", "Packaging" = "Var2", "Light" = "Var3", "Organic" = "Var4") # rename the variables created by expand.grid (don't forget this, otherwise predict won't know where to look for each attribute)
# predict the ratings of all profiles
predict(conjoint_respondent1, profiles.all) %>%
arrange(desc(Prediction)) # show the ice creams with the highest predicted rating on top## Conjoint Analysis
## Data : respondent1
## Response variable : rating
## Explanatory variables: Flavor, Packaging, Light, Organic
## Prediction dataset : profiles.all
## Rows shown : 20 of 60
##
## Flavor Packaging Light Organic Prediction
## Strawberry Homemade waffle Low fat Organic 10.200
## Strawberry Cone Low fat Organic 10.200
## Mango Homemade waffle Low fat Organic 10.200
## Mango Cone Low fat Organic 10.200
## Strawberry Homemade waffle No low fat Organic 9.200
## Strawberry Cone No low fat Organic 9.200
## Mango Homemade waffle No low fat Organic 9.200
## Mango Cone No low fat Organic 9.200
## Strawberry Homemade waffle Low fat Not organic 8.800
## Strawberry Cone Low fat Not organic 8.800
## Mango Homemade waffle Low fat Not organic 8.800
## Mango Cone Low fat Not organic 8.800
## Vanilla Homemade waffle Low fat Organic 8.700
## Vanilla Cone Low fat Organic 8.700
## Strawberry Pint Low fat Organic 8.200
## Mango Pint Low fat Organic 8.200
## Strawberry Homemade waffle No low fat Not organic 7.800
## Strawberry Cone No low fat Not organic 7.800
## Mango Homemade waffle No low fat Not organic 7.800
## Mango Cone No low fat Not organic 7.800Same conclusion as that from the previous section: this person would enjoy a low fat, organic, mango or strawberry ice cream in a cone or one a homemade waffle the most.