Chapter 8 Quality Management Systems
8.1 Introduction
Deming recognized that he was speaking to the wrong audience, when talking to Japanese engineers around 1950. Although the use of statistical methods to improve and control quality had been proven to be effective, Deming felt that their use would wane in Japan, as it had in the US, unless the top executives of companies were convinced of the competitive advantage for using them. In 1950, efforts to improve quality were based on the assumption that defects were costly. However, executives who were used to making decisions on facts had little evidence of that.
Joseph Juran in his 1951 Quality Control Handbook(Juran 1951) sought to give some facts. The first chapter discussed the economics of quality, He observed that there were avoidable and unavoidable costs of achieving a given level of quality. The unavoidable costs were associated with prevention, inspection, sampling, statistical process control, process improvements, and other quality initiatives. The avoidable costs were the costs associated with defects and product failures such as: scrapped materials, labor hours for rework and repair, complaint processing, and financial losses resulting from lost sales.
The last category of avoidable costs was hard to quantify, but the others could be quantified by the accounting department. Juran could show that increased investment in the unavoidable costs could actually reduce the avoidable costs to more than offset the increase unavoidable costs. Thereby, the total cost of producing a given quality level could be reduced. This was not even considering the loss of customers and reputation that could result from poor quality. Juran’s message gave executives a reason to invest in quality. The financial benefits could be substantial. Juran referred to improvements in quality as “gold in the mine”.
In 1956, Feigenbaum(Feigenbaum 1956) proposed ways that executives could lead the way to “mine the gold”. In his 1956 article, and later book by the same name, he proposed “Total Quality Control”(Feigenbaum 1961). The premise being that high quality could not be achieved by leaving responsibility to one group such as engineering or production. He emphasized that quality had to be everyone’s job led by the top management of the company.
Along with Total Quality Control as a way to “mine the gold” or achieve high quality, it was realized by many that the goal of high quality was a moving target. Competitors were improving quality as well. This became very apparent during the 1980’s when many companies lost market share to Japanese competitors. Therefore, the goal changed from simply achieving high quality to continuous improvement in quality. To sustain these continuing efforts, top executive leadership became even more necessary.
Feigenbaum noted that all quality control and improvement efforts are involved in the following three activities:
incoming material control
design of the process
process control and improvements.
A useful tool for thinking about these activities is the SIPOC diagram shown in Section 5.1. Specific tasks involved in the three activities are supply chain management, product and process design and development, manufacturing control, and customer relations and customer satisfaction. These tasks involve more than statistical process control and they require involvement and cooperation of several functional areas. Therefore, top executives had to become involved in coordinating the efforts of different functional areas, setting the standards, and defining the important quality measures. To coordinate the efforts of different functional areas a systems approach was needed.
Total Quality Management (TQM) developed out of the philosophies of Deming and Juran in the early 1980s. It was a quality management strategy or system for implementing and guiding quality improvement efforts throughout a company. This strategy sought to incorporate things such as:
employee involvement and workplace culture
supplier quality improvement
increased customer focus,
into the normal business practices in order to facilitate quality improvement efforts. TQM was a popular management system in the 1980s and had moderate success. The way it was implemented varied from company to company, and some of the reasons for only moderate success were: the lack of management attention on reducing variability and use of statistical methods, and the targeting general rather than company specific objectives(Burke and Silvestrini 2017).
8.2 Quality Systems Standards and Guidelines
A Quality Management System or QMS is based on Juran’s Trilogy of Planning, Control and Improvement. The plans for acheiving these objectives is documented in what is called the quality manual. Burke and Silvestrini (Burke and Silvestrini 2017) represent a generic quality manual as a four tiered document known as the document pyramid as illustrated in Figure 8.1
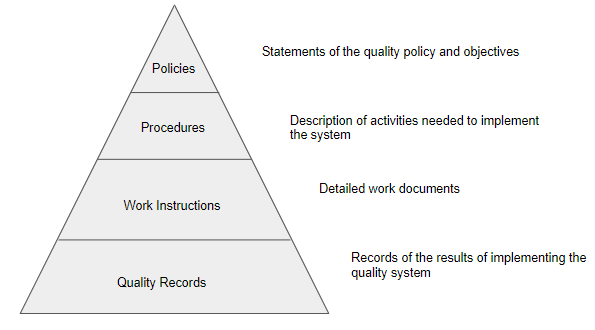
Figure 8.1 Quality Manual Documentation Tiers
Quality philosophies and QMSs have revolutionized the business world. To be competitive in markets, adopting some kind of quality management system is no longer an option(Brocka and Brocka 1992). The emphasis on continuous improvement in quality and customer satisfaction has demanded standards and guidelines to assure effective quality management systems.
In previous chapters ANSI/ASQ/ISO guidelines for sampling inspection, use of control charts, and experimental design methods have been discussed. The next section will describe some of the standards that have been developed for entire quality management systems (QMS).
8.2.1 ISO 9000
Despite the large number of languages represented among all the international standards organizations, ISO reflects the English language abbreviation of International Standardization Organization and it remains the same in every country. As markets for companies expanded around the world, international standards have become a necessity since there were differences among national standards. In the 1970s and 80s, a major cooperative effort between countries and international companies resulted in the ISO 9000 family of standards, which is the set of requirements a company must satisfy to become ISO 9000 registered or certified. ISO 9000 is based on the seven quality management principles(Burke and Silvestrini 2017):
Customer focus–Understand customer needs and strive to meet or exceed their requirements.
Leadership–Establish a unified purpose and direction, and create an environment where employees are engaged in achieving the companies quality objectives.
Employee engagement–Empower and enhance employee competence to help those at all levels to become involved in achieving the quality objectives.
Process approach–Understand how interrelated processes combine and affect each other in order to optimize the system.
Continual improvement–Instill the idea of continual improvement in all aspects of company operation, in order to react to changes in external and internal conditions, and create new opportunities.
Evidence based decision making–Facts, evidence and data analysis provide increased objectivity and confidence in decision making.
Relationship management–Suppliers, customers, employees, investors and society as a whole influence performance. Therefore, relationships between these groups need to be overseen.
The purpose of ISO 9000 family is to assist organizations of all types and sizes to develop an effective quality management system(Burke and Silvestrini 2017).
This family of standards consists of:
ISO 9000: This document provides fundamentals and vocabulary for describing Quality Management Systems. It provides consistent wording that can be understood by all interested in ISO 9000. It discusses the component concepts and principles.
ISO 9001: Information in this document is used in contracts between supplier and customer companies and is often referred to as external quality assurance. It provides guidelines, that when followed, will provide a purchaser confidence that the supplier’s quality system is capable producing the stated quality requirements. It is comprehensive and covers Design/development, production, installation, and servicing.
ISO 9002: This is essentially a subset of ISO 9001 dealing with production and installation. It can be used in contracts with purchasers that do not require standards as stringent as those in ISO 9001.
ISO 9003: This is the least stringent subset of ISO 9001 dealing only with final inspection and test.
ISO 9004: This document is a guide to organizations in quality management an is often referred to as internal quality assurance. It provides guidelines for all technical administrative and human factors affecting the quality of products or services at all stages from design to customer satisfaction. It suggests ways, beyond the ISO 9001 requirements, to improve organizational performance and customer satisfaction. ISO 9004 are guidelines as opposed to the requirements in ISO 9001–9003. If a company wants to upgrade to a more powerful quality management system, they can begin to selectively apply ISO 9004 guidelines.
ISO first completed the international standards ISO 9000–9004 in 1987. The American National Standards Institute (ANSI) and the American Society for Quality (ASQ) developed ANSI/ASQ Q9000-Q9004. They are technically equivalent to the ISO 9000-9004 with the incorporation of American English usage and spelling to help US companies comply with the requirements. The ISO standards are reviewed and revised if necessary every five years the latest being ISO 9000:2015.
Many organizations become certified as ISO 9001 compliant. ISO 9001 is the only document in the ISO 9000 family for which an organization can be certified. To become certified, an independent certification organization must audit a company to ensure that its processes are in line with ISO requirements.
Figure 8.2 illustrates the major steps in the ISO 9001:2015 certification-registration process. In the initial step the company or organization seeking to be registered interviews several potential registrars and selects one. The second step involves filling out the questionnaire and associated paperwork provided by the registrar. The next step is to sign a contract with the registrar and confirm the schedule. Next a first stage assessment provides the opportunity to identify areas of non-compliance early on. In the document review, the registrar compares the companies quality manual to the ISO 9001 stated procedures and requirements. In the certification assessment, the registrar observes the companies processes to make sure the policies and procedures in the quality manual are being followed. If in the reviews, there are major non-compliances, the company has time to make corrective action before the registration process is complete.
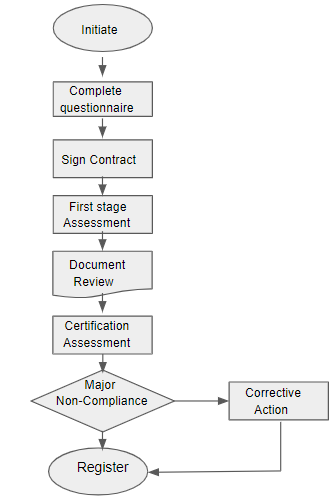
Figure 8.2 Flowchart of ISO 9001 Registration Process
How long it takes a company to become certified depends upon how much the company already practices ISO 9001 principles. It could take anywhere from 6 months to 18 months to become certified.
Some of the potential benefits of ISO 9000 certification are:
Increased business efficiency
Higher customer satisfaction
Lower unnecessary costs
More reliable quality of processes and products
New customer opportunities.
New customer opportunities arise in various ways. The EC/EFTA (European Commission and Europe Free Trade Association) either requires or strongly encourages ISO 9000 certification. Therefore ISO 9000 certification opens this marketplace to registered companies. In the US, the Food and Drug Administration Center for Medical Devices and Radiological Health replaced their Good Manufacturing Practice Guidelines by ISO 9000. The US Department of Defense has also adopted the equivalent ANSI/ASQ Q9000. However, most companies are driven to seek ISO 9000 certification more by contract negotiations than by requirements. For example, a company involed in EFTA trade may be required to seek ISO 9000 certification. They in-turn may require all their suppliers (through contracts) to also seek ISO 9000 certification as well. Thus, supply chain management practices also limit potential suppliers to be ISO registered companies.
8.2.2 Industry Specific Standards
Some industries have developed their own industry-specific standards that emulate ISO 9000. For the Aerospace industry there is AS 9100, QS9000 for the automotive industry, and TL 9000 for the telecommunications industry. QS9000 was later revised by the International Automotive Task Force as IATF 1649:2016. It is intended to be used in conjunction with ISO 9001:2015 to define requirements for automotive products(Burke and Silvestrini 2017).
There have been some criticisms of ISO 9000 and the industry-specific standards in the past. Montgomery(Montgomery 2013) stated that certification audits focused too much on documentation of policies and not enough on verifying the perceived benefits 1–4 in the list shown in the last section. He cites the nearly 300 deaths caused by catastrophic failures of Brigestone/Firestone tires resulting in rollover accidents of Ford Explorer vehicles. The Brigestone/Firestone plant was QS9000 certified, yet the accidents led to a recall over 6.5 million tires. However, with the 5 year revision cycle for The ISO standards, changes are made in response to valid critique and problems like this are less likely to occur in the future.
8.2.3 Malcolm Baldrige National Quality Award Criteria
In 1987, by an act of the US congress, the Malcolm Baldrdge National Quality Award (MBNQA) was established. This award was patterned after the Deming Prize in Japan. The purpose of the award was to recognize quality achievement in individual companies, to share successful quality strategies, and to promote awareness among US businesses. The award was named after the late Secretary of Commerce Malcolm ‘Mac’ Baldrige who had supported creation of such an award as a way to improve US competitive position. His service as Secretary of Commerce was one of the longest in history and he was one of the most beloved and colorful in that position(Steeples 1993).
The Baldrige Award was more than a set of guidelines for a QMS. The purpose was to help the entire United States improve quality and productivity by the following actions(Steeples 1993):
Stimulating companies to attain excellence for the pride of achievement.
Recognizing outstanding companies to provide examples to others
Establishing guidelines that business, governmental, and other organizations can use to evaluate and improve their own quality efforts.
Providing information from winning companies on how to manage for superior quality.
The legislation that created the Baldridge award gave responsibility for it to the US Department of Commerce. The role of administering the award was turned over to The National Institute of Standards and Technology (NIST), an agency within the Department of Commerce. Figure 8.3 shows the award program organization.
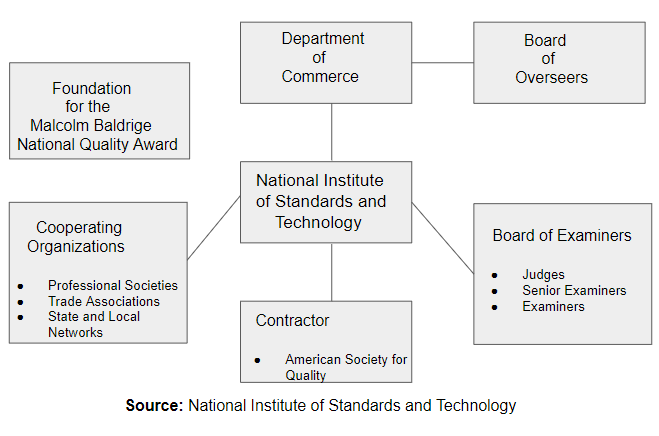
Figure 8.3 Malcolm Baldrige Quality Award Organization
The Board of overseers monitors the effectiveness of the Award. This board consists of at least five people who are renowned in the quality management field. They are appointed to the Board by the Secretary of Commerce. The Board also reviews the work of the contractor (American Society for Quality).
The Board of examiners consist of Judges, Senior Examiners, and Examiners. To become a Board member an application must be made, and selections are based on qualifications, experience, and recognition of expertise. Selections are made annually. Examiners do not represent any one professional group or company. They are selected from various fields such as manufacturing, service, academia, and trade associations. NIST appoints senior examiners, and the judges, from among the examiners. Each year the examiners are required to participate an a three day training program where the Award criteria and scoring system are reviewed with case studies.
The contractor (The American Society for Quality) participates in criteria development, publicity, administering the award ceremony, and organizing an annual Quest for Excellence Conference featuring Award winners.
The legislation that created the Award did not appropriate government funds for its operation. A strong public private partnership was envisioned for this purpose. The private sector showed its support by raising money, sharing quality information and volunteering. The Foundation for the Malcolm Baldrige National Quality Award was set up to create an endowment, that along with application fees supports the award program.
The Baldrige award(NIST 2020) was originally given in three categories, but over the past 31 years, that has expanded to the six categories shown below:
manufacturing
service
small business
education
health care
non-profit
A total of 18 awards can be given in any given year with no limit on the individual categories. However, in some past years no award has been given in some categories.
Steeples(Steeples 1993) explained that the Baldrige Award has become the standard for excellence in Quality Management. Award winners can be assured that they can deliver goods and services as well as the best organizations in the world. The QMS essentials are embodied in the Baldrige criteria:
Customers define quality
Senior company or organization leadership must create a clear quality values and build them in to normal operating procedures
Excellent quality evolves from well-designed and executed systems and processes
Continuous improvement must be integrated into all processes.
Organizations must develop goals and strategic operational plans to achieve quality leadership
Shortened response time for all operations and processes must be part of quality improvement efforts.
Operations and decisions of the organization must be based on facts
All employees must be appropriately trained, developed and involved in quality improvement efforts
Design quality and error prevention must be key elements
Organizations must communicate quality requirements to suppliers and work with them to elevate their efforts.
The Baldrige criteria for performance excellence is a structure that any organization can use to improve its overall performance(NIST 2020) . The assessment criteria consist of seven categories:
Leadership–examines how senior executives lead the organization and how the organization handles its responsibilities to the public and to the environment in which it is inserted.
Strategy–examines how an organization sets strategic directions and how it determines key plans of action.
Customers–examines how an organization determines requirements and expectations of customers and markets, how it builds relations with customers, and how it acquires, satisfies, and retains customers.
Measurement, analysis, and knowledge management–examines management, effective use, analysis and enhancement of data and information to provide support for key processes at the organization and for the organization’s performance management system.
Workforce–examines how an organization allows its workforce to develop their full potential and how the workforce is aligned with the organization’s objectives.
Operations–examines aspects of how key production/delivery and support processes are designed, managed, and enhanced.
Results–examines an organization’s performance and improvement in its main business areas: customer satisfaction, financial and market performance, human resources, performance of suppliers and partners, operational performance, governance, and social responsibility. This category also looks at an organization’s performance in relation to its competitors.
In each assessment criteria there are at least two items considered by the examiners (more details can be found at(NIST 2018). Points are awarded for each of the categories, but unlike early criticism of ISO 9001 requirements, a large portion of the points are awarded in the Results category. Paraphrasing Steeples(Steeples 1993): Leadership is the driver of the quality bus, strategy is the road map, measurement and knowledge management is the fuel, workforce is the engine, operations are the landmarks and results are the destination.
The MBNQA criteria are dynamic and just like the continuous improvement model that award applicants are encouraged to follow, the MBNQA Boards glean information from the Award program each year and incorporates the best ideas about assessment criteria, review processes, examiner training, and applicant eligibility requirements into the process to be used in the following year.
Although one of the intents of the Baldrige Award was to recognize companies for outstanding achievements in quality, many companies and organizations have sought to utilize the freely available Baldrige assessment criteria to improve without actually competing for an award. Companies doing this have found that they discover their own areas of competence which they can then exploit in the marketplace. They also find areas for improvement. Teamwork and better communication is fostered by self assessment and planing improvements. Finally senior management involvement and commitment is increased by the self assessment. This is because the stringent Baldrige criteria requires alignment of all quality management practices, whereas traditional management approaches have usually assigned responsibility for quality to company departments whose efforts were often hidden from top management(Steeples 1993).
For companies and organizations seeking examples of how to make improvements with regard to the Baldrige assessment criteria, the annual Quest for Excellence\(^®\) is the definitive showcase of best practices from Baldrige Award winners. There presentations are given on best practices and insights on how excellent performance was achieved, and a pre-conference workshop is held for beginner and intermediate users of the Baldrige Criteria for Performance Excellence.
Some may ask, is using the Baldrige assesment citeria really worth the the effort? In an article in 2011 (Bailey 2011) examined results from the five businesses that were two-time Baldrige Award winners. She found that over 6 years the median growth in sites was 67%, the median growth in revenues was 93%, and the median growth in jobs was 63%. Impressive results!
8.3 Six-Sigma Initiatives
8.3.1 Brief Introduction to Six Sigma
Many new QMSs have been introduced in recent decades. Of those the Six Sigma initiative appears as a breakthrough. Using Six Sigma allows a company to consistently meet customer expectations or requirements, therefore according to ISO it speaks the language of business(Cano, Mogguerza, and Redchuck 2012).
Madrigal(Madrigal 2020) lists the Six-Sigma Building Block Definitions as:
Unit: The item produced, purchased, or experienced.
Defect: An even that does not meet a customer specification
Defective: A unit with one or more defects
Defect Opportunity: A measurable chance for a defect to occur
DPMO: Defects per million opportunities
Process Yield: Proportion of non-defective units produced by the process
Process Sigma: An expression of process yield based on the number of defects per million opportunities
One minus the Process Yield, or proportion outside the specification limits, is illustrated in Figure 8.4 and Table 8.1.

Figure 8.4 Motorola Six Sigma Concept
Table 8.1 Motorola Six Sigma % and ppm out of Spec
| Spec Limit | % outside specs | ppm Defective |
|---|---|---|
| \(\pm 1\sigma\) | 69.77 | 697,700 |
| \(\pm 2\sigma\) | 30.87 | 308,700 |
| \(\pm 3\sigma\) | 6.68 | 66,810 |
| \(\pm 4\sigma\) | 0.621 | 6,210 |
| \(\pm 5\sigma\) | 0.0233 | 233 |
| \(\pm 6\sigma\) | 0.00034 | 3.4 |
If the process is centered within the specification limits with a \(C_p=2.0\), then the closest a specification limit will be to the process mean is \(6\sigma\) or six process standard deviations. With no shift in the mean, the proportion above the upper specification limit or below the lower specification limit will be pnorm(-6)=9.865876e-10. If the mean shifts 1.5 standard deviations to the left, the proportion below the lower specification limit will be pnorm(-4.5)=3.397673e-06, and the proportion above the upper specification limit will be 1-pnorm(7.5)=3.18634e-14, thus the total proportion out of specification limits would be \(\verb!3.397673e-6+3.18634e-14=3.397673e-06!\).
By symmetry, if the process mean shifts to the right 1.5 standard deviations the proportion outside the specification limits would be the same, i.e., 3.397673e-06=.00034 or 3.4 ppm.
If a company can reduce the process standard deviation to be 1/12 of the difference between the customer desired upper and lower specification limits, and prevent the process mean from changing by more that 1.5 standard deviations they will be able to meet the customer expectation consistently. Based on this fact a description of Six Sigma consistent with its developers is: “An effective application of statistical techniques, delivered in an innovative manner that has achieved acceptance, use, and results by the management of many organizations”(Kiefsjo, Wiklund, and Edgeman 2001).
In order to improve quality by reducing variability the Six Sigma method utilizes what is called the DMAIC process (Define, Measure, Analyze, Improve, and Control) which is a way of looking at the scientific method in a way that is clear to managers and employees. To facilitate the use of the DMAIC process, the roles of all employees and managers within the organization are defined using a comparison to the roles of students and instructors within a martial arts school.
8.3.2 Organizational Structure of a Six Sigma Organization
Continuous improvement, in a Six Sigma organization, is accomplished on a project by project basis. The organization of a Six Sigma organization expedites the selection and completion of the projects that will lead to the greatest improvements. Figure 8.5 shows the structure of a Six Sigma organization(Snee and Hoerl 2005).
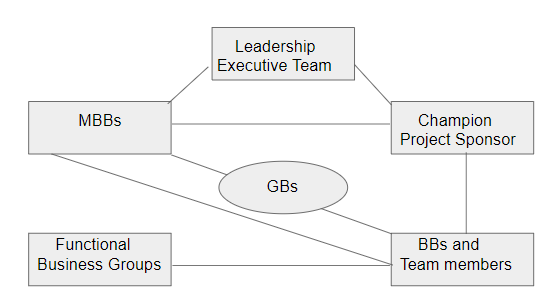
Figure 8.5 Six Sigma Organization
In this figure the Leadership Executive Team is the executive and his or her direct staff that is responsible for business unit. This team has the overall responsibility for approving and providing resources to the improvement projects undertaken. The Champion or Project Sponsor is a business leader who identifies areas for possible improvement and brings them to the attention of the Leadership Executive Team. A Black Belt (BB) and team members will undertake work on an approved project. Black Belts are experienced in the Six Sigma tools and train and direct their team members to complete project work. Black Belts typically work with more than one team and one project at any time. The team members are selected from among the Green Belts (GBs) who have less training and expertise in the use of Six Sigma tools but are from cross functional areas and together have knowledge in all aspects of the process under study. Green Belts normally work full time in the process and are selected to be part of a temporary team to solve particular problems. The Master Black Belts (MBBs) are experts in the use of the Six Sigma tools and problem solving. Their job is to help Project Sponsors identify potential projects and train Black Belts and Green Belts in the use of Six Sigma methodology. This is a full time job.
8.3.3 The DMAIC Process and Six Sigma Tools
Improvement projects are completed in a Six Sigma organization using the DMAIC process. The steps in the DMAIC process, as steps in the PDCA cycle, are similar to the steps in the scientific method. Figure 8.6 represents the steps in the DMAIC process.
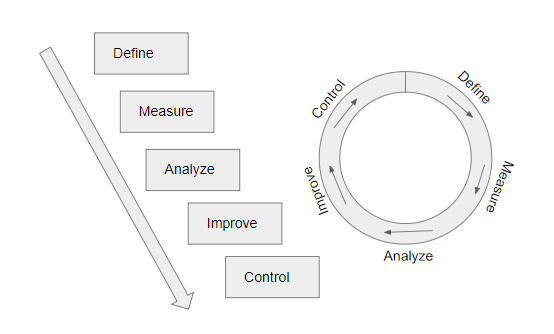
Figure 8.6 DMAIC Process
Sometimes an improvement project may be completed in one cycle of the DMAIC process, as depicted on the left side of Figure 8.6. In other cases it may take several cycles to complete a project, as represented on the right side of Figure 8.6. Occasionally, the completion of one project naturally leads to the beginning of another project. In that situation, the DMAIC process is again used repeatedly to complete more than one project.
8.3.4 Tools Used in the DMAIC Process
The tools, used at each step use of the DMAIC process on improvement projects, clarify the relevance of this process to business managers.
8.3.5 DMAIC Process Steps
Define: The purpose of the Define step is to identify a problem or opportunity for improvement. The goal of this step is to provide the evidence needed reach a consensus decision on whether this project should go forward. In this step, a Project Charter is developed. This charter is like a contract between the project team and the project sponsor or champion. It should specify the goal of the project, the budget and timeline for completing the project, and expected deliverables in terms of:
customer satisfaction
Profits
Employee involvement etc.
Some additional tools described in this book that are useful at this step are:
SIPOC Diagram–Chapter 4
Flowchart–Chapter 4, etc.
Measure: The purpose of this step is to quantify what is currently happening in the process and identify how it has changed or remained constant over time. It necessarily involves a data collection plan. The goal is to develop baseline information that will be later compared to the improved results that will occur. Benchmarking is a good way to quantify current process results and identify areas for improvement at the same time. Benchmarking consists of comparing process results to the results of other processes in other areas of the company, or within trusted customer or supplier companies. This practice may reveal gaps between current process results to what may be possible. Other tools described in this book that are useful at this step are:
Phase I control charts–Chapter 4 and 7
Histograms and Process Capability Studies–Chapter 4
Line graphs–Chapter 4
Acceptance Sampling Plans–Chapters 2 and 3
Analyze: The purpose of this step is to discover root causes and their effect, then to prioritize opportunities for improvement. Tools described in this book that are useful at this step are:
Flowcharts–Chapter 4
Brainstorming, Cause and Effect Diagram and Ask Why?–Chapter 4
Pareto charts–Chapter 4
PDCA–Chapter 4
Design and Analysis of Experiments and Hypothesis Testing–Chapter 5
Improve: The purpose of this step is to review the results of the Analyze step and identify the best ideas to improve the process. Next these ideas should be implemented in the process and their effectiveness evaluated. Some tools described in this book that are useful at this step are:
Analysis of data from designed experiments, confirmation experiments, and ranking effects–Chapter 5
PDCA–Chapter 4
Phase II Control Chart appended to Phase I Chart with Phase I limits–Chapter 4
Control: The purpose of this step is to sustain the potential gains identified in the Analyze step. Ensure that the potential solution identified in the previous step is embedded in the process. Mistake proofing or Poka-yoke should be used to prevent previous errors. Some additional tools described in this book that are useful at this step are:
Robust Design Experiments–Chapter 5
Phase II monitoring with control charts–Chapters 6 and 7
Use of OCAP–Chapter 4
8.3.6 History and Results Achieved by the Six Sigma Initiative
Mikel Harry, who is considered the “Godfather” of the Six Sigma initiative introduced the idea in the mid 1980’s at Motorola. Motorola formally launched a Six Sigma Program in 1987(Cano, Mogguerza, and Corcoba 2015). Motorola had set an ambitious goal of of improving all products (goods as well as services) tenfold within 5 years. The Six Sigma program allowed Motorola to focus all resources on reducing variation in both manufacturing processes and administrative processes. The results of this effort came quickly. From 1987 to 1997 Motorola achieved a fivefold growth in sales, and profits grew nearly 20%. Cumulative savings were $US14 billion and stock prices grew at an annual rate of 21.3 percent(Kiefsjo, Wiklund, and Edgeman 2001).
In 1988 Motorola corporation won the Baldrige Award in the manufacturing category. As part of the Baldrige tradition of providing information about how they managed for quality, Motorola prepared an informational package describing their Six Sigma program(Mitra 1998). Motorola joined forces with companies like IBM, ABB, Texas Instruments, Allied Signal, and Kodak to found the “Six Sigma Research Institute”.
Six Sigma achieved high success in the General Electric company in the 1990s. They applied it in nearly 30 service businesses (non-manufacturing). General Electric saved $1billion over a two-year period, and much of the current popularity of Six Sigma is due to promotion by the former GE CEO Jack Welch(Madrigal 2020). Other companies soon began to use the Six Sigma approach. AlliedSignal obtained savings of $2billion over a five-year span, and other well known examples of Six Sigma companies include ABB, Lockeed Martin, Poloroid, Sony, Honda, American Express, Ford, Lear Corporation and Solectron(Kiefsjo, Wiklund, and Edgeman 2001).
8.3.7 Six Sigma Black Belt Certification
Just as companies benefit from using Six Sigma methodology for managing their business and seeking continuous improvement, individuals also benefit when they gain knowledge and experience in the use of the Six Sigma method. Requirements for some entry level positions in companies applying Six Sigma methodology include certification as a Six Sigma Green Belt.
Many organizations issue certificates or certifications for Six Sigma Green Belts, and Six Sigma Black Belts. These organizations fall into the categories of professional societies, universities, companies, and online education for profit organizations. Companies may provide training to their own employees and issue a certificate of completion. However, the two most respected certifications are from The American Society for Quality (ASQ) and the International Association for Six Sigma Certification (IASSC). Of these, the ASQ certifications are considered the Gold Standard and are most respected by employers.
Applicants for ASQ certification are required to take a comprehensive exam over the published “Body of Knowledge”. In addition applicants for Green Belt certification must have 3 years of job experience working on teams using methods described in the ASQ Six Sigma Green Belt Body of Knowledge. Applicants for the Six Sigma Black Belt certification must have led two successful improvement projects teams using the DMAIC process, in addition to passing a written exam. The proof of having led successful projects must be given in the form of signed affidavits from the project sponsor or champion.
Other online certification bodies do not require work experience, but require completion of a course and or an exam. ASQ also offers a Quality Process Analyst certification (CQPA), that does not require job experience but at least two years of college and passing an exam. The exam for this certification is as rigorous as the Black Belt exams given by some online certification bodies, and with it students obtain a certification before graduation. This greatly increases their employment opportunities after graduation(Jacobsen 2009). Once working and having experience leading project teams CQPA’s usually have no problem in passing the ASQ Six Sigma Black Belt Exam.
The benefits to individuals who become certified in areas of Six Sigma methodology include:
Improved capabilities as a leader
Knowledge applicable across many industries
Increased earnings.
The increased earnings of certified individuals is well documented, and ASQ publishes and annual salary survey in the Quality Progress magazine. Six Sigma Black Belts may earn 160% of their uncertified counterparts doing comparable jobs.
8.4 Additional Reading
A step beyond Six-Sigma is the idea of Lean Six Sigma. This is a strategy that incorporates the collaborative teamwork and the DMAIC process from the Six-Sigma initiative with the ideas of lean manufacturing. The purpose is to reduce waste at the same time as reducing variability and improving customer satisfaction. Waste, as described by Fujio Cho of Toyota, is anything other than the minimum amount of equipment, materials, parts, space, and workers time, which are absolutely essential to add value to the product(Summers 2011).
The eight common types of waste are: Rework, Over Processing, Over Production, Transportation, Waiting, Excess Inventory, and Wasted Motion(Madrigal 2010). Lean Six Sigma is an organized approach to eliminate these wastes. Although Six Sigma and Lean are different, they have many similarities and work well together. Over 350 Fortune 500 Companies use Lean Six Sigma and typical annual savings is on the order of $500 million[Madrigal (2010).
Books by George, Rowlands and Kastle (George, Rowlands, and Kastle 2003), Summers and Morgan(Summers 2011), and Brenig-Jones(Morgan and Brenig-Jones 2015) provide more in-depth information about Lean Six Sigma.
8.5 Summary
During World War II, the use of statistical methods, such as acceptance sampling and statistical process control in US defense contractor plants, were very effective in improving quality, increasing productivity and reducing costs. The use of these techniques was mandated by the US Department of Defense. When the war ended and companies returned to producing goods for civilian use, there was no mandate to use these statistical methods and they fell into disuse.
Quality gurus such as Deming, Juran and Feigenbaum argued that use of these statistical methods methods made good business sense, and that top management needed to be involved to bolster and support their use. When many US companies lost markets and market share during the 1980s top business executives became interested and the idea of Quality Management Systems (QMS) emerged. The idea was that through proper leadership, customer focus, continual improvement using a process approach, employee involvement, and fact based decision making would lead to higher customer satisfaction and business success.
By 1980s, national and international guidelines for effective QMSs appeared and ISO began certifying organizations that were deemed compliant to the ISO 9001 requirements for a QMS. In the US, the Baldrige Award criteria went a step further in creating a competition among organizations in following the Baldrige requirements. The purpose was to stimulate improvements in quality and productivity among US organizations. Award winners shared their strategies and very impressive results have been documented.
One Baldrige Award winner, Motorola Corporation, introduced the Six Sigma approach. This approach included an innovative way of including statistical methods in a project-by-project improvement strategy that has achieved world wide acceptance by top company executives. The use of this approach has yielded enormous results in customer satisfaction and business success by the organizations who use it.
The Six Sigma approach is compatible with the ISO 9000 requirements and the Baldrige Award criteria. Due to the organizational structure of a Six Sigma company and the techniques used in the DMAIC process, the use of the statistical tools advocated by Deming and described in this book are guaranteed.
Many institutions certify individuals as Six Sigma Black Belts and Six Sigma Green Belts, and this opens job opportunities and higher salaries to those certified. However, most of the Six Sigma certification exams for individuals focus on multiple choice concept questions and the ability to demonstrate the use of hand calculations and table look ups for applying statistical techniques. Despite the advances in the use of computers and results from recent research, students who want to take certification exams will have to be familiar with these hand calculations and table look ups. The American Society for Quality publishes certification handbooks and sample exam questions to help in preparation for the exams.
The use of computers, and results of recent research, can enable dramatic increases in the efficiency of Statistical Quality Control methods over what was possible in 1950. In Chapters 2 and 3, it has been shown that the use of the computer makes it quick and easy to develop OC curves and average sample size curves that are useful in comparing different acceptance sampling plans. Understanding how to develop and interpret these curves can greatly clarify the differences in various proposed sampling plans. In addition, programs have been written that allow quick access to published sampling schemes that are normally used in domestic and international trade.
The use of the computer greatly reduces the time involved to iteratively develop Shewhart control charts with Phase I data. Other simple computer displays of data, such as Pareto Diagrams and Scatter plots etc., greatly help in determining the assignable causes for out-of-control conditions that may appear on Phase I control charts. More sophisticated statistical tools such as PDCA and designed experiments can detect assignable causes that may not be obvious with observational data.
More recently developed time-weighted control charts such as the Cusum and EWMA charts and multivariate control charts, can greatly reduce the expected time to detect out-of-control signals in Phase II monitoring of process data. In addition, they can reduce the chance of falsely concluding an assignable cause is present when there is none. This can eliminate wasted time looking for non-existent problems.
This book has emphasized the use of the public domain program R for SPC and Acceptance Sampling calculations. This open source software is quickly gaining international acceptance for this purpose. Students who learn to use this tool, will be able to make immediate contributions in the job market where there is a strong demand for Quality Analysts and Quality Engineers.
References
Bailey, D. 2011. “The Verdict Is in – Baldrige Is About Revenue and Jobs.” https://www.nist.gov/blogs/blogrige/verdict-baldrige-about-revenue-and-jobs.
Brocka, B., and M. S. Brocka. 1992. Quality Management-Implementing the Best Ideas of the Masters. Homewood, Ill.: Business One Irwin.
Burke, S. E., and R. T. Silvestrini. 2017. The Certified Quality Engineer Handbook 4th Ed. Milwaukee, Wisconsin: ASQ Quality Press.
Cano, E. L., J. M. Mogguerza, and M. P. Corcoba. 2015. Quality Control with R - an ISO Standards Approach. New York, N.Y: Springer.
Cano, E. L., J. M. Mogguerza, and A. Redchuck. 2012. Six Sigma with R - Statistical Engineering for Process Improvement. New York, N.Y: Springer.
Feigenbaum, A. V. 1956. “Total Quality Control.” Harvard Business Review Nov.-Dec.: 94–98.
Feigenbaum, A. 1961. Total Quality Control. New York, N.Y: McGraw-Hill.
George, M., D. Rowlands, and B. Kastle. 2003. What Is Lean Six Sigma? New York, N.Y.: McGraw-Hill Education.
Jacobsen, J. 2009. “Competitive Edge for New Grads.” https://lawsonjsl7.netlify.app/CQPAedgeforGrads.pdf.
Juran, J. 1951. Quality Control Handbook. New York, N.Y: McGraw-Hill.
Kiefsjo, B., H. Wiklund, and R. L. Edgeman. 2001. “Six Sigma Seen as a Methodology for Total Quality Management.” Measuring Business Excellence 5 (1): 31–35.
Madrigal, J. L. 2010. “The Power of Lean/Six Sigma: How to Leverage It?” Oxford Worldwide Group; Lecture Notes.
Madrigal, J. 2020. “Six Sigma Overview.” Oxford Worldwide Group; Lecture Notes.
Mitra, A. 1998. Fundamentals of Quality Control and Improvement. Upper Saddle River, New Jersey: Prentice Hall.
Montgomery, D. C. 2013. Introduction to Statistical Quality Control. 7th ed. Hoboken, New Jersey: John Wiley & Sons.
Morgan, J., and M. Brenig-Jones. 2015. What Is Lean Six Sigma? New York, N.Y.: John Wiley & Sons.
NIST. 2018. “Baldrige Excellence Builder.” https://www.nist.gov/system/files/documents/2017/02/09/2017-2018-baldrige-excellence-builder.pdf.
NIST. 2020. “Baldrige Performance Excellence Program.” https://www.nist.gov/baldrige/publications/baldrige-excellence-framework.
Snee, R. D., and R. W. Hoerl. 2005. Six Sigma Beyond the Factory Floor. Upper Saddle River N. J.: Pearson Prentice Hall.
Steeples, M. M. 1993. The Corporate Guide to the Malcolm Baldridge National Quality Award-Proven Strategies for Building Quality into Your Organization. 2nd ed. Milwaukee WI, & Homewood IL: ASQ Qulity Press & Business One Irwin.
Summers, D. 2011. Lean Six Sigma: Process Improvement Tools and Techniques. Upper Saddle River, N. J.: Prentice Hall.