Capítulo 6 Análisis Cluster
6.1 Marco Téorico
El análisis cluster es una técnica diseñada para clasificar tantas observaciones en grupos de tal forma que:
Cada grupo (conglomerado o cluster) sea homogéneo respecto a las variables utilizadas para caracterizarlos; es decir, que cada observación contenida en él sea parecida a todas las que estén incluidas en ese grupo. (principio de cohesión).
Que los grupos sean lo más distintos posible unos de otros respecto a las variables consideradas. (principio de separación).
6.2 Ejemplos
# Otras opciones
options(scipen = 999)    # Eliminar la notación científica
options(digits = 3)      # Número de decimales

# Paquetes
library(pacman)
p_load(cluster, aplpack, fpc, foreign, TeachingDemos,
       factoextra, NbClust, ape, corrplot, DataExplorer,
       funModeling, compareGroups, tidyverse, dendextend,
       igraph, FeatureImpCluster, flexclust, LICORS, h2o,
       gghighlight)
Este ejemplo fue basado en Gondar
Gondar, Emilio. Data Mining Institute
Ingreso de Datos
La información que se recolectó de un grupo de 21 personas (usando una escala de Likert del 1 al 7, donde 1 es desacuerdo y 7 de acuerdo), fue su grado de conformidad a las siguientes afirmaciones:
Salir de compras es divertido
Salir de compras afecta el presupuesto
Al salir de compras aprovecho de comer fuera
Al salir a comprar trato de hacer las mejores
No me importa salir de compras
Al salir de compra voy a ahorrar si comparo precios
library(foreign)
datosc <- read.spss("compras-cluster.sav",
                    use.value.labels = TRUE,
                    max.value.labels = TRUE,
                    to.data.frame = TRUE)
str(datosc)
'data.frame': 21 obs. of 7 variables:
$ caso : chr "1 " "2 " "3 " "4 " ...
$ divertid: num 6 2 7 4 1 6 5 7 2 3 ...
$ presupu : num 4 3 2 6 3 4 3 3 4 3 ...
$ aprovech: num 7 1 6 4 2 6 6 7 3 3 ...
$ buenacom: num 3 4 4 5 2 3 3 4 3 6 ...
$ noimport: num 2 5 1 3 6 3 3 1 6 4 ...
$ ahorro : num 3 4 3 6 4 4 4 4 3 6 ...
- attr(*, "variable.labels")= Named chr [1:7] "" "Divertido" "Presupuesto" "Aprovecho" ...
..- attr(*, "names")= chr [1:7] "caso" "divertid" "presupu" "aprovech" ...
- attr(*, "codepage")= int 1252attr(datosc, "variable.labels") <- NULL
datosc$caso <- NULL
str(datosc)'data.frame': 21 obs. of 6 variables:
$ divertid: num 6 2 7 4 1 6 5 7 2 3 ...
$ presupu : num 4 3 2 6 3 4 3 3 4 3 ...
$ aprovech: num 7 1 6 4 2 6 6 7 3 3 ...
$ buenacom: num 3 4 4 5 2 3 3 4 3 6 ...
$ noimport: num 2 5 1 3 6 3 3 1 6 4 ...
$ ahorro : num 3 4 3 6 4 4 4 4 3 6 ...
- attr(*, "codepage")= int 1252Análisis Exploratorio
summary(datosc) divertid presupu aprovech buenacom noimport
Min. :1.0 Min. :2 Min. :1.00 Min. :2.0 Min. :1.00
1st Qu.:2.0 1st Qu.:3 1st Qu.:2.00 1st Qu.:3.0 1st Qu.:2.00
Median :4.0 Median :4 Median :4.00 Median :4.0 Median :3.00
Mean :3.9 Mean :4 Mean :4.05 Mean :4.1 Mean :3.43
3rd Qu.:5.0 3rd Qu.:5 3rd Qu.:6.00 3rd Qu.:5.0 3rd Qu.:4.00
Max. :7.0 Max. :7 Max. :7.00 Max. :7.0 Max. :7.00
ahorro
Min. :2.00
1st Qu.:3.00
Median :4.00
Mean :4.38
3rd Qu.:5.00
Max. :7.00 # Estructura de los datos
plot_str(datosc)
# Detectando y graficando los % de datos perdidos
plot_missing(datosc, ggtheme = theme_bw()) 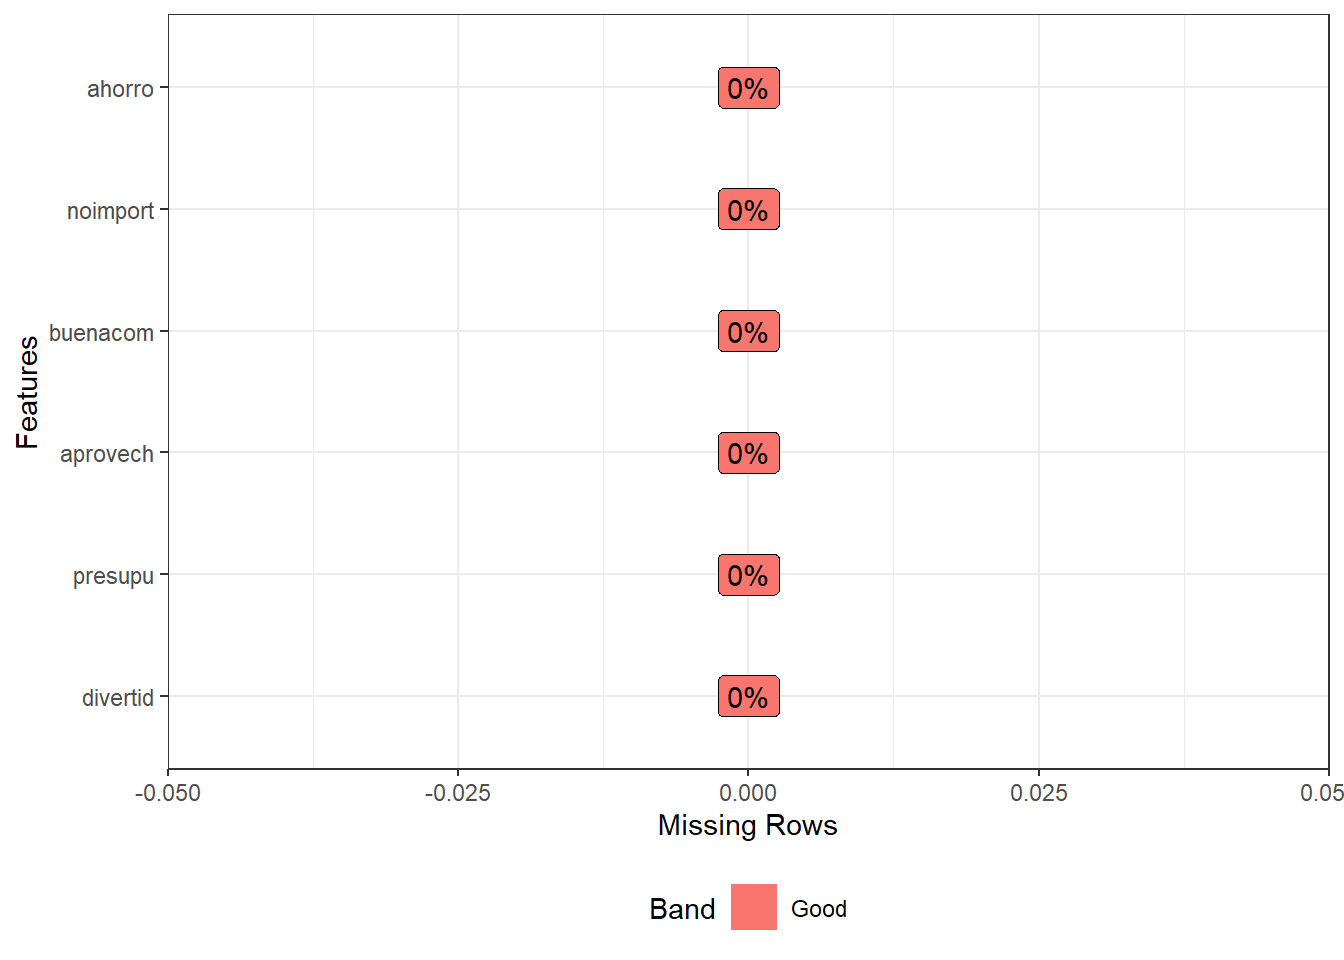
# Histograma para las variables numéricas
plot_histogram(datosc)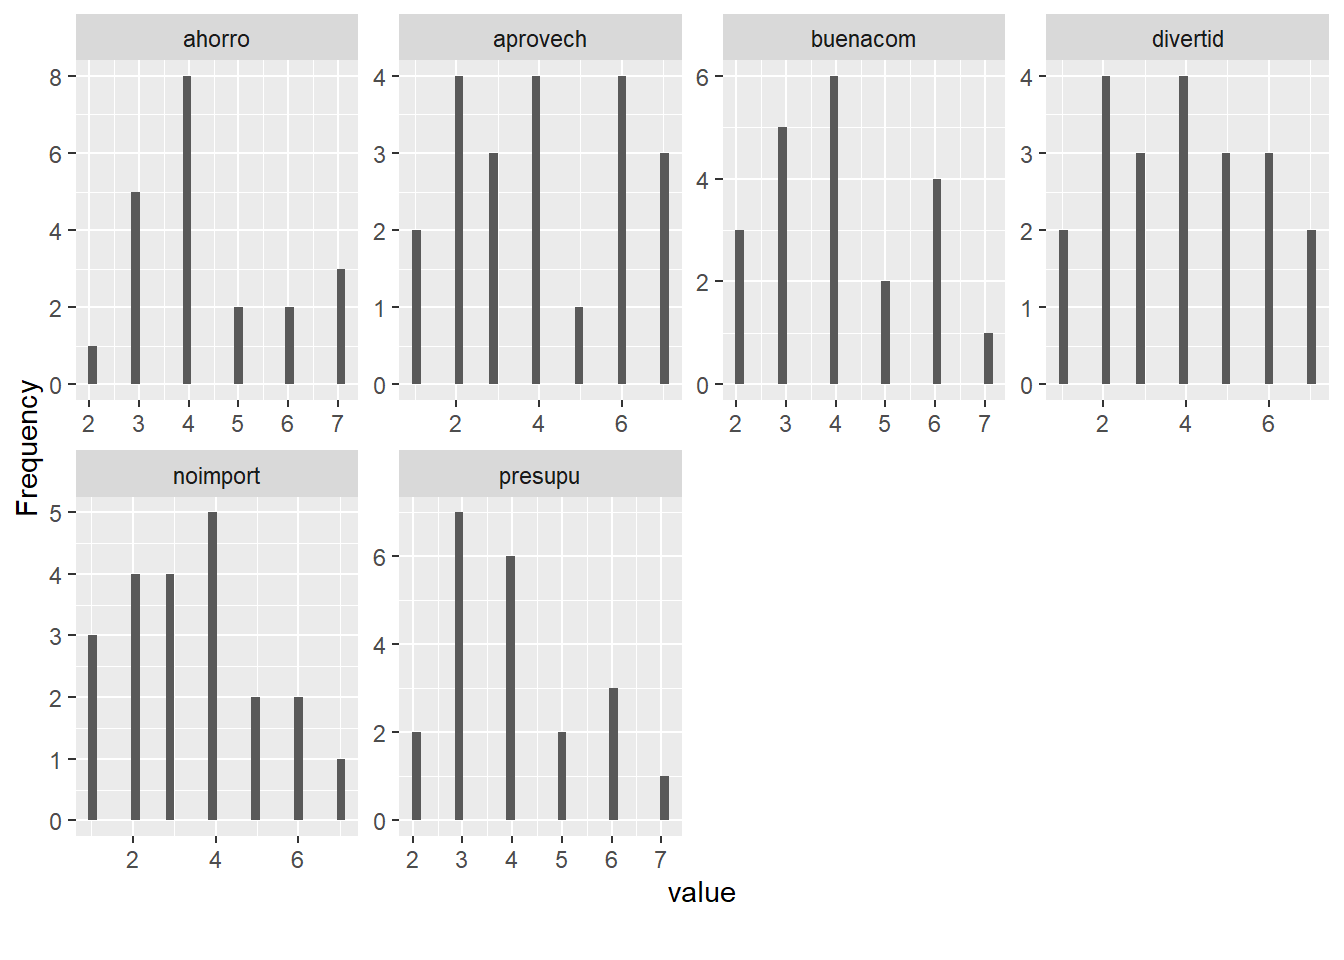
# Probando mas gráficos
plot_density(datosc)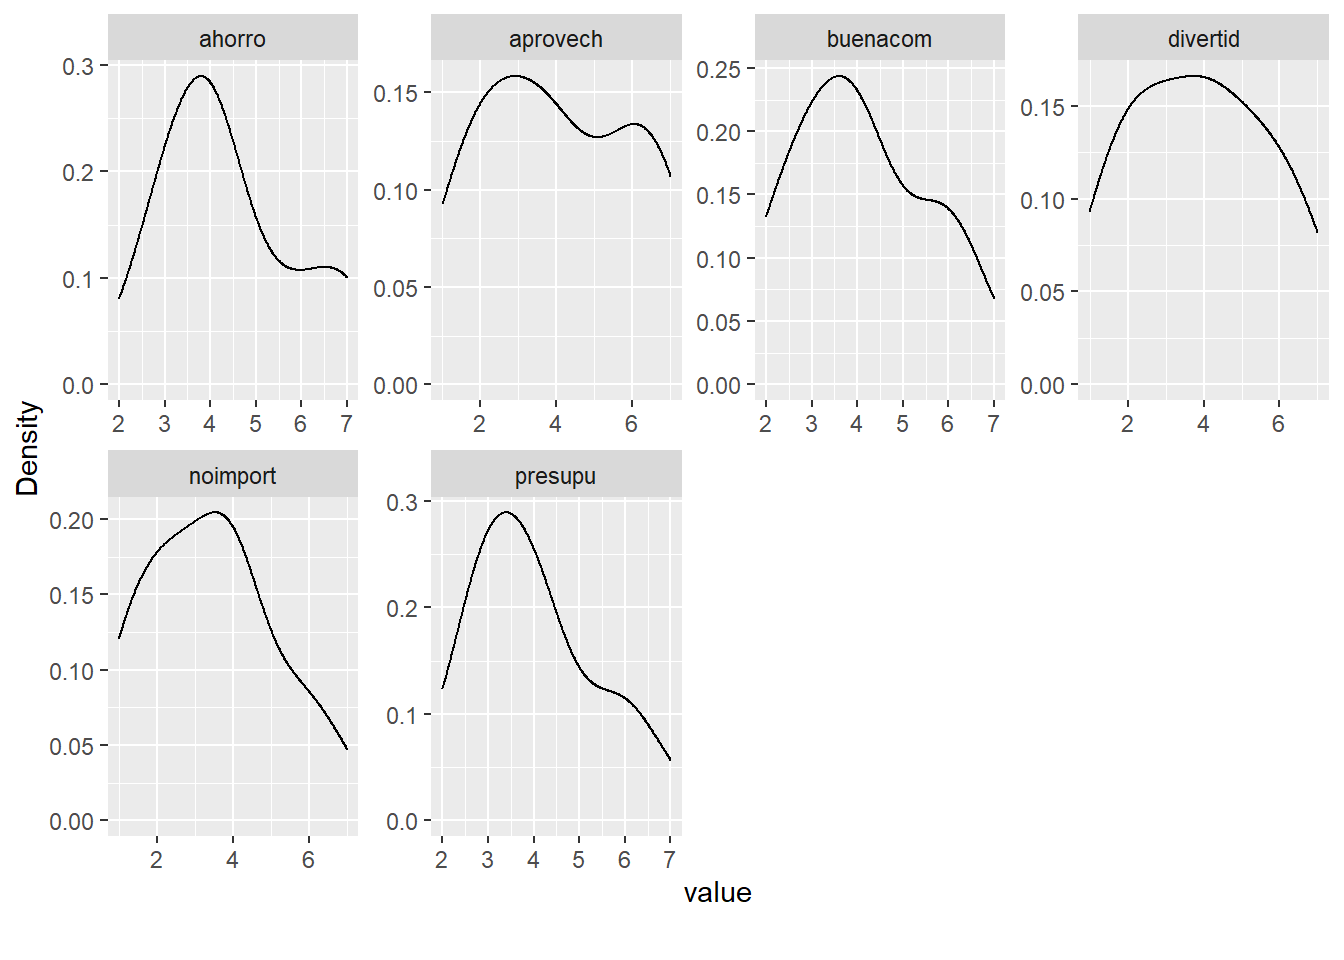
Con la librería funModeling
library(funModeling)

# Descripción de los datos
df_status(datosc)
variable q_zeros p_zeros q_na p_na q_inf p_inf type unique
1 divertid 0 0 0 0 0 0 numeric 7
2 presupu 0 0 0 0 0 0 numeric 6
3 aprovech 0 0 0 0 0 0 numeric 7
4 buenacom 0 0 0 0 0 0 numeric 6
5 noimport 0 0 0 0 0 0 numeric 7
6 ahorro 0 0 0 0 0 0 numeric 6# Gráfico de variables numéricas
plot_num(datosc)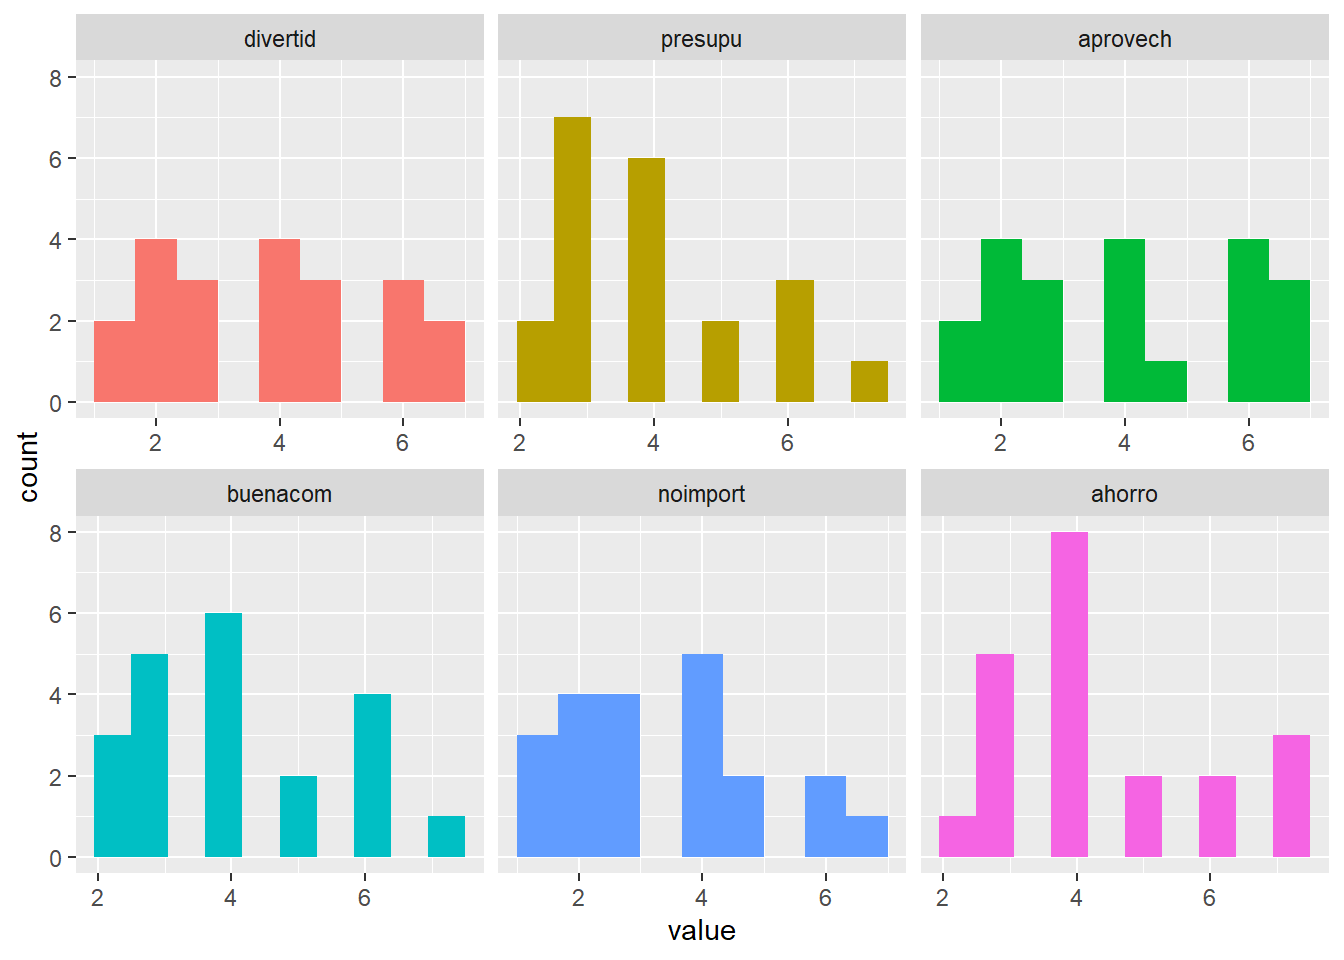
# Descripción de las variables numéricas
profiling_num(datosc)
variable mean std_dev variation_coef p_01 p_05 p_25 p_50 p_75 p_95 p_99
1 divertid 3.90 1.87 0.478 1.0 1 2 4 5 7 7.0
2 presupu 4.00 1.38 0.345 2.0 2 3 4 5 6 6.8
3 aprovech 4.05 2.01 0.497 1.0 1 2 4 6 7 7.0
4 buenacom 4.10 1.48 0.361 2.0 2 3 4 5 6 6.8
5 noimport 3.43 1.72 0.502 1.0 1 2 3 4 6 6.8
6 ahorro 4.38 1.47 0.335 2.2 3 3 4 5 7 7.0
skewness kurtosis iqr range_98 range_80
1 0.0940 1.91 3 [1, 7] [2, 6]
2 0.5869 2.47 2 [2, 6.8] [3, 6]
3 0.0845 1.71 4 [1, 7] [2, 7]
4 0.3076 2.08 2 [2, 6.8] [2, 6]
5 0.3356 2.31 2 [1, 6.8] [1, 6]
6 0.5820 2.34 2 [2.2, 7] [3, 7]Usando Medidas de Distancia
Para estandarizar los datos (center y scale)
datos.e <- as.data.frame(scale(datosc))
str(datos.e)
'data.frame': 21 obs. of 6 variables:
$ divertid: num 1.121 -1.02 1.657 0.051 -1.555 ...
$ presupu : num 0 -0.725 -1.451 1.451 -0.725 ...
$ aprovech: num 1.4675 -1.5148 0.9704 -0.0237 -1.0178 ...
$ buenacom: num -0.74 -0.0643 -0.0643 0.6113 -1.4157 ...
$ noimport: num -0.831 0.914 -1.412 -0.249 1.495 ...
$ ahorro : num -0.942 -0.26 -0.942 1.105 -0.26 ...# En este caso no se necesita estandarizar# 1.a Calculando la matriz de distancia euclidiana con la función dist()
dist.eucl <- dist(datosc, method = "euclidean")
# Visualizando un subconjunto de la matriz de distancia
# Los 6 primeros registros
round(as.matrix(dist.eucl)[1:6, 1:6], 1) 1 2 3 4 5 6
1 0.0 8.0 2.8 5.6 8.3 1.7
2 8.0 0.0 8.2 5.6 2.6 6.9
3 2.8 8.2 0.0 6.6 9.1 3.3
4 5.6 5.6 6.6 0.0 6.6 4.5
5 8.3 2.6 9.1 6.6 0.0 7.2
6 1.7 6.9 3.3 4.5 7.2 0.0# 1.b Calculando la matriz de distancia euclidiana con la función daisy()
library(cluster)
dist.eucl2 <- daisy(datosc, metric = "euclidean")
# Visualizando un subconjunto de la matriz de distancia
round(as.matrix(dist.eucl2)[1:6, 1:6], 1) 1 2 3 4 5 6
1 0.0 8.0 2.8 5.6 8.3 1.7
2 8.0 0.0 8.2 5.6 2.6 6.9
3 2.8 8.2 0.0 6.6 9.1 3.3
4 5.6 5.6 6.6 0.0 6.6 4.5
5 8.3 2.6 9.1 6.6 0.0 7.2
6 1.7 6.9 3.3 4.5 7.2 0.0# 1.c Calculando la matriz de distancia euclidiana con la
# funcion get_dist()
library(factoextra)
res.dist <- get_dist(datosc, stand = FALSE,
method = "euclidean")
# Visualizando un subconjunto de la matriz de distancia
round(as.matrix(res.dist)[1:6, 1:6], 1) 1 2 3 4 5 6
1 0.0 8.0 2.8 5.6 8.3 1.7
2 8.0 0.0 8.2 5.6 2.6 6.9
3 2.8 8.2 0.0 6.6 9.1 3.3
4 5.6 5.6 6.6 0.0 6.6 4.5
5 8.3 2.6 9.1 6.6 0.0 7.2
6 1.7 6.9 3.3 4.5 7.2 0.0# 2.a Visualizando la matriz de distancia con fviz_dist()
fviz_dist(res.dist) 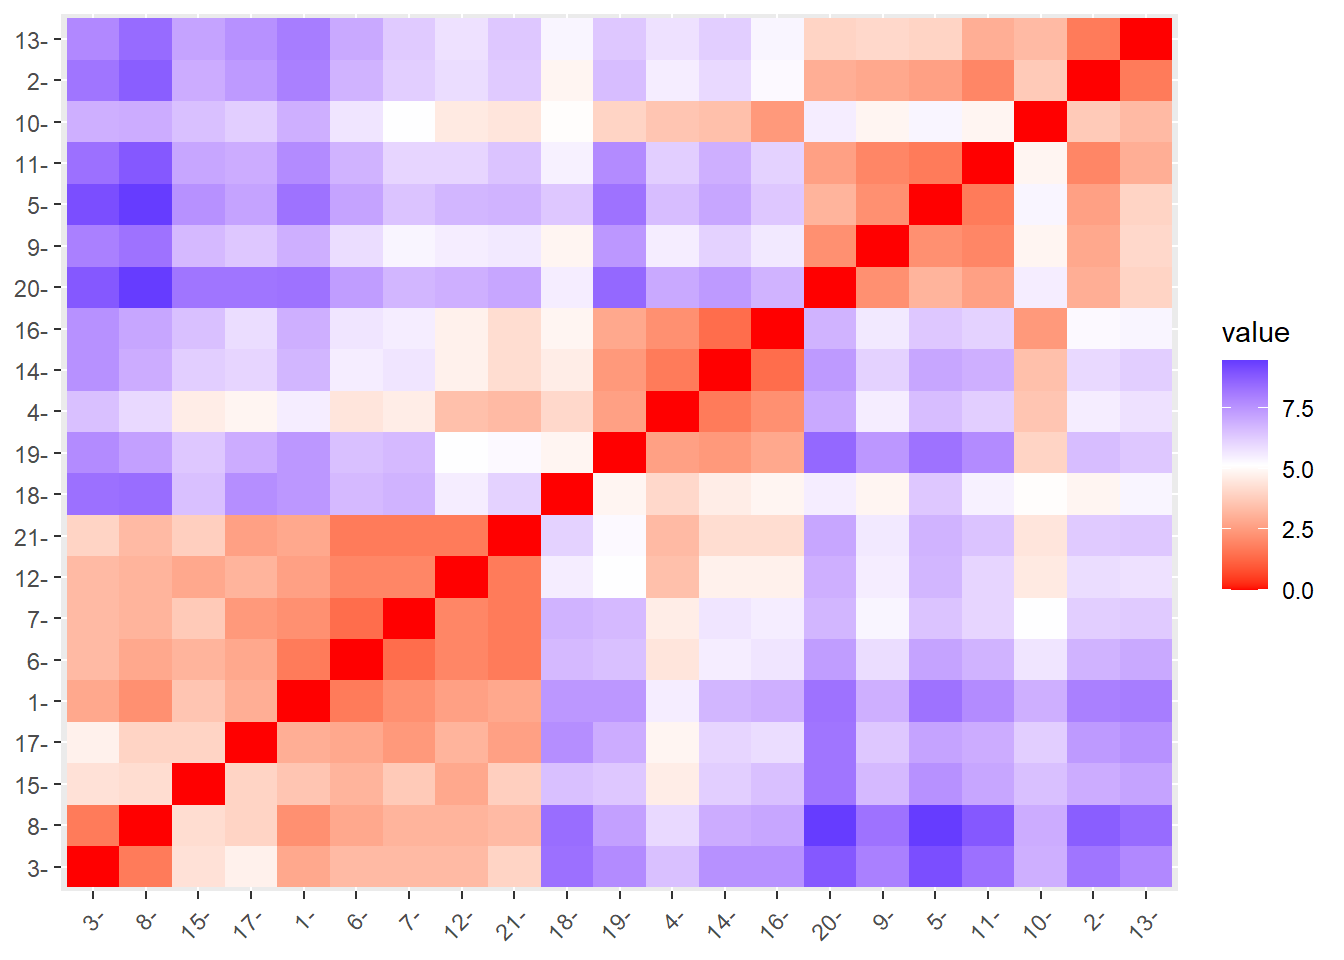
fviz_dist(res.dist,
          gradient = list(low = "#00AFBB", mid = "white",
                          high = "#FC4E07"))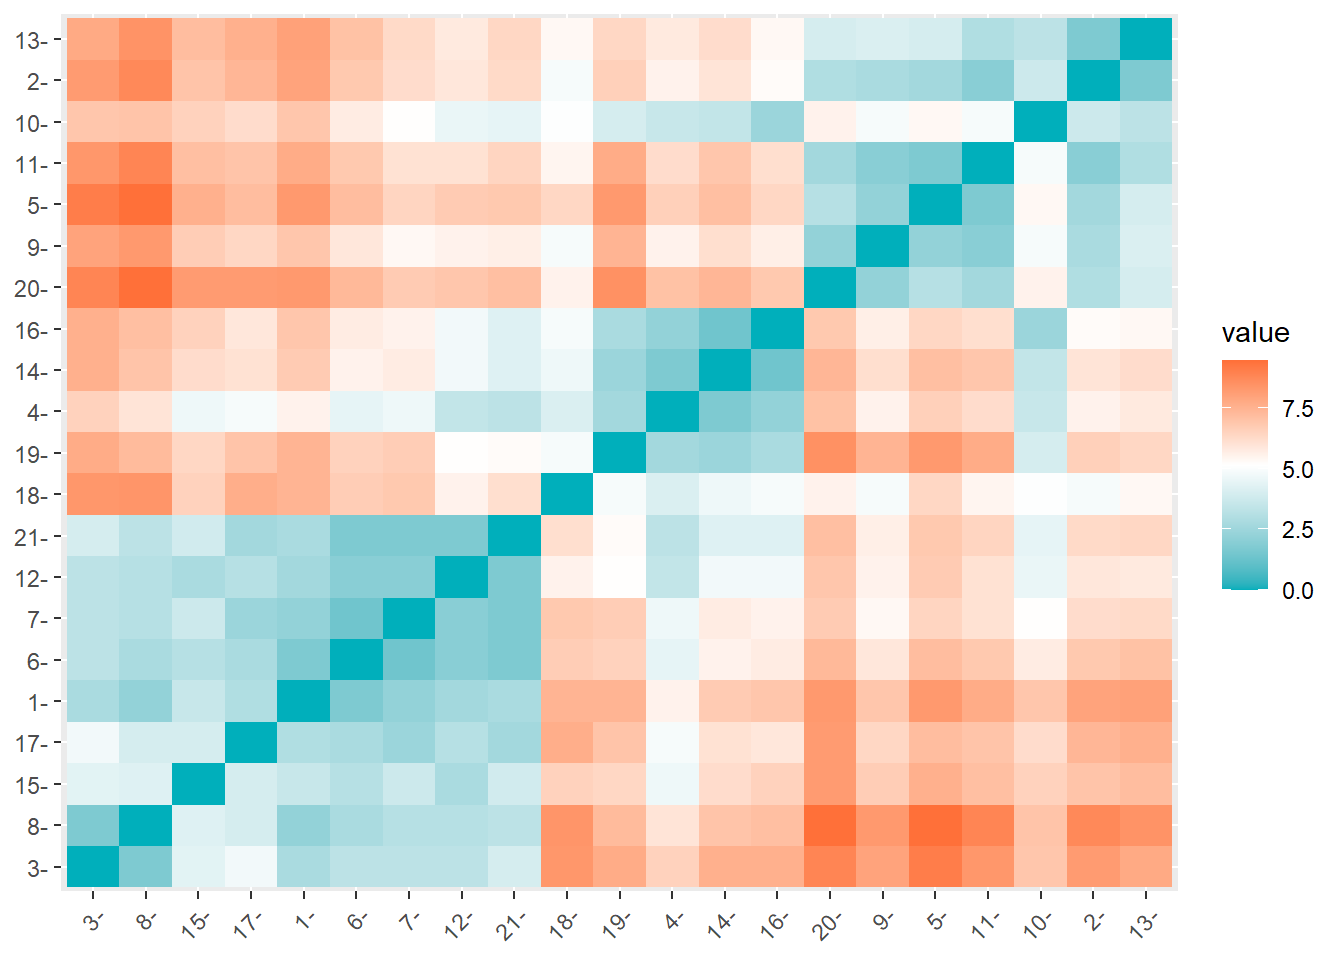
# 2.b Visualizando la matriz de distancia con corrplot()
library(corrplot)
corrplot(as.matrix(dist.eucl),
         is.corr = FALSE,
         method = "color")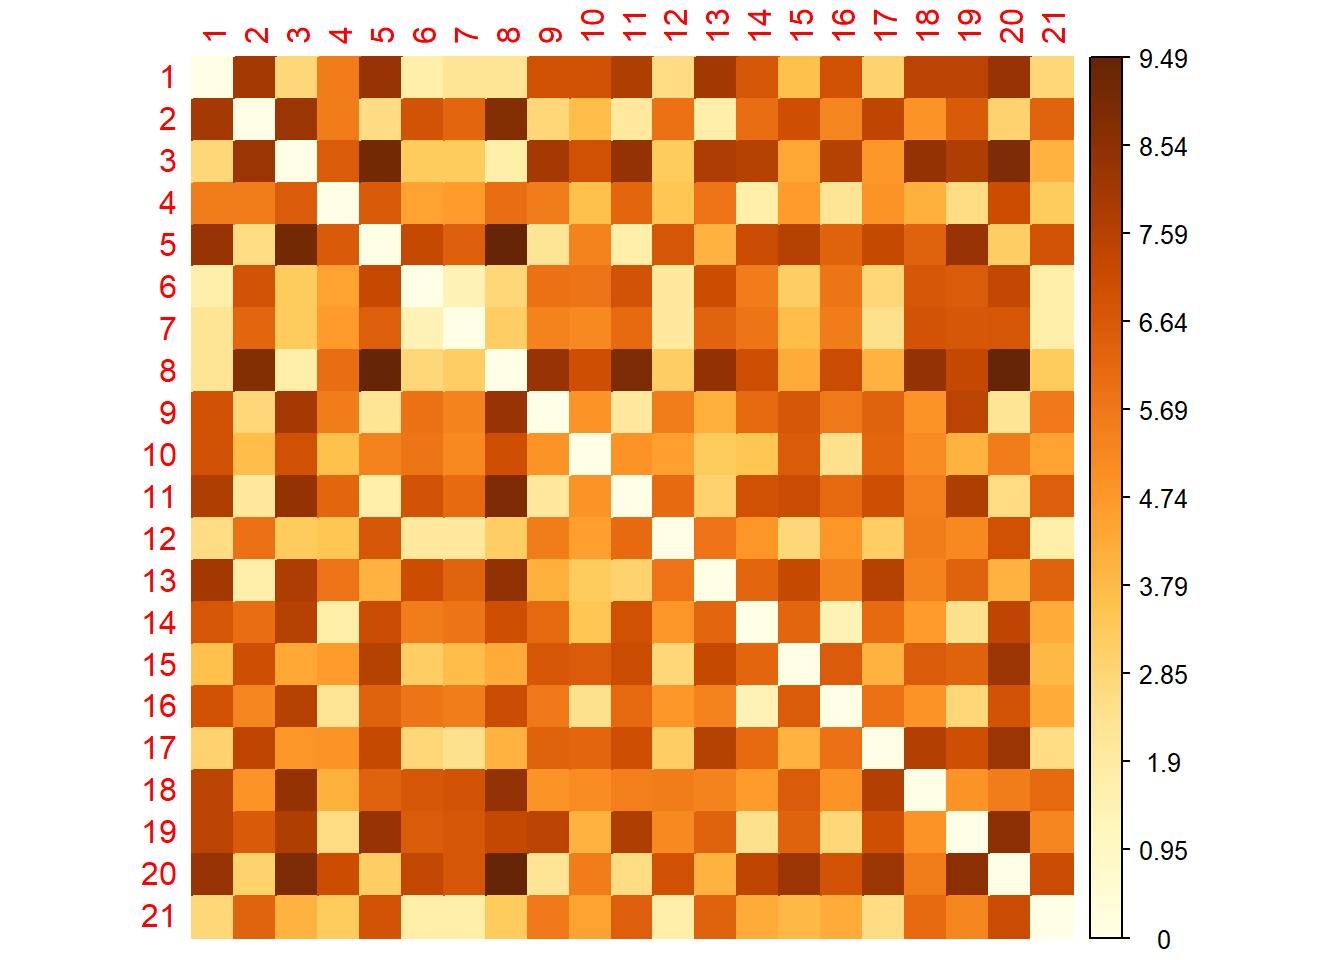
# 2.c Visualizando solo el triangulo superior
corrplot(as.matrix(dist.eucl), is.corr = FALSE,
         method = "color",
         order = "hclust", type = "upper")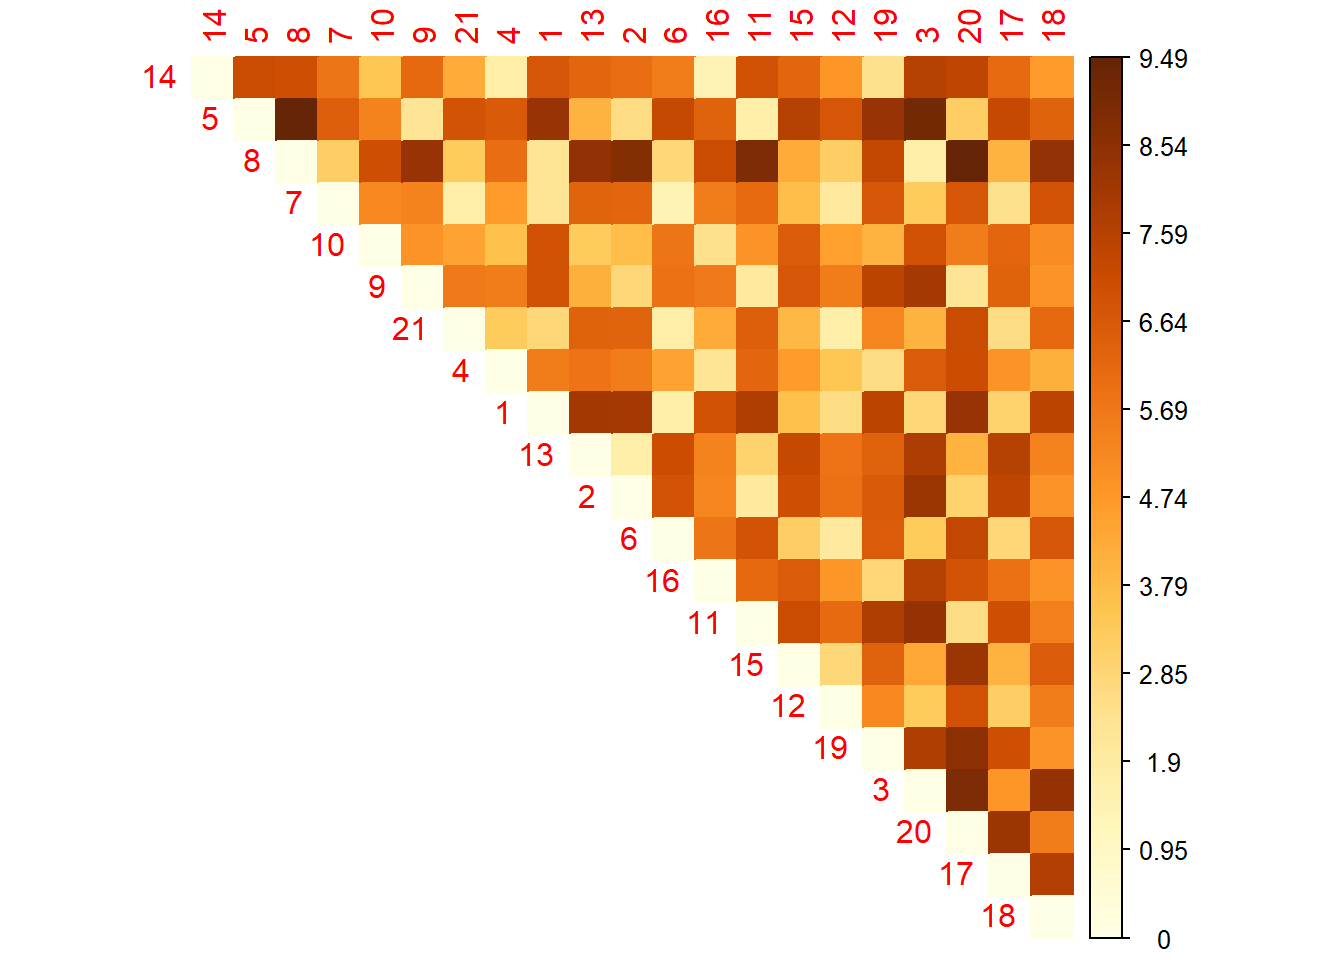
# Mapas de calor y dendograma
distan <- as.matrix(dist.eucl)
heatmap(distan, xlab = "Individuos",
        ylab = "Individuos",
        main = "Mapa de Calor del Ejemplo de Compras")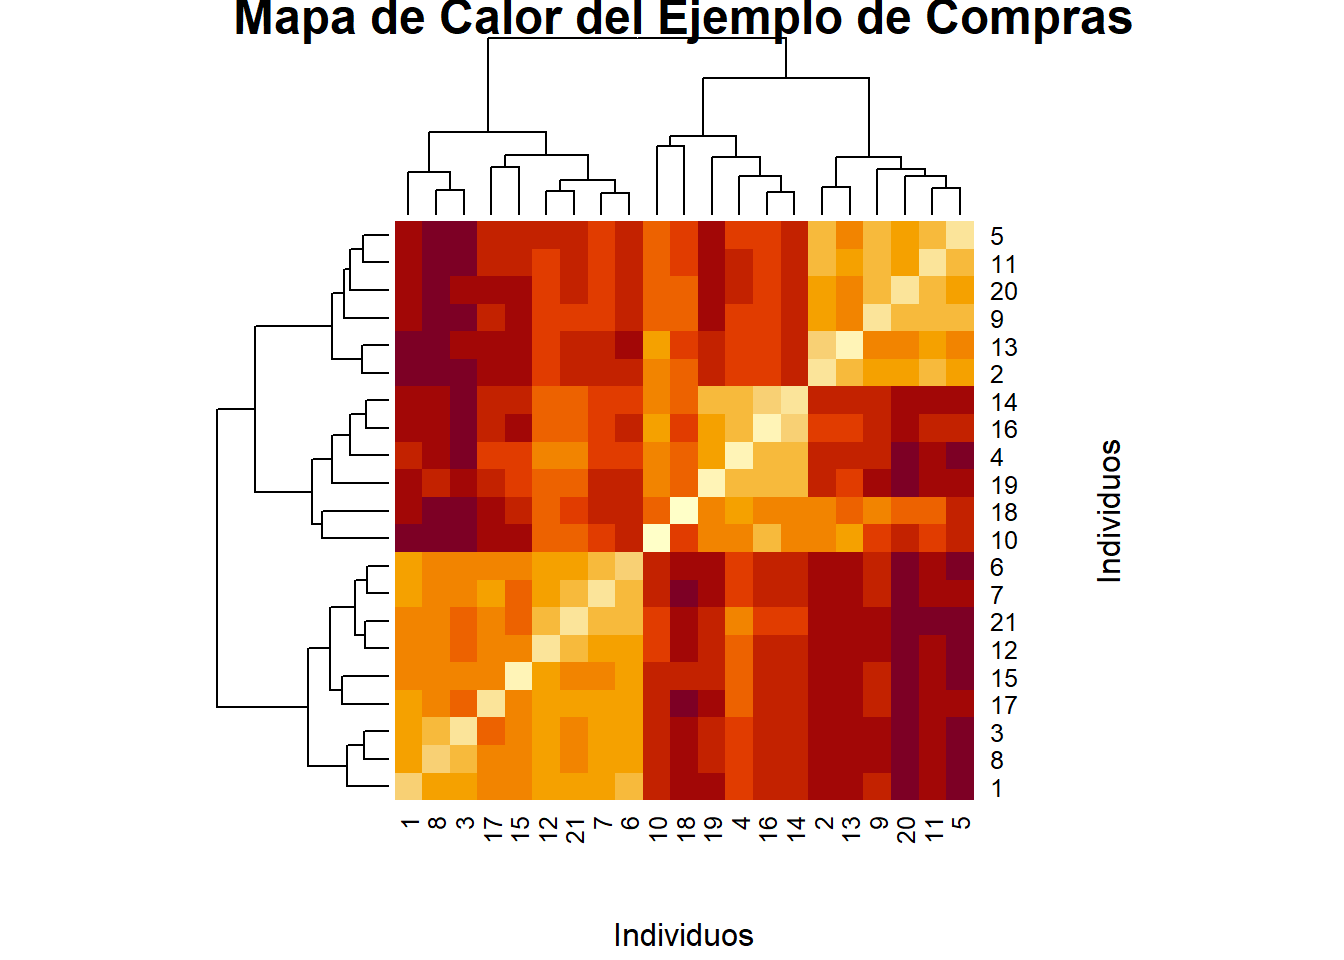
Cluster Jerárquico Aglomeratiov: AGNES
Los datos estan en una escala de likert de 1 a 7 por lo que no es necesario estandarizar.
# Usando la distancia euclidiana
d <- dist(datosc, method = "euclidean")
as.matrix(d)[1:6, 1:6]
1 2 3 4 5 6
1 0.00 8.00 2.83 5.57 8.31 1.73
2 8.00 0.00 8.25 5.57 2.65 6.86
3 2.83 8.25 0.00 6.56 9.11 3.32
4 5.57 5.57 6.56 0.00 6.63 4.47
5 8.31 2.65 9.11 6.63 0.00 7.21
6 1.73 6.86 3.32 4.47 7.21 0.00# Cluster Jerarquico usando el método de enlace average
res.hc <- hclust(d, method = "average" )
res.hc
Call:
hclust(d = d, method = "average")

Cluster method   : average
Distance         : euclidean
Number of objects: 21 str(res.hc)List of 7
$ merge : int [1:20, 1:2] -6 -14 -2 -3 -5 -21 -12 -4 -9 -1 ...
$ height : num [1:20] 1.41 1.41 1.73 1.73 1.73 ...
$ order : int [1:21] 15 3 8 17 1 12 21 6 7 2 ...
$ labels : NULL
$ method : chr "average"
$ call : language hclust(d = d, method = "average")
$ dist.method: chr "euclidean"
- attr(*, "class")= chr "hclust"# Proceso de agrupamiento indicando los individuos
res.hc$merge [,1] [,2]
[1,] -6 -7
[2,] -14 -16
[3,] -2 -13
[4,] -3 -8
[5,] -5 -11
[6,] -21 1
[7,] -12 6
[8,] -4 2
[9,] -9 5
[10,] -1 7
[11,] -19 8
[12,] -20 9
[13,] -17 10
[14,] 3 12
[15,] 4 13
[16,] -10 11
[17,] -15 15
[18,] -18 16
[19,] 14 18
[20,] 17 19# Proceso de agrupamiento indicando las distancias
head(res.hc$height) #los 6 primeros[1] 1.41 1.41 1.73 1.73 1.73 1.73tail(res.hc$height) #los 6 últimos [1] 3.36 3.38 3.73 4.74 6.06 6.69alturas <- data.frame(etapa = 1:20, distancia = res.hc$height)
alturas etapa distancia
1 1 1.41
2 2 1.41
3 3 1.73
4 4 1.73
5 5 1.73
6 6 1.73
7 7 1.91
8 8 1.98
9 9 2.12
10 10 2.36
11 11 2.64
12 12 2.68
13 13 2.82
14 14 3.20
15 15 3.36
16 16 3.38
17 17 3.73
18 18 4.74
19 19 6.06
20 20 6.69ggplot(alturas) + aes(x = etapa, y = distancia) +
geom_point() + geom_line() +
scale_x_continuous(breaks = seq(1, 20)) +
geom_vline(xintercept = 18, col = "red", lty = 3) +
geom_vline(xintercept = 17, col = "blue", lty = 3) +
theme_bw() +
gghighlight(etapa >= 17)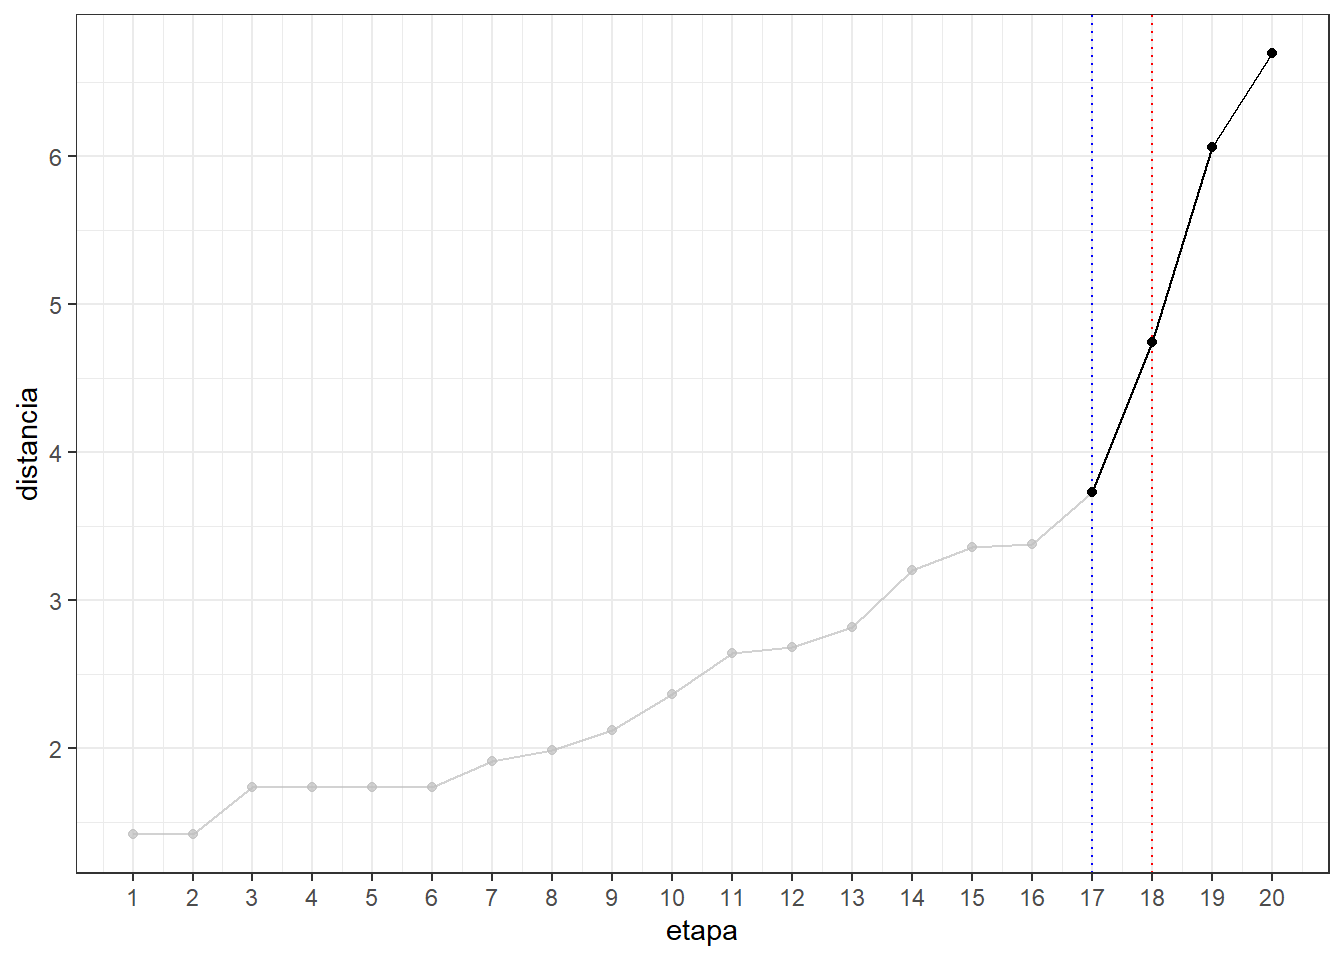
Visualizar el dendograma
plot(res.hc, cex = 0.6, hang = -1) 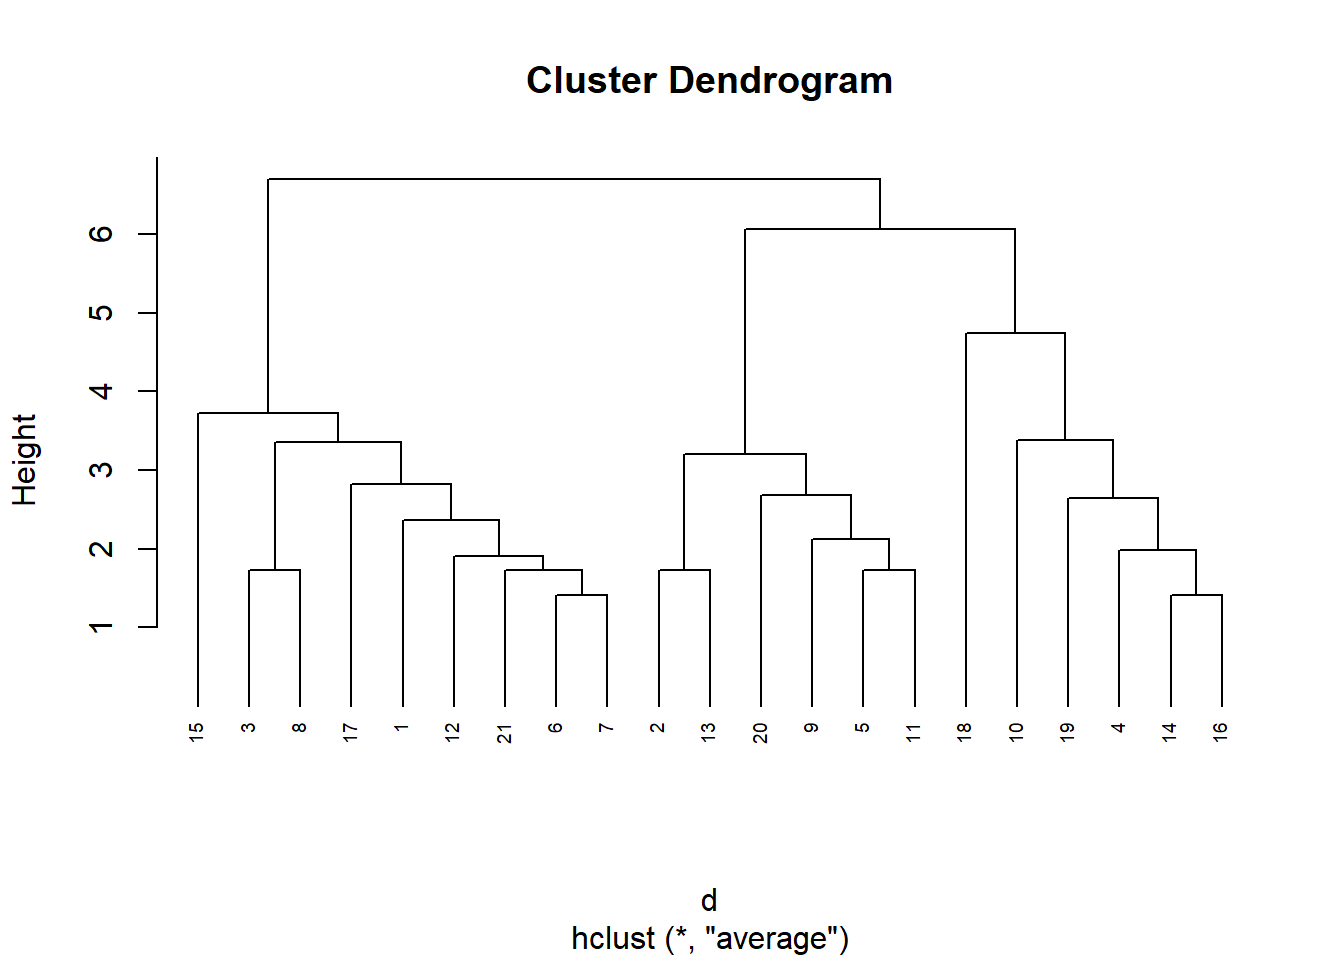
# Dendograma con el paquete factoextra
library(factoextra)

fviz_dend(res.hc, cex = 0.5, k = 3, rect = TRUE)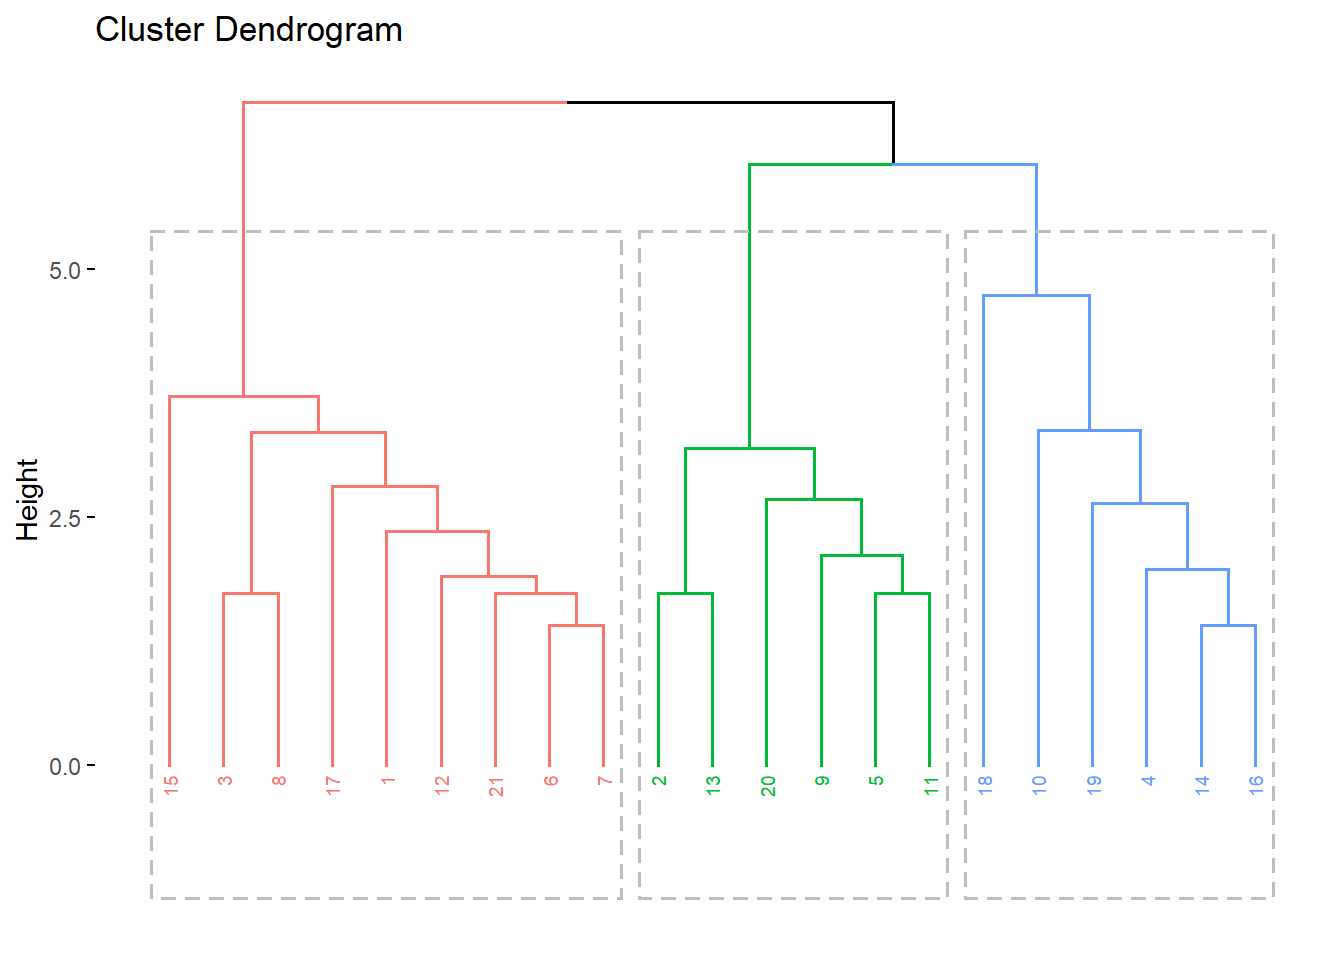
# Dendrograma sin etiquetas
hcd <- as.dendrogram(res.hc)
nodePar <- list(lab.cex = 0.6, pch = c(NA, 19),
                cex = 0.7, col = "blue")
plot(hcd, ylab = "Height",
     nodePar = nodePar,
     leaflab = "none")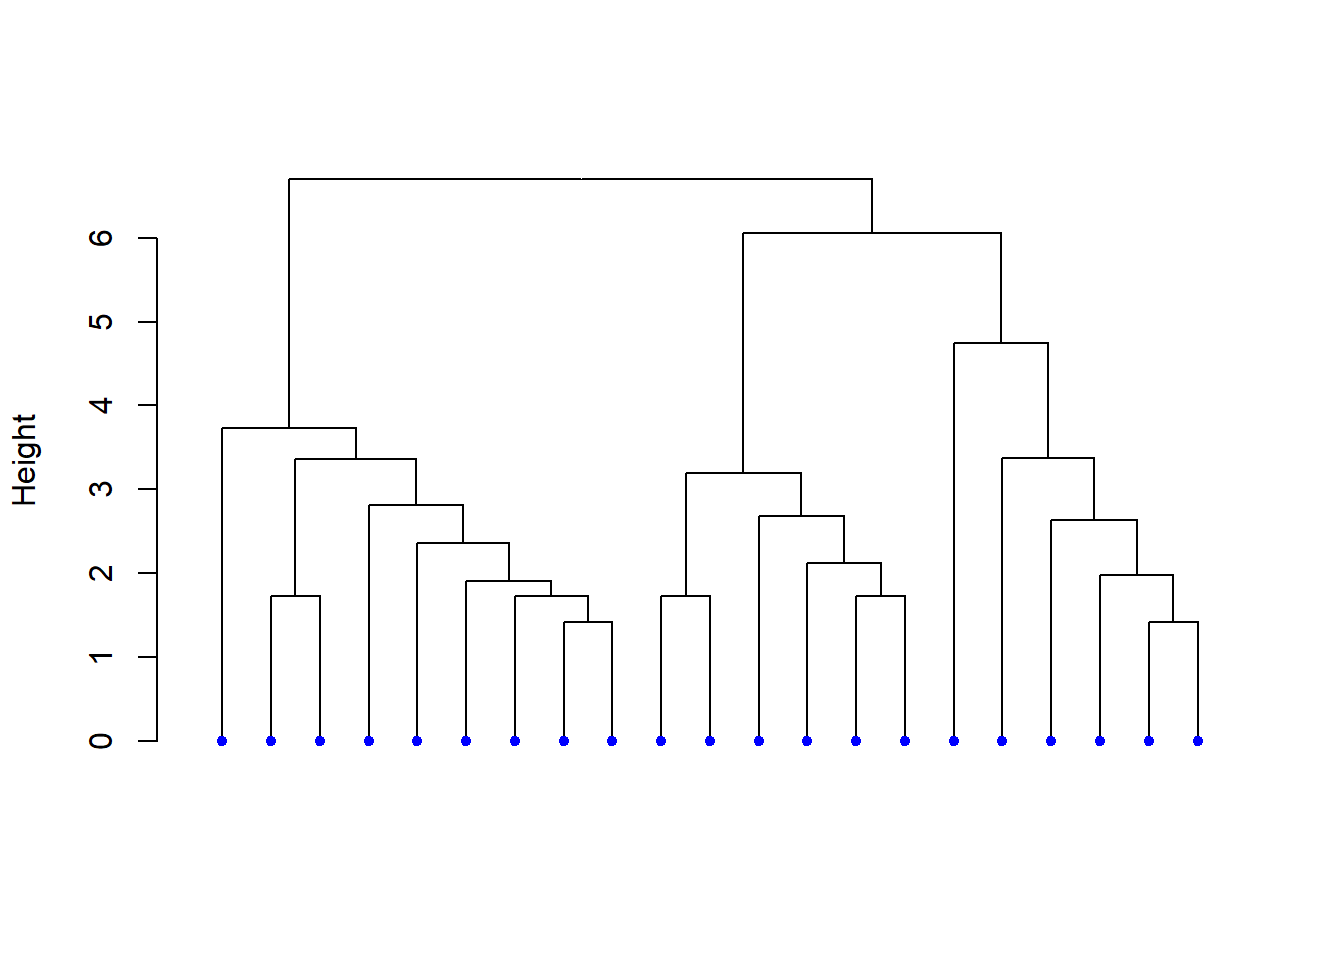
# Dendrograma Horizontal
plot(hcd,  xlab = "Height",
     nodePar = nodePar, horiz = TRUE)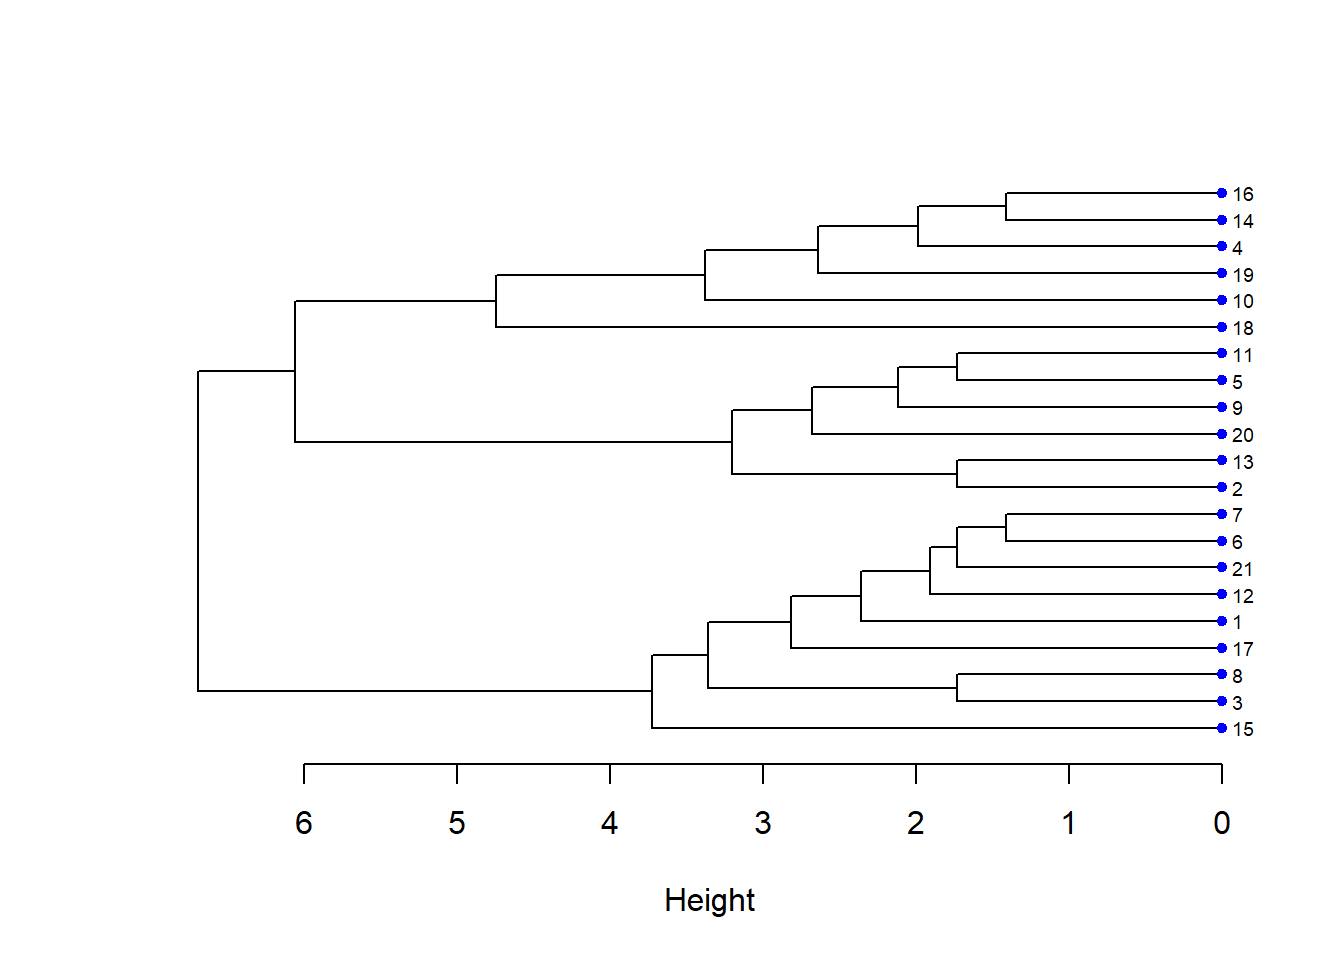
# Cambiando los colores
plot(hcd,  xlab = "Height", nodePar = nodePar,
     edgePar = list(col = 2:3, lwd = 2:1))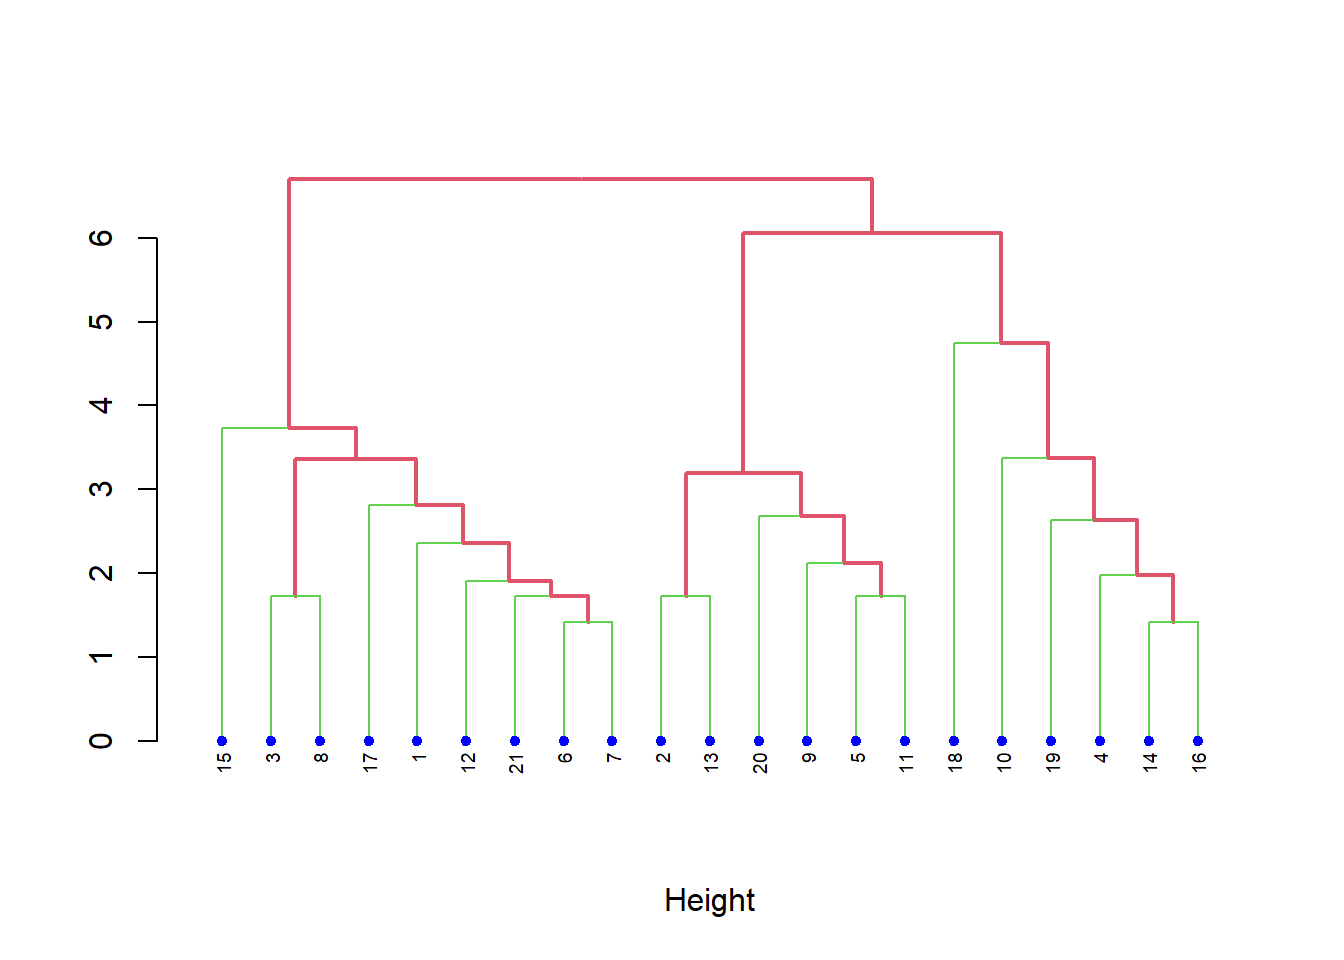
# Dendrograma Triangular
plot(hcd, type = "triangle", ylab = "Height")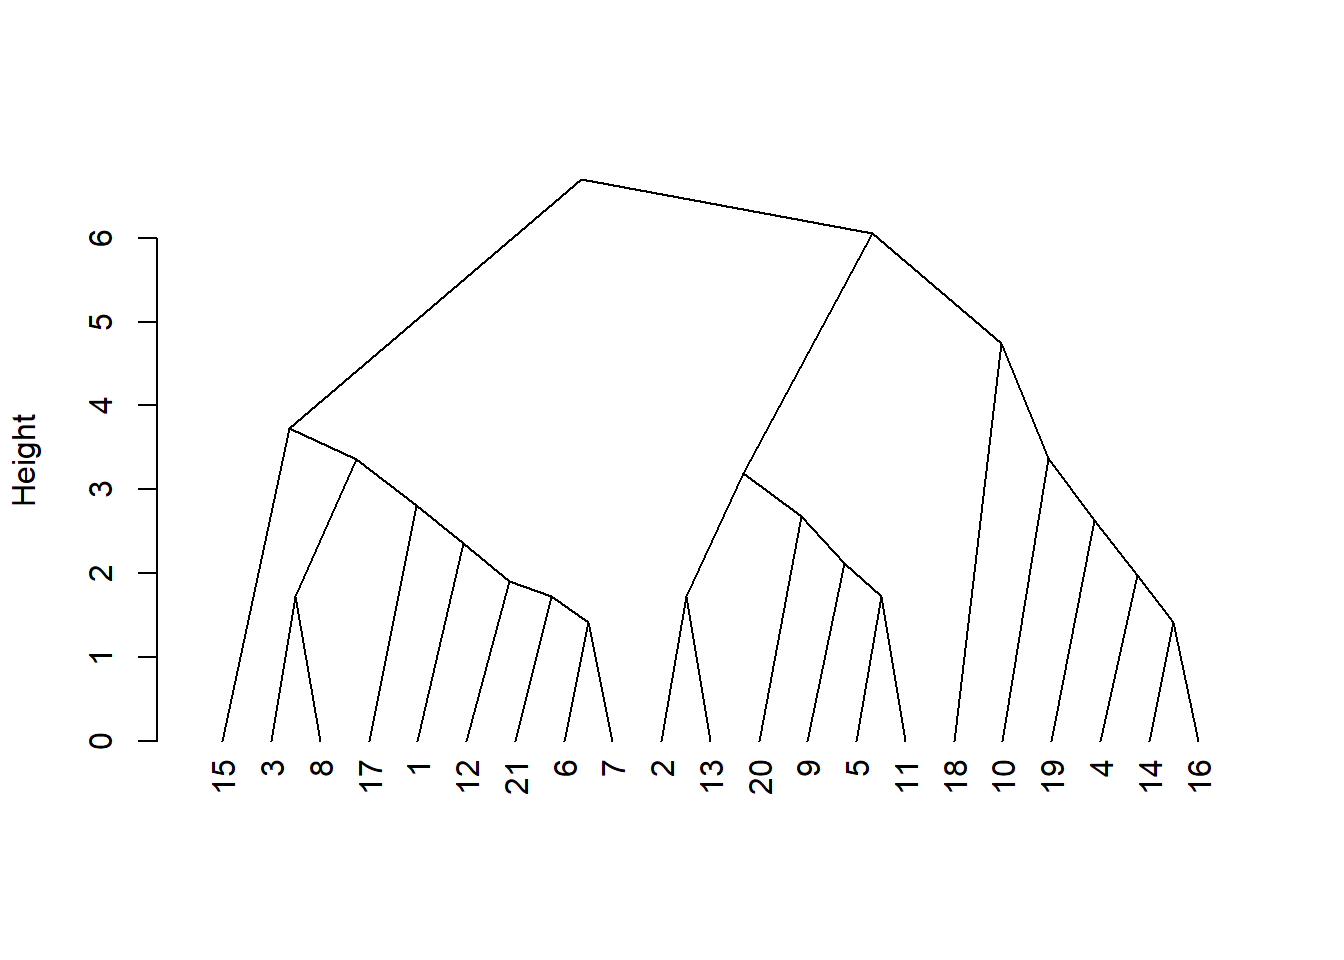
# Dividir en 3 clusters
grp <- cutree(res.hc, k = 3)
grp
[1] 1 2 1 3 2 1 1 1 2 3 2 1 2 3 1 3 1 3 3 2 1library(factoextra)
fviz_dend(res.hc, k=3, cex = 0.5,
k_colors = rainbow(3),
color_labels_by_k = TRUE,
rect=TRUE)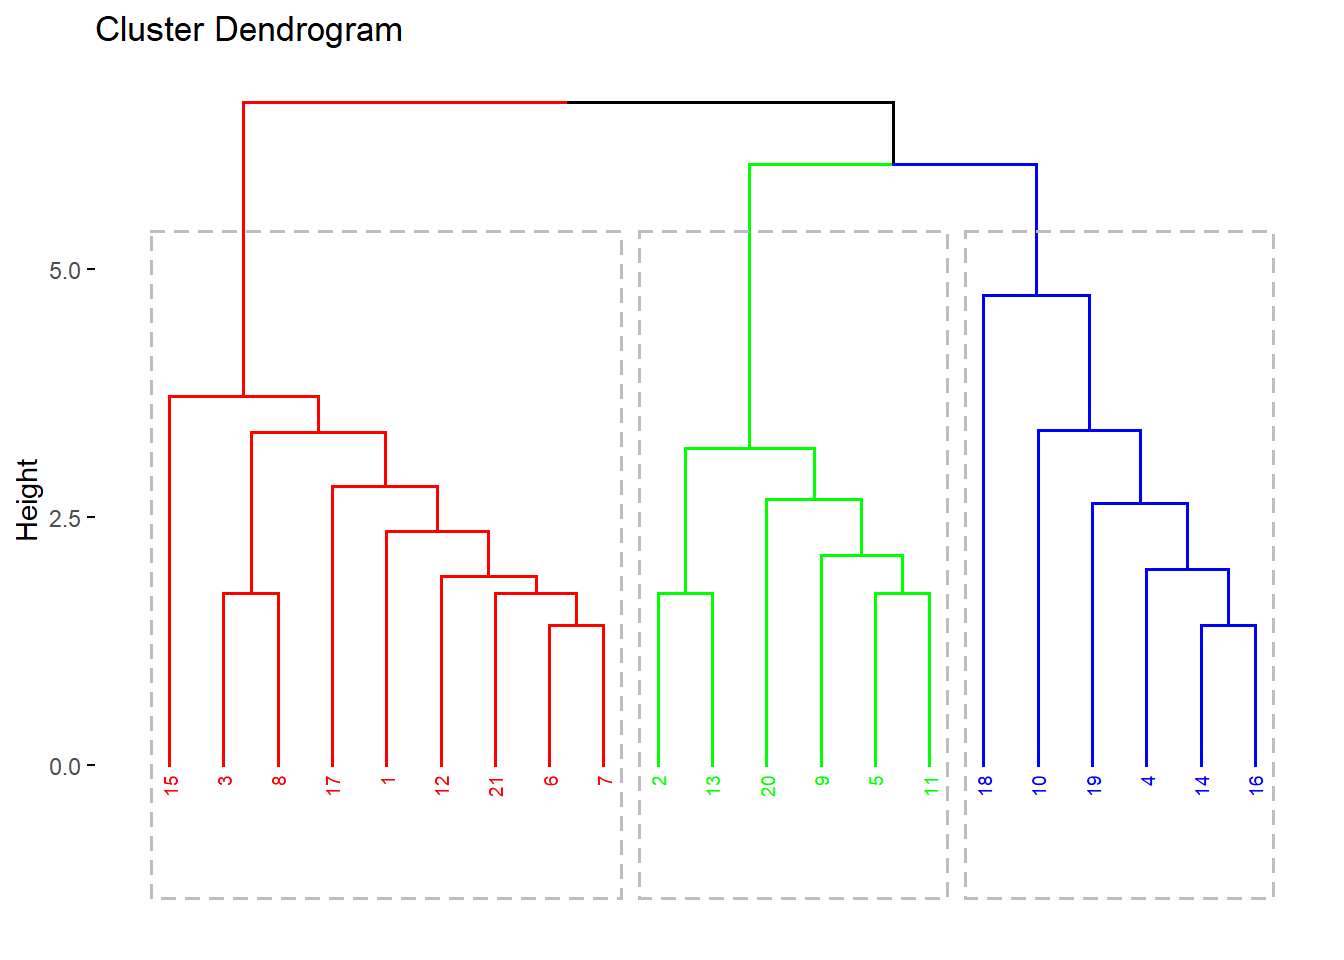
fviz_cluster(list(data = datosc, cluster = grp),
             palette = c("#2E9FDF",  "#E7B800", "#FC4E07"),
             ellipse.type = "convex", # Concentration ellipse
             repel = F, # Avoid label overplotting (slow)
             show.clust.cent = FALSE, ggtheme = theme_minimal())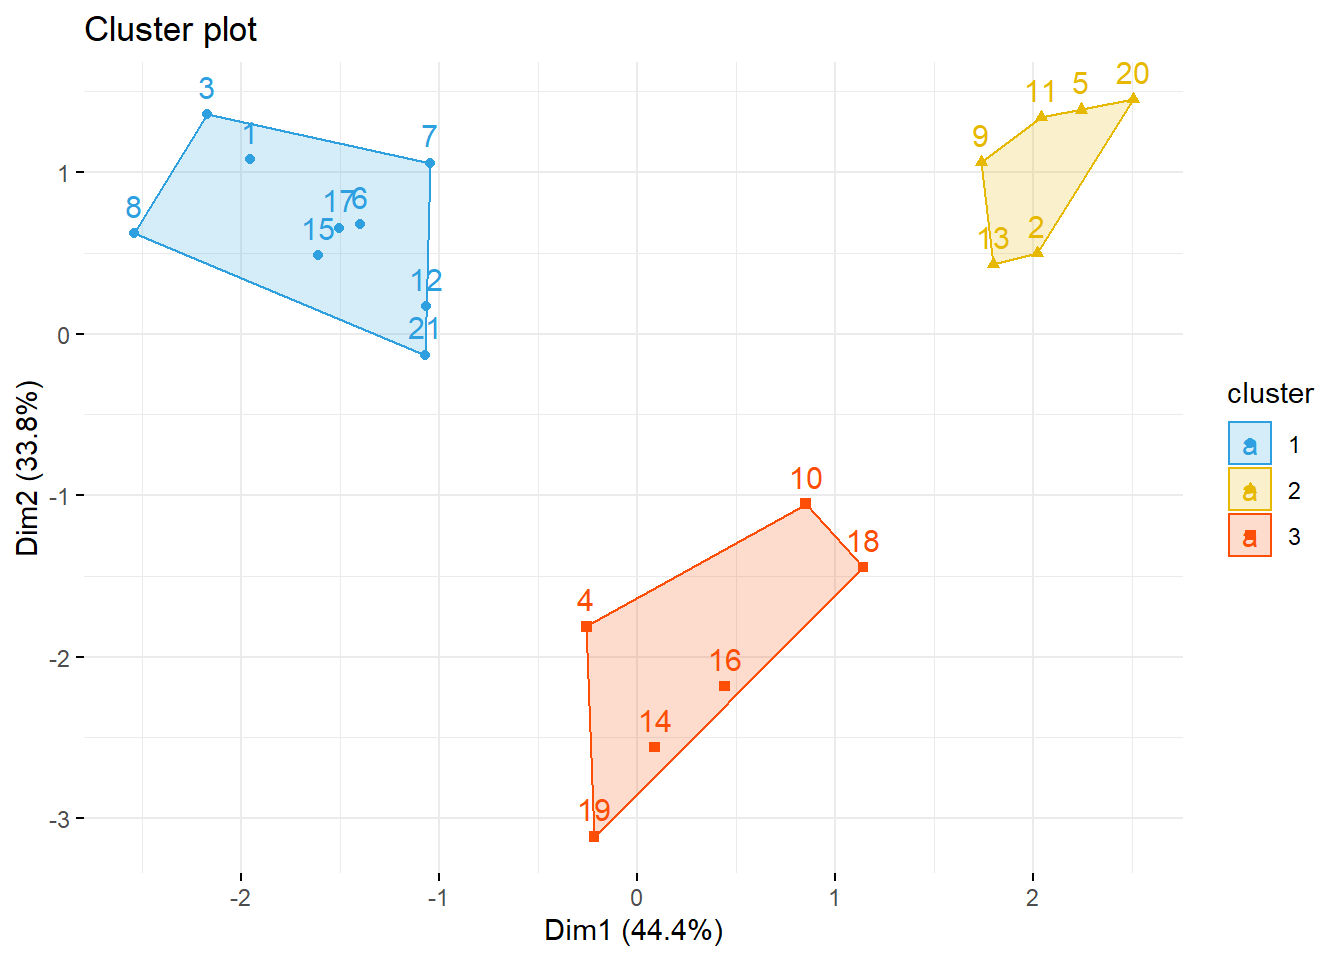
# Junta el archivo de datos con la columna de cluster
datos.j <- cbind(datosc, grp)

# Datos originales con los cluster con la finalidad de encontrar patrones
str(datos.j)
'data.frame': 21 obs. of 7 variables:
$ divertid: num 6 2 7 4 1 6 5 7 2 3 ...
$ presupu : num 4 3 2 6 3 4 3 3 4 3 ...
$ aprovech: num 7 1 6 4 2 6 6 7 3 3 ...
$ buenacom: num 3 4 4 5 2 3 3 4 3 6 ...
$ noimport: num 2 5 1 3 6 3 3 1 6 4 ...
$ ahorro : num 3 4 3 6 4 4 4 4 3 6 ...
$ grp : int 1 2 1 3 2 1 1 1 2 3 ...datos.j$grp <- factor(datos.j$grp)
str(datos.j)'data.frame': 21 obs. of 7 variables:
$ divertid: num 6 2 7 4 1 6 5 7 2 3 ...
$ presupu : num 4 3 2 6 3 4 3 3 4 3 ...
$ aprovech: num 7 1 6 4 2 6 6 7 3 3 ...
$ buenacom: num 3 4 4 5 2 3 3 4 3 6 ...
$ noimport: num 2 5 1 3 6 3 3 1 6 4 ...
$ ahorro : num 3 4 3 6 4 4 4 4 3 6 ...
$ grp : Factor w/ 3 levels "1","2","3": 1 2 1 3 2 1 1 1 2 3 ...# Para tener los datos en el computador
# write.csv(datos.j,"Compras con Jerarquico Aglomerativo.csv")Cluster jerarquico con componentes principales
library(ade4)
acp <- dudi.pca(datosc, scannf = FALSE, nf = ncol(datosc))
summary(acp)
Class: pca dudi
Call: dudi.pca(df = datosc, scannf = FALSE, nf = ncol(datosc))
Total inertia: 6
Eigenvalues:
Ax1 Ax2 Ax3 Ax4 Ax5
2.6654 2.0297 0.5811 0.4387 0.2227
Projected inertia (%):
Ax1 Ax2 Ax3 Ax4 Ax5
44.423 33.828 9.685 7.312 3.712
Cumulative projected inertia (%):
Ax1 Ax1:2 Ax1:3 Ax1:4 Ax1:5
44.42 78.25 87.94 95.25 98.96
(Only 5 dimensions (out of 6) are shown)# Valores propios
acp$eig [1] 2.6654 2.0297 0.5811 0.4387 0.2227 0.0624inertia.dudi(acp)Inertia information:
Call: inertia.dudi(x = acp)
Decomposition of total inertia:
inertia cum cum(%)
Ax1 2.66537 2.665 44.42
Ax2 2.02966 4.695 78.25
Ax3 0.58108 5.276 87.94
Ax4 0.43873 5.715 95.25
Ax5 0.22273 5.938 98.96
Ax6 0.06242 6.000 100.00# Correlaciones entre las variables y los componentes
acp$co[c(1, 2)] Comp1 Comp2
divertid -0.9613 0.0216
presupu -0.0853 -0.7612
aprovech -0.9151 0.1400
buenacom 0.1717 -0.8415
noimport 0.9219 0.1285
ahorro -0.1309 -0.8400# Grafica de Valores propios - ScreePlot
fviz_eig(acp, addlabels = TRUE, hjust = -0.3,
barfill = "white", barcolor = "darkblue",
linecolor = "red") + ylim(0, 80) + theme_minimal()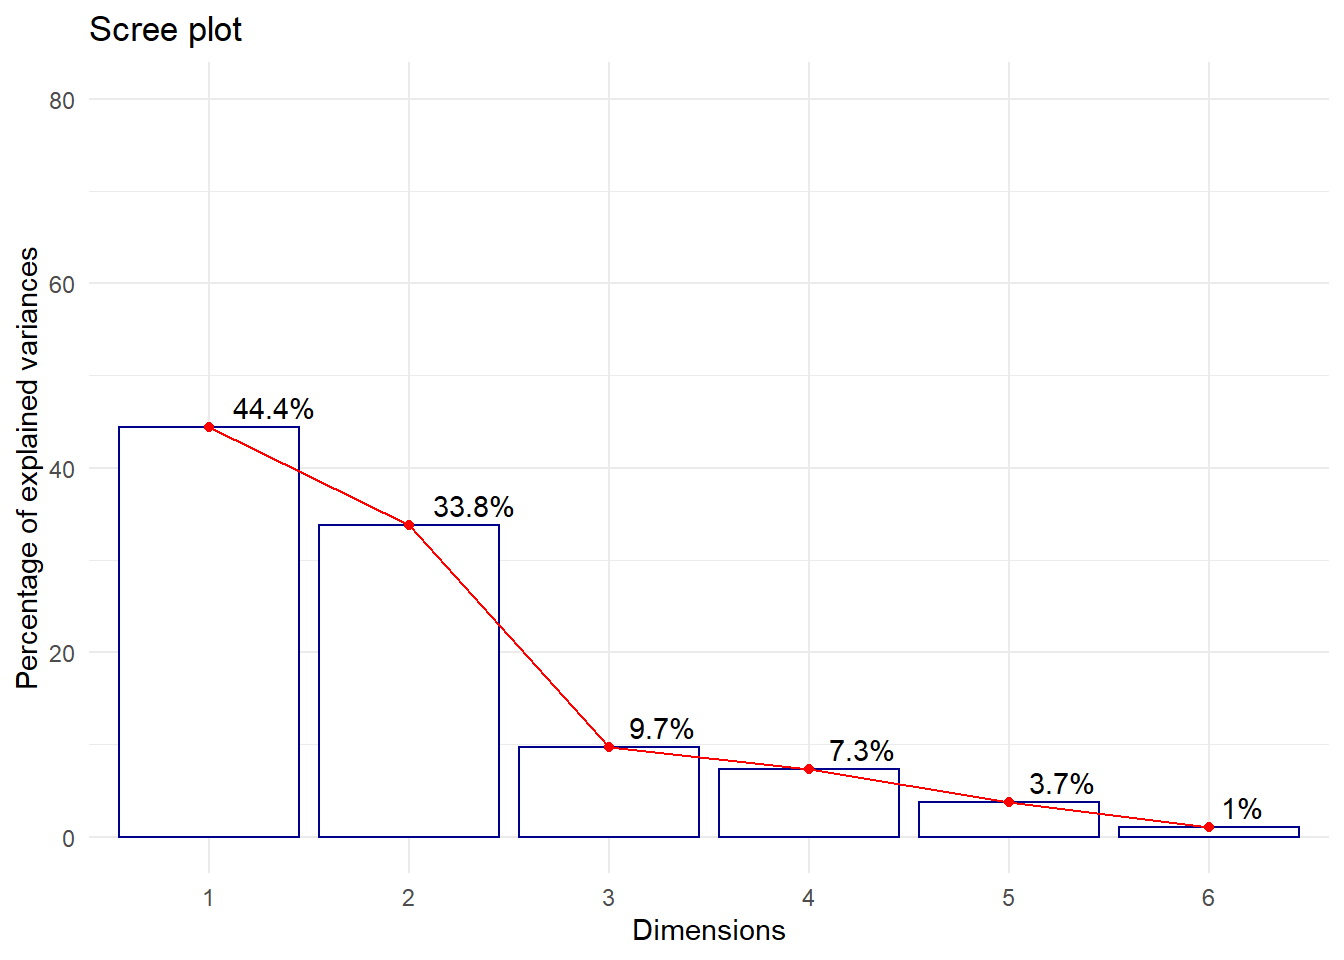
# Scores o Puntuaciones de cada individuo
acp$li[1:10,]
Axis1 Axis2 Axis3 Axis4 Axis5 Axis6
1 -2.003 1.106 0.562 0.2620 -0.3911 -0.2095
2 2.067 0.509 -0.429 0.1032 0.4697 0.2397
3 -2.226 1.396 -1.055 1.0460 0.0272 0.0527
4 -0.264 -1.856 0.582 -0.2858 0.1173 0.0465
5 2.296 1.423 0.207 -1.1221 0.2945 0.1399
6 -1.437 0.697 0.368 -0.1704 -0.3655 0.4158
7 -1.075 1.086 -0.247 -0.3546 -0.3027 0.0216
8 -2.606 0.636 -0.657 0.4417 -0.2000 -0.0174
9 1.777 1.087 0.808 -0.2278 -0.4313 0.0277
10 0.870 -1.078 -1.508 -0.0824 -0.1317 0.0131# Gráfica de individuos sobre el primer plano de componentes
s.label(acp$li, clabel = 0.7,grid=FALSE,boxes=FALSE)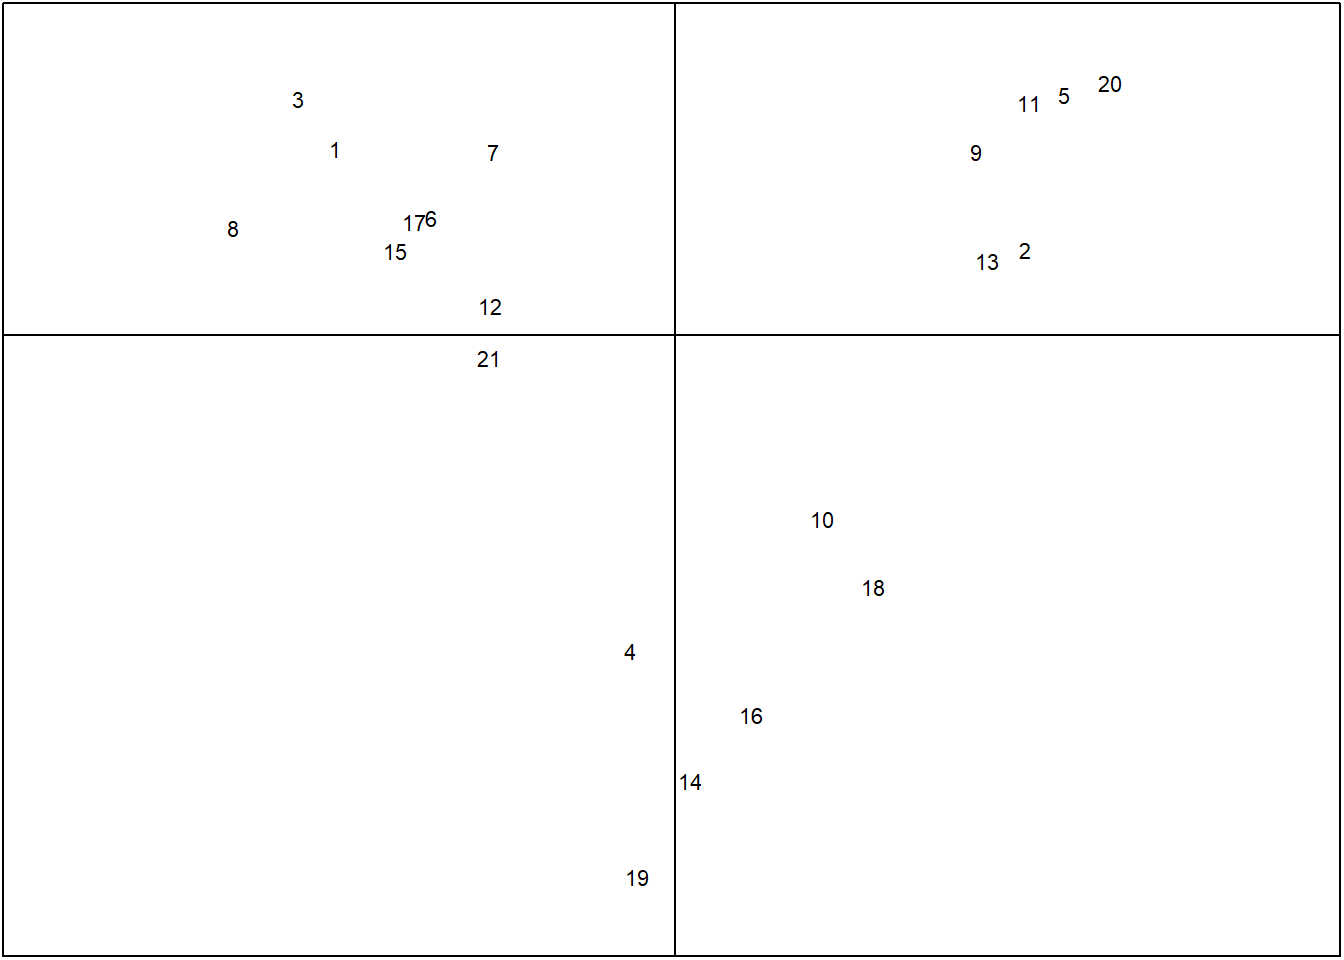
Cluster Jerárquico aglomerativo con el paquete cluster
library(cluster)
res.agnes <- agnes(x = datosc,      # matriz de datos
                   stand = FALSE,   # estandariza los datos
                   metric = "euclidean",
                   method = "average" # método de enlace
)

fviz_dend(res.agnes, cex = 0.6, k = 3)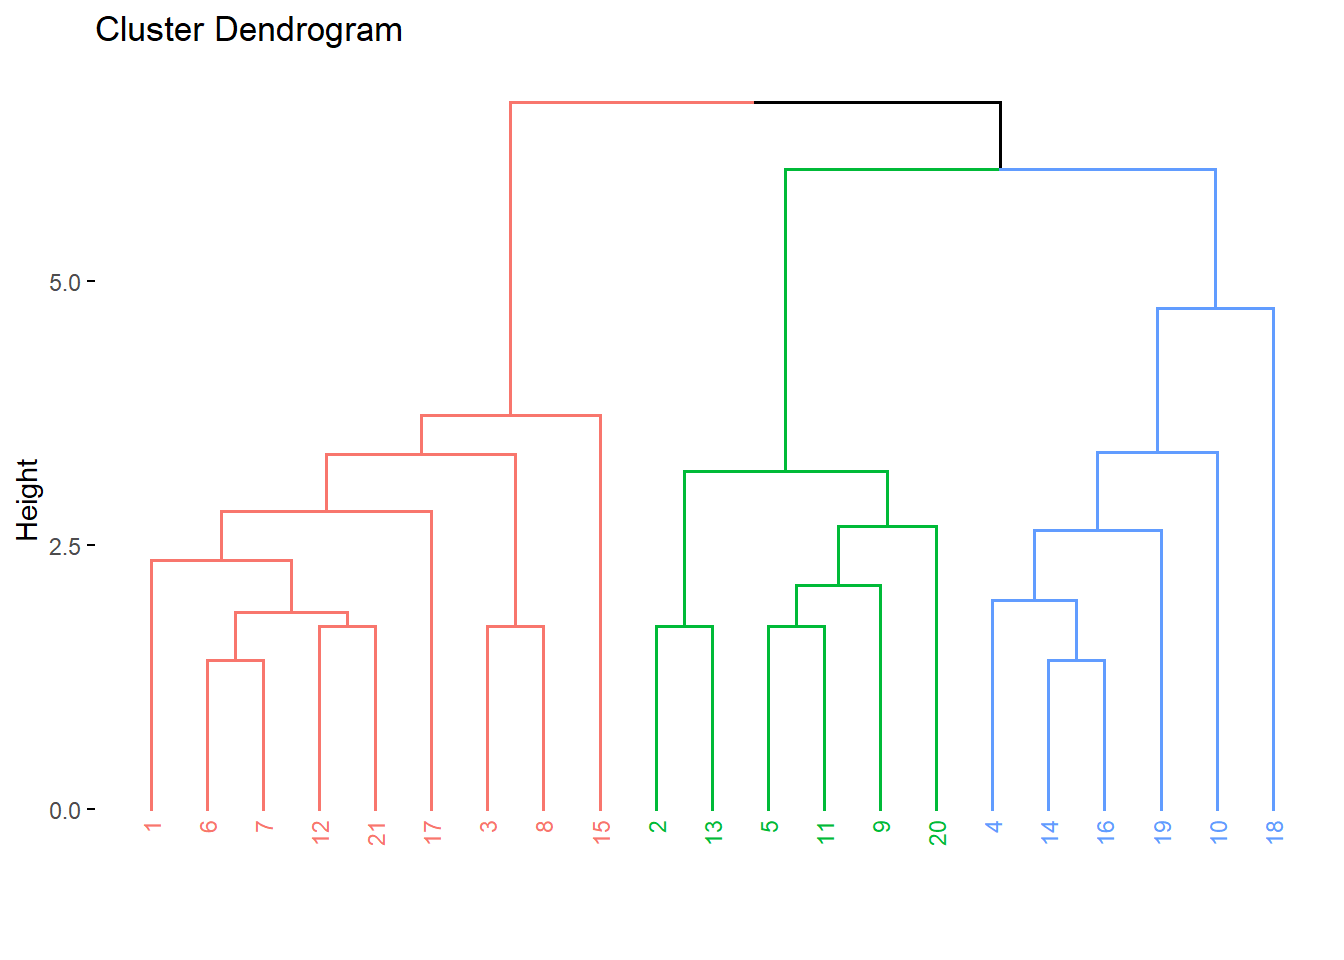
grp <- cutree(res.agnes, k = 3)

fviz_cluster(list(data = datosc, cluster = grp),
             palette = c("#2E9FDF",  "#E7B800", "#FC4E07"),
             ellipse.type = "convex", #Concentration ellipse
             repel = F, # Avoid label overplotting (slow)
             show.clust.cent = FALSE, ggtheme = theme_minimal())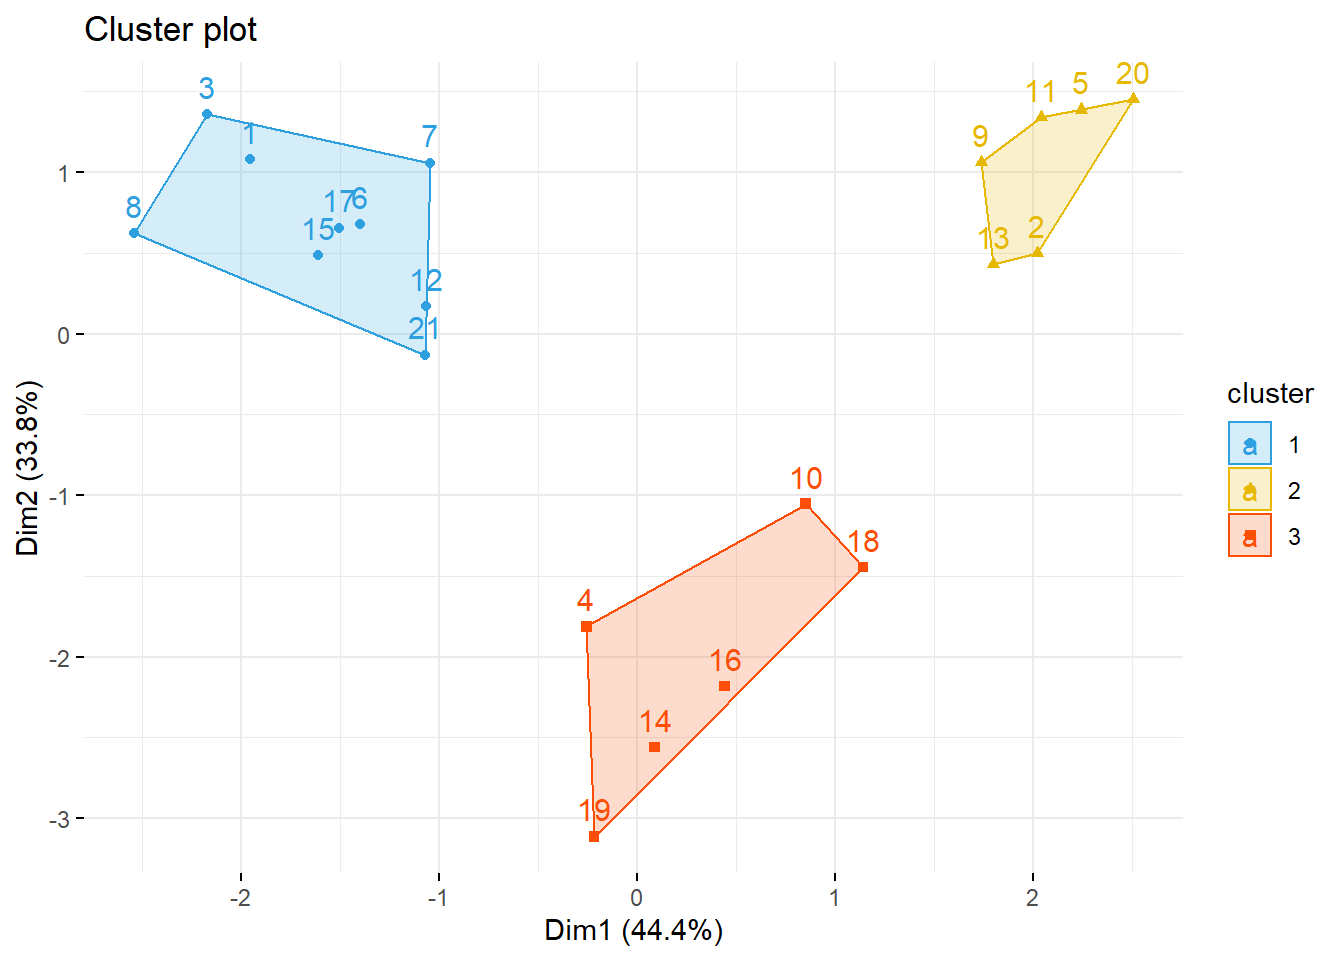
Caracterizando a los Clusters
Consiste en analizar los centros de gravedad de cada grupo (promedios)
library(compareGroups)
group <- compareGroups(grp ~.,data=datos.j)
clustab <- createTable(group,digits=3,
                       show.p.overall=FALSE)
clustab
--------Summary descriptives table by 'grp'---------

__________________________________________________
               1             2             3
              N=9           N=6           N=6
¯¯¯¯¯¯¯¯¯¯¯¯¯¯¯¯¯¯¯¯¯¯¯¯¯¯¯¯¯¯¯¯¯¯¯¯¯¯¯¯¯¯¯¯¯¯¯¯¯¯
divertid 5.667 (1.000) 1.667 (0.516) 3.500 (0.548)
presupu  3.667 (0.866) 3.000 (0.632) 5.500 (1.378)
aprovech 6.000 (1.000) 1.833 (0.753) 3.333 (0.816)
buenacom 3.222 (0.833) 3.500 (1.049) 6.000 (0.632)
noimport 2.000 (0.866) 5.500 (1.049) 3.500 (0.837)
ahorro   4.000 (0.707) 3.333 (0.816) 6.000 (1.549)
¯¯¯¯¯¯¯¯¯¯¯¯¯¯¯¯¯¯¯¯¯¯¯¯¯¯¯¯¯¯¯¯¯¯¯¯¯¯¯¯¯¯¯¯¯¯¯¯¯¯ table(datos.j$grp)
1 2 3
9 6 6 round(prop.table(table(datos.j$grp)),2)
   1    2    3
0.43 0.29 0.29
Diagrama de líneas de promedio por cluster
library(dplyr)
datos.j %>%
  group_by(grp) %>%
  summarise_all(list(mean)) -> medias
medias
# A tibble: 3 x 7
grp divertid presupu aprovech buenacom noimport ahorro
<fct> <dbl> <dbl> <dbl> <dbl> <dbl> <dbl>
1 1 5.67 3.67 6 3.22 2 4
2 2 1.67 3 1.83 3.5 5.5 3.33
3 3 3.5 5.5 3.33 6 3.5 6 datos.j %>% summarise_if(is.numeric,mean) %>%
round(4) -> general
general divertid presupu aprovech buenacom noimport ahorro
1 3.9 4 4.05 4.1 3.43 4.38general <- cbind(grp="general",general)
general grp divertid presupu aprovech buenacom noimport ahorro
1 general 3.9 4 4.05 4.1 3.43 4.38medias <- as.data.frame(rbind(medias,general))
medias grp divertid presupu aprovech buenacom noimport ahorro
1 1 5.67 3.67 6.00 3.22 2.00 4.00
2 2 1.67 3.00 1.83 3.50 5.50 3.33
3 3 3.50 5.50 3.33 6.00 3.50 6.00
4 general 3.90 4.00 4.05 4.10 3.43 4.38# Convirtiendo la data a formato tidy
library(tidyr)
gathered_datos.j <- pivot_longer(data=medias,
-grp,
names_to="variable",
values_to = "valor")
head(gathered_datos.j)# A tibble: 6 x 3
grp variable valor
<fct> <chr> <dbl>
1 1 divertid 5.67
2 1 presupu 3.67
3 1 aprovech 6
4 1 buenacom 3.22
5 1 noimport 2
6 1 ahorro 4 ggplot(gathered_datos.j) + aes(x=variable,y=valor,color=grp) +
geom_point() +
geom_line(aes(group = grp)) +
theme_bw() +
theme(legend.position = "bottom",legend.title=element_blank()) +
labs(title="Diagrama de líneas de Cluster por Variable",
x="Variable",y="") + ylim(0,8)+
scale_colour_discrete("Cluster") 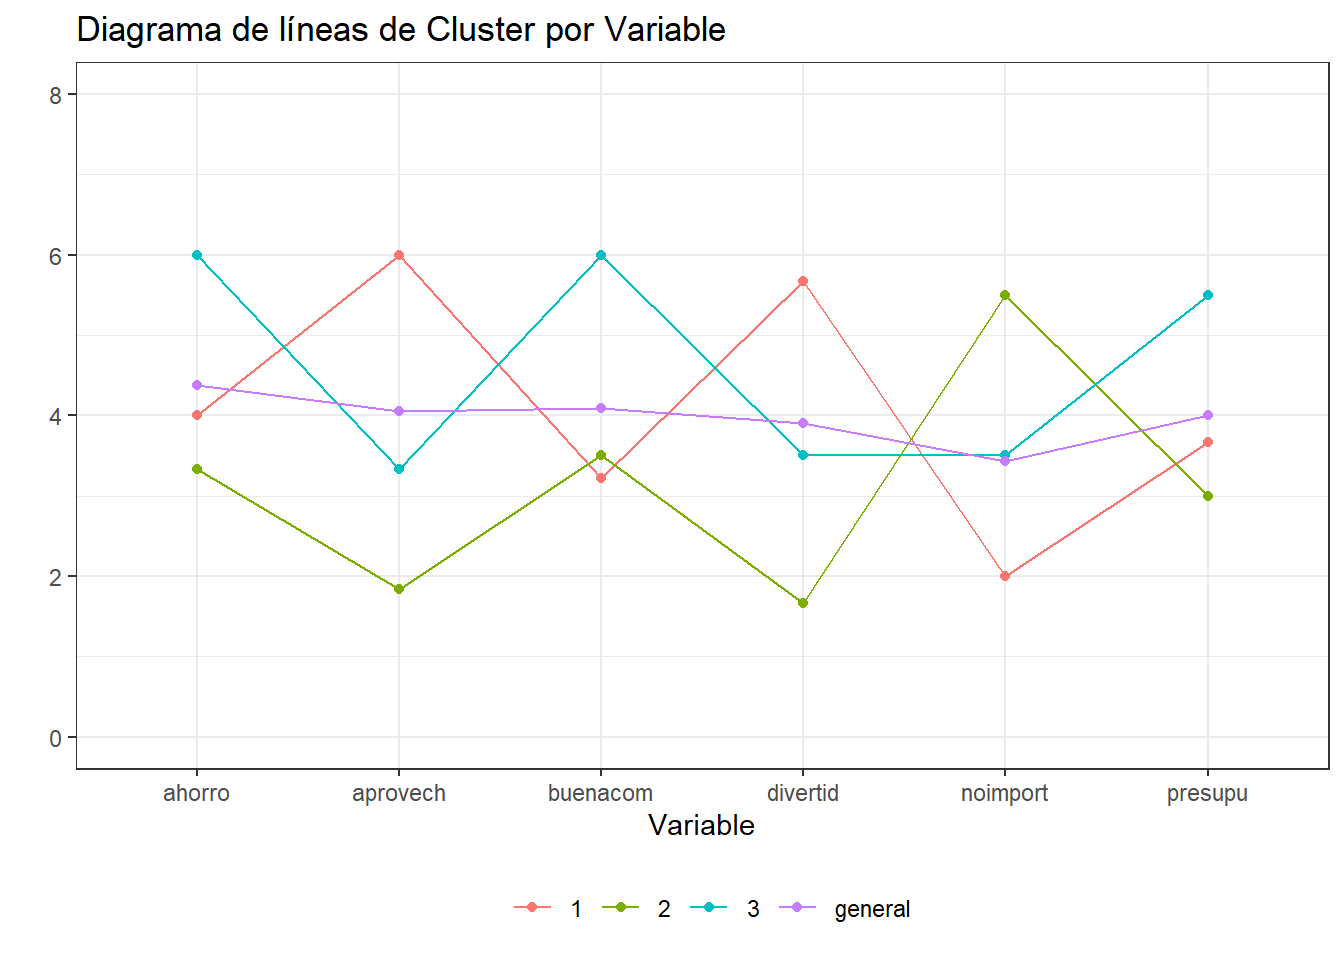
Otra opción es usando matplot() sin pasar al formato tidy
matplot(t(medias[,-1]),
        main = "Gráfico de promedios de variables por cluster",
        xlab = "Variables",
        ylab = "Promedios",
        type="l",
        ylim=c(0,8),
        col=c("blue","red","green4","black"),
        xaxt="n")   # Permite eliminar los nombres del eje X
axis(1,at=1:6,
     labels=c("div","pres","aprov","buenac","noimp","ahorro"))
legend("bottom", c("Cluster 1", "Cluster 2", "Cluster 3","General"),
       pch=c(19,19,19,19), ncol=4, cex=0.6,
       col=c("blue","red","green4","black"), bty="n")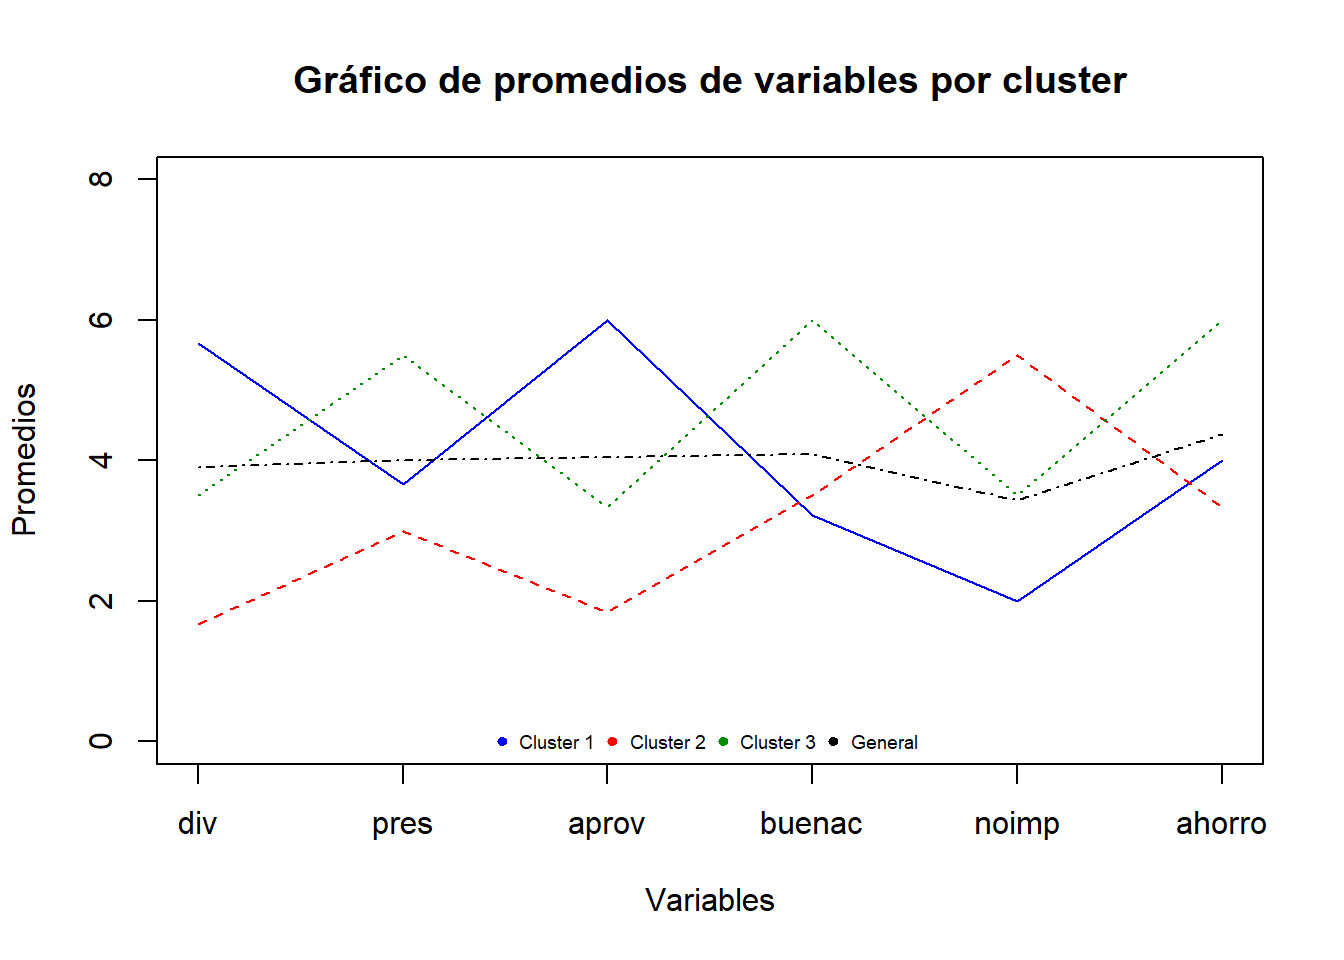
Comparando Dendogramas
library(dendextend)

# Calculando la matriz de distancia
res.dist <- dist(datosc, method = "euclidean")

# Calculando 2 clusters jerárquicos aglomerativos con métodos diferentes
hc1 <- hclust(res.dist, method = "average")
hc2 <- hclust(res.dist, method = "ward.D2")

# Creando dos Dendrogramas
dend1 <- as.dendrogram(hc1)
plot(dend1)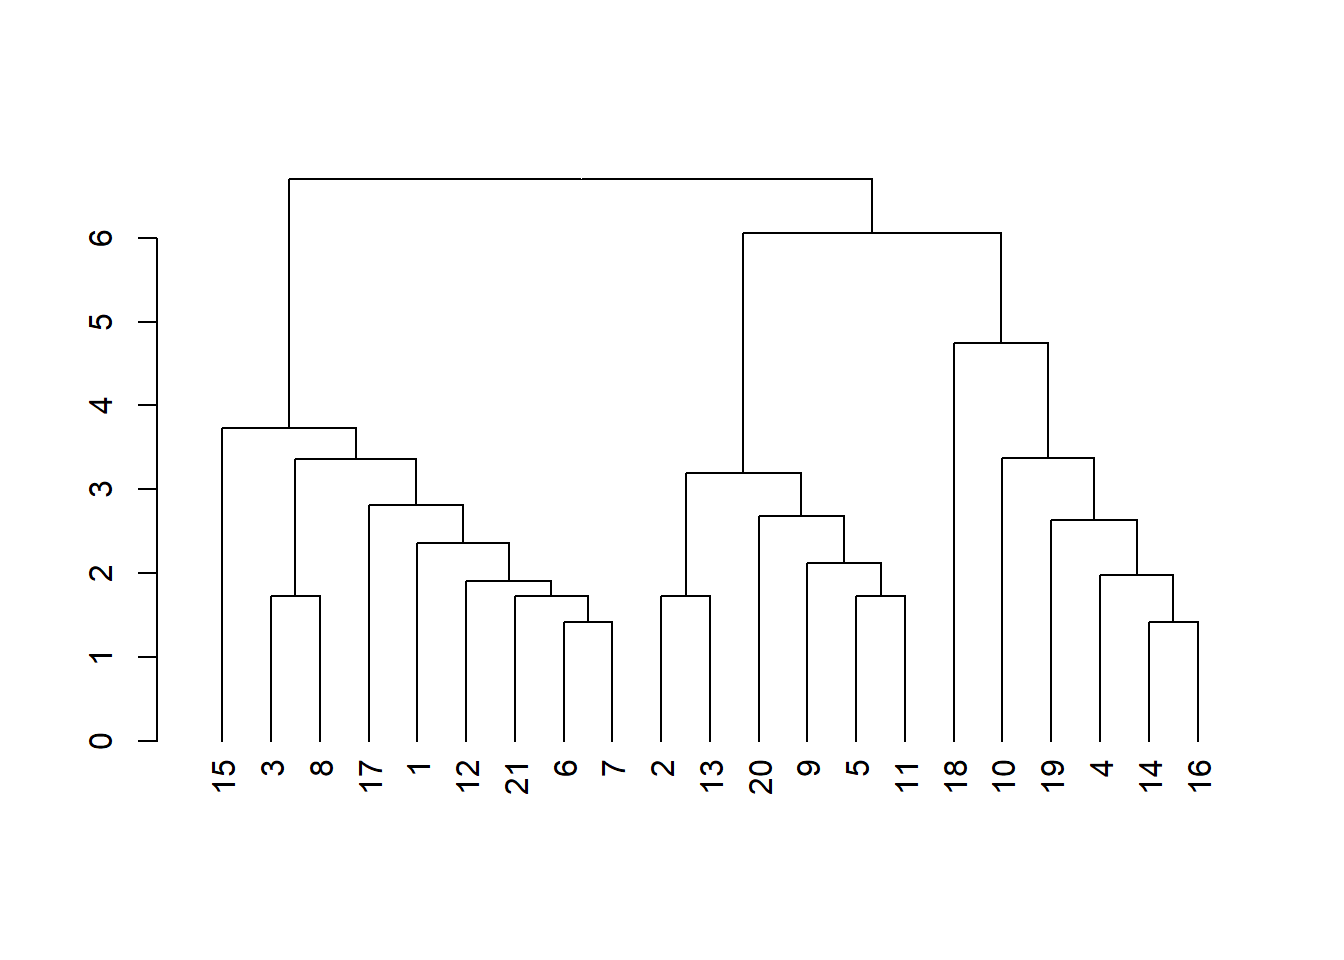
dend2 <- as.dendrogram(hc2)
plot(dend2)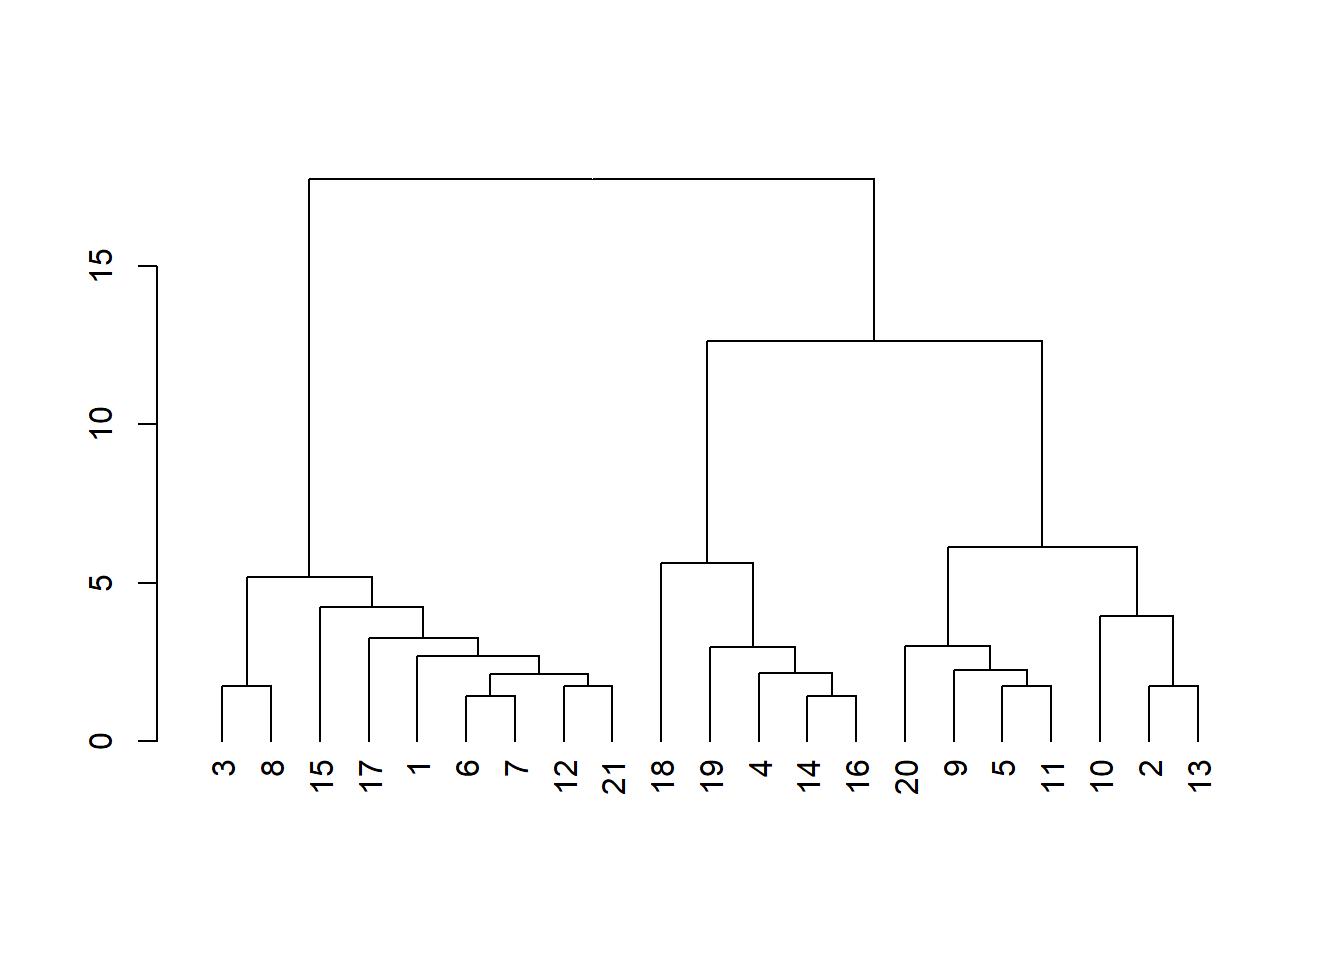
# Creando una lista de Dendrogramas
dend_list <- dendlist(dend1, dend2)

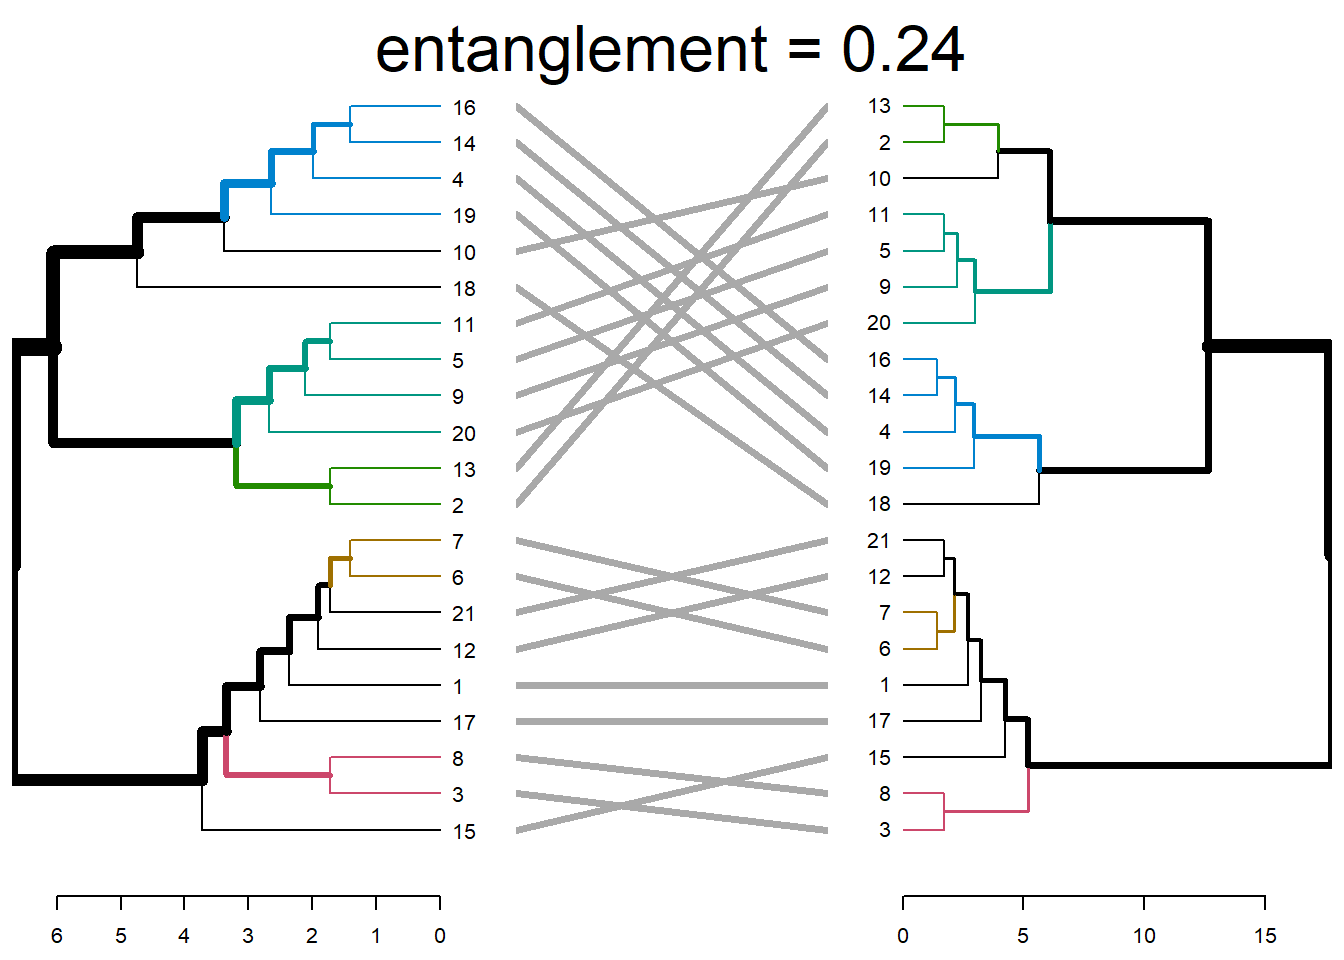
tanglegram(dend1, dend2)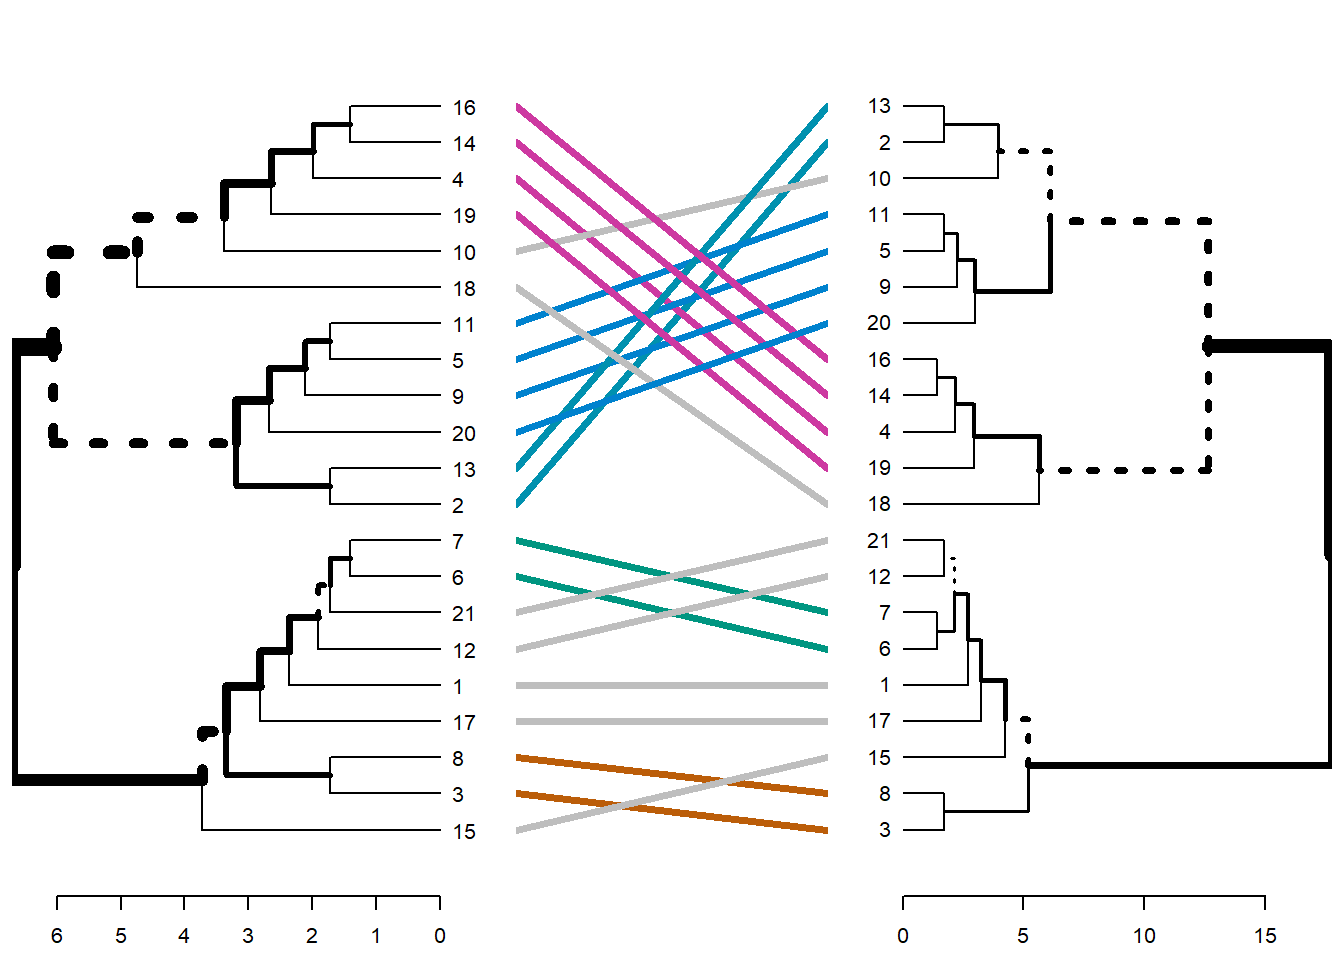
tanglegram(dend1, dend2,
           highlight_distinct_edges = FALSE, # Turn-off dashed lines
           common_subtrees_color_lines = FALSE, # Turn-off line colors
           common_subtrees_color_branches = TRUE, # Color common branches
           main = paste("entanglement =", round(entanglement(dend_list), 2))
)
Phylogenetics Trees
# Cladogram
library(ape)
d  <- dist(datosc, method = "euclidean")
hc <- hclust(d, method = "ward.D2")

plot(hc, cex=0.6, hang=-1)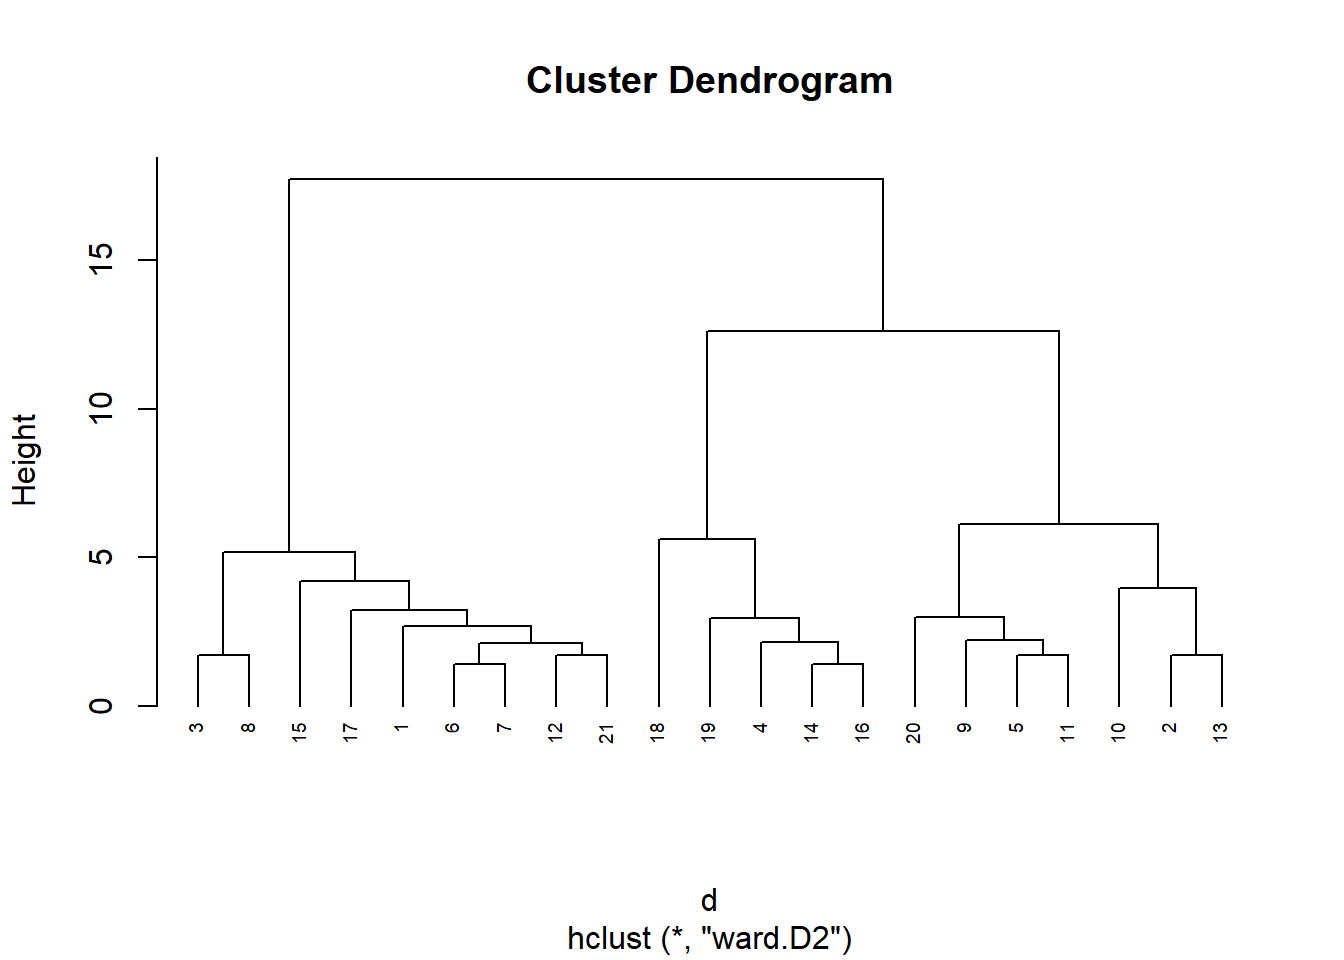
plot(as.phylo(hc), type = "cladogram", cex = 0.6,
     label.offset = 0.5)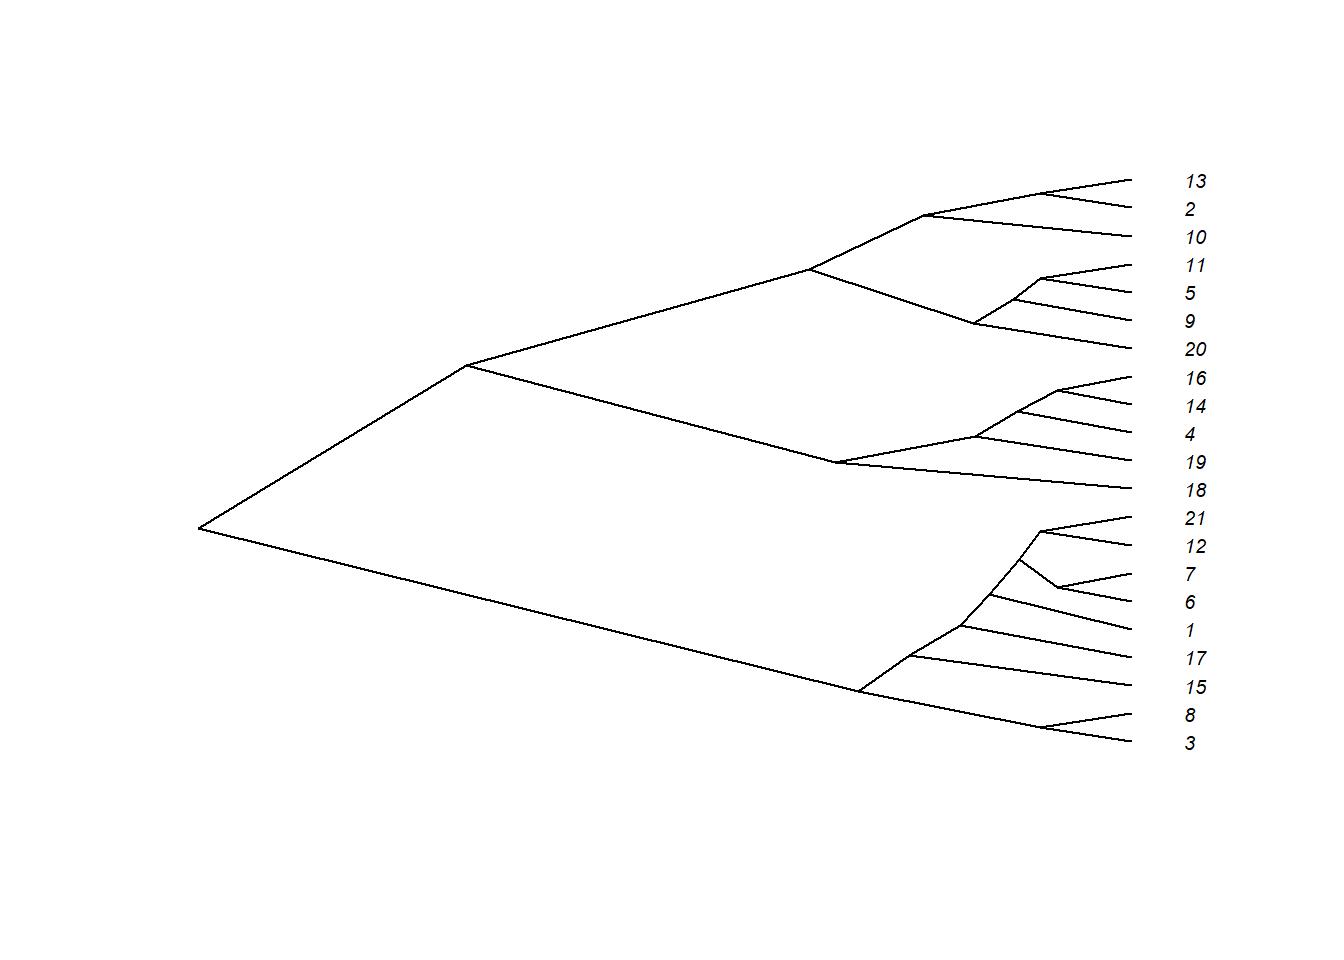
# Unrooted
plot(as.phylo(hc), type = "unrooted", cex = 0.6,
     no.margin = TRUE)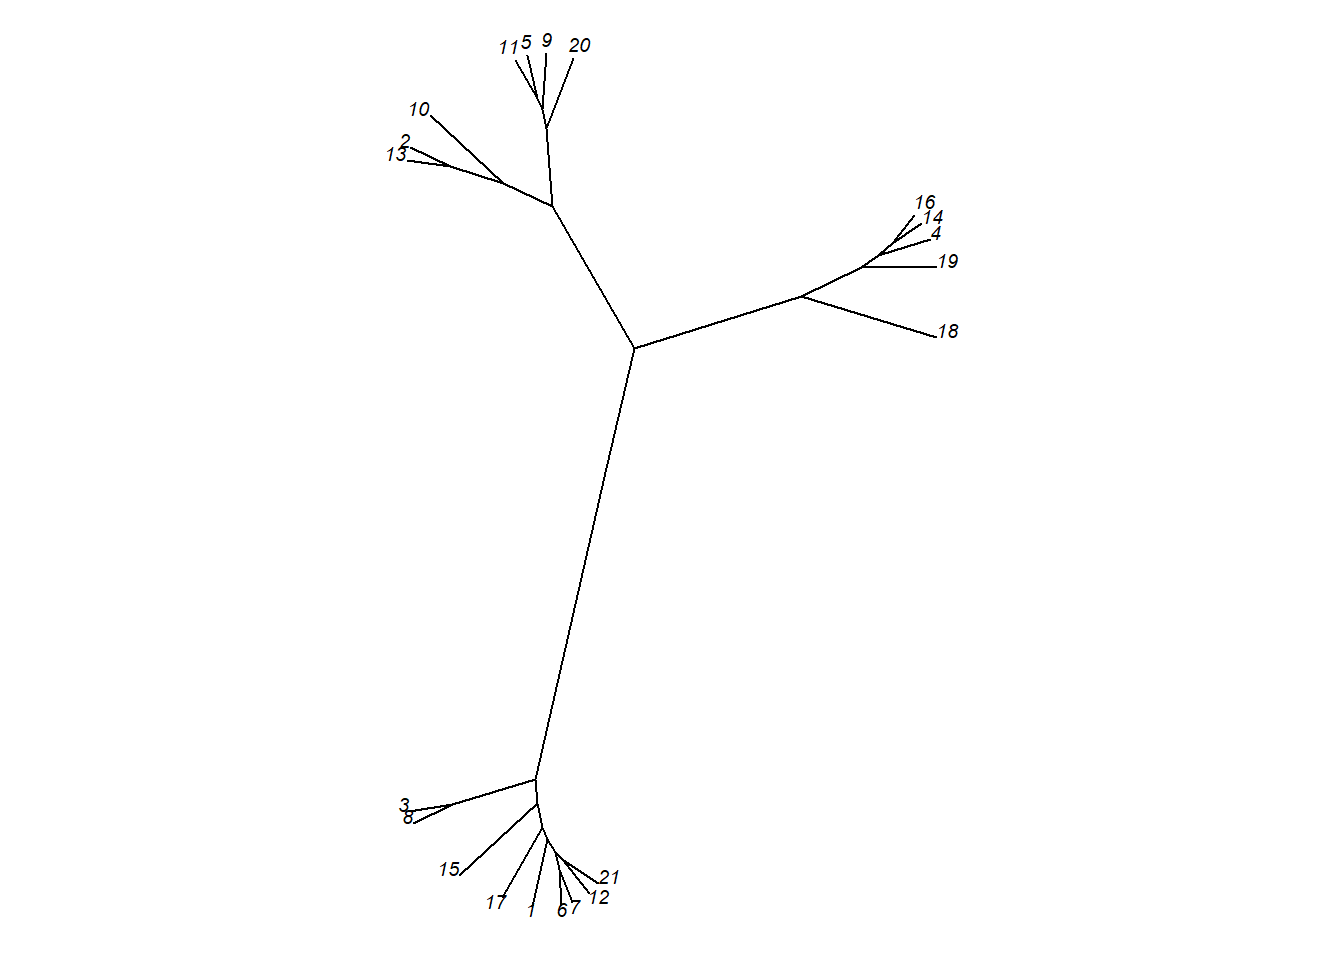
library(igraph)
fviz_dend(hc,k=3,k_colors="jco",
          type="phylogenic", repel=TRUE)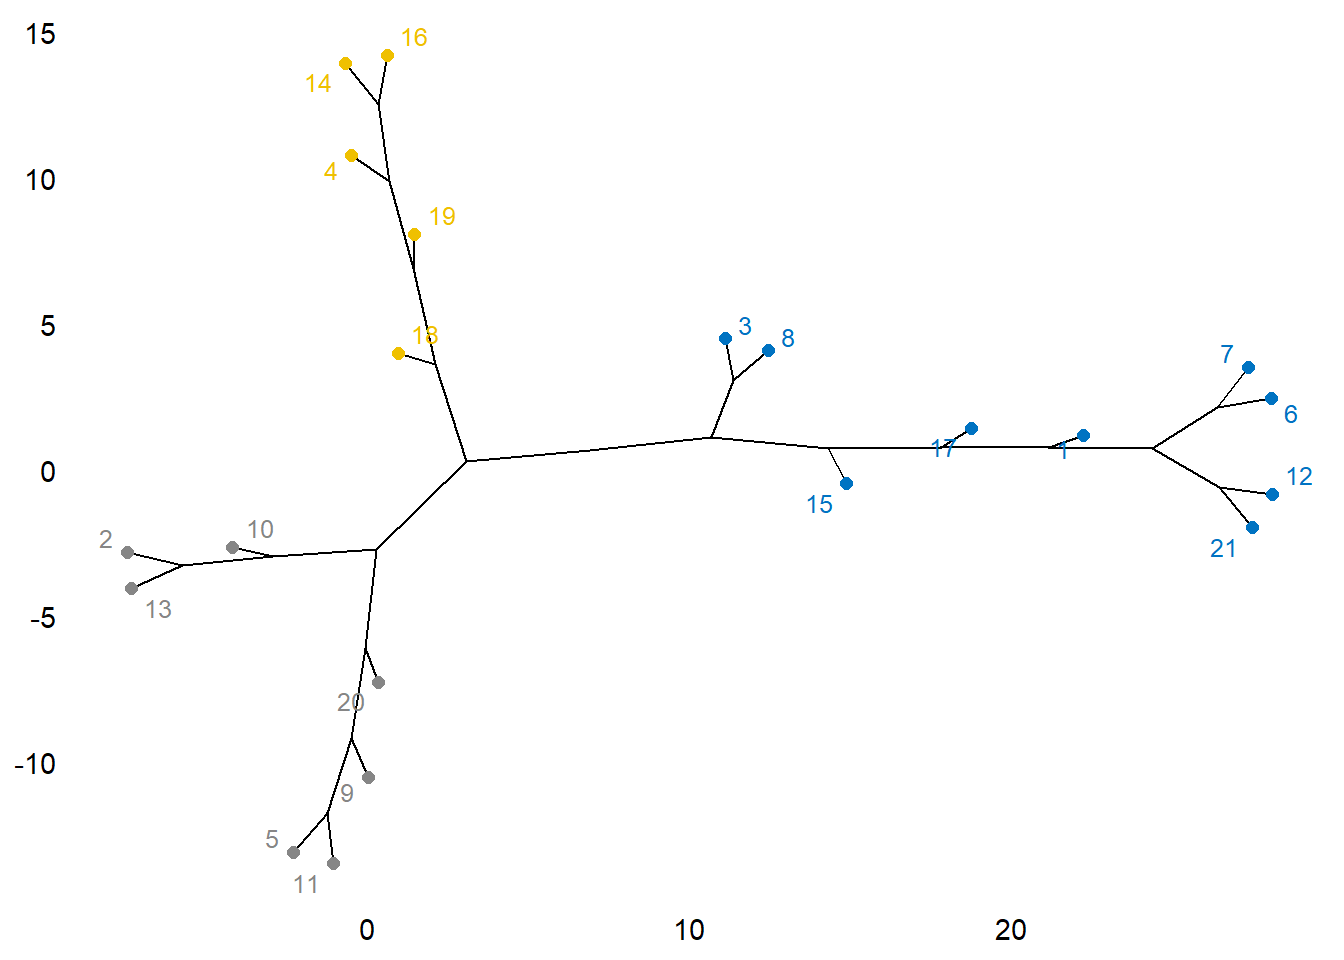
# Fan
# Gráfico de elise
plot(as.phylo(hc), type = "fan")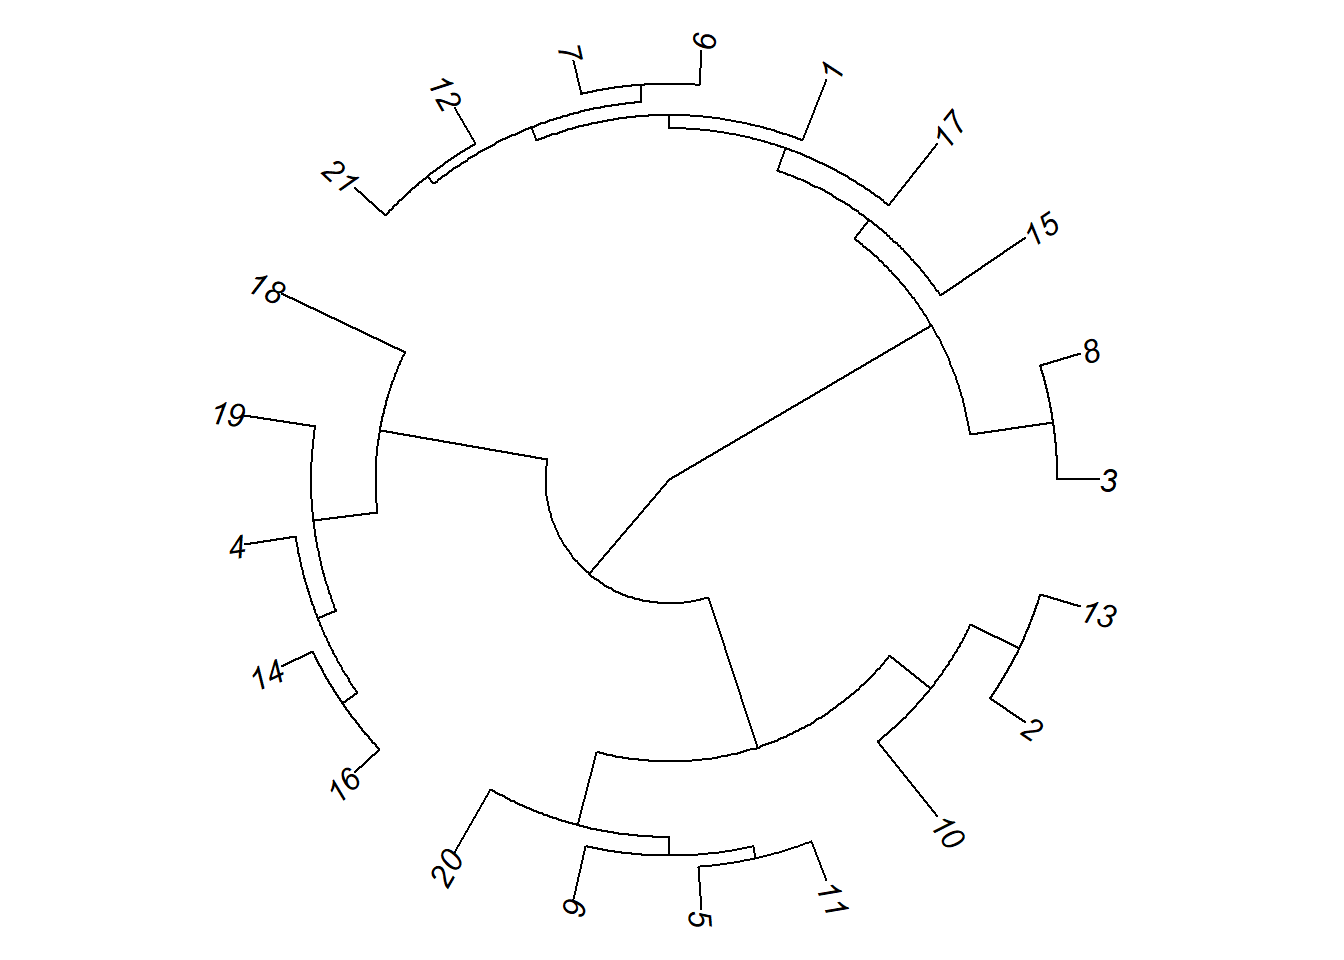
fviz_dend(hc, cex= 0.5, k=3, k_colors="jco",
          type="circular")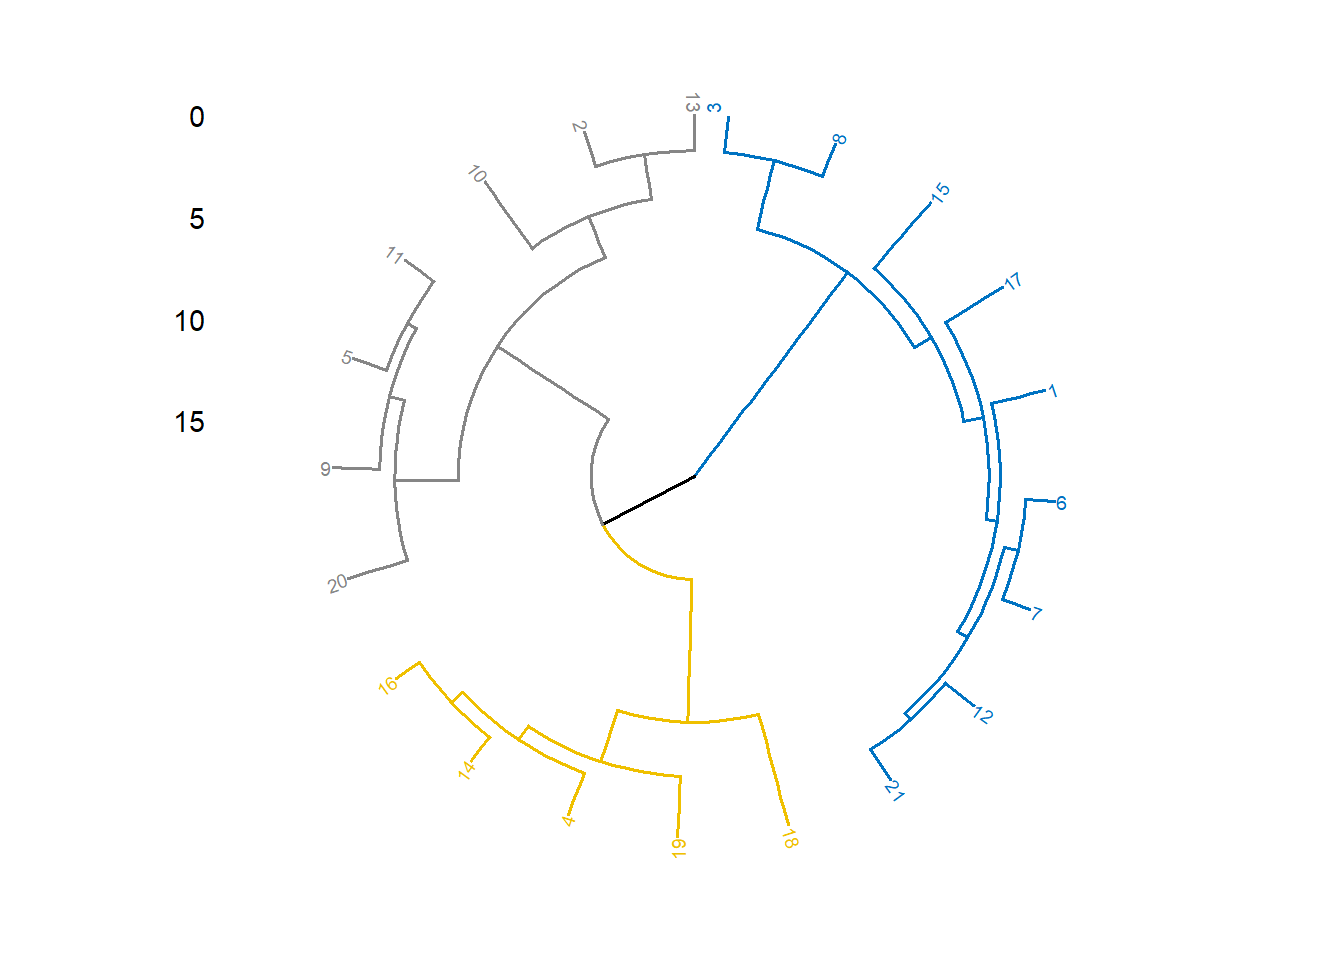
# Radial
plot(as.phylo(hc), type = "radial")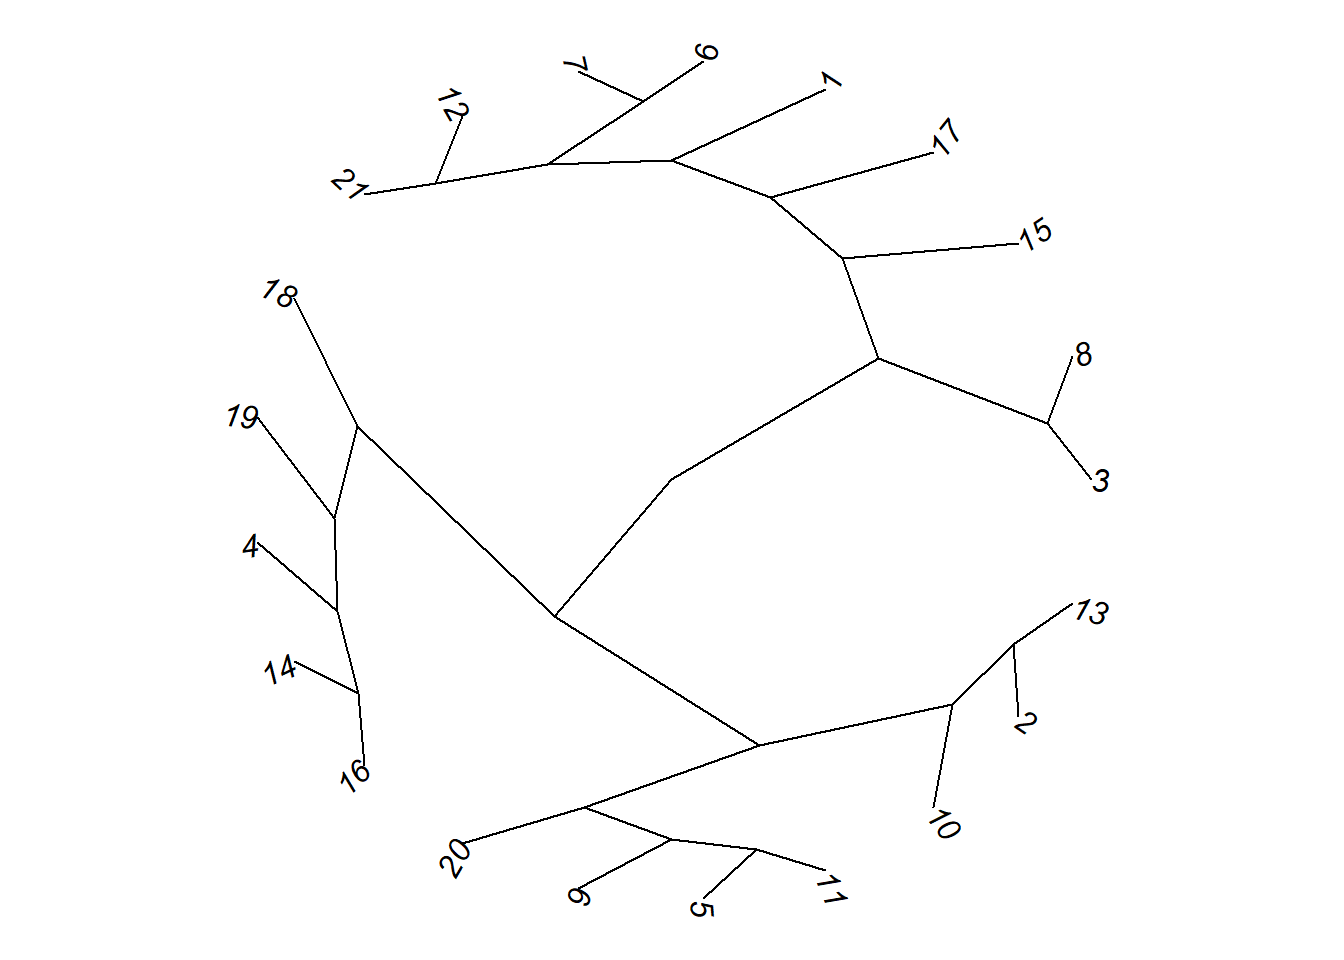
# Dividir el dendrograma en 3 clusters
colors <- c("red", "blue", "green", "black")
clus4 <- cutree(hc, 3)
plot(as.phylo(hc), type = "fan", tip.color = colors[clus4],
     label.offset = 1, cex = 0.7)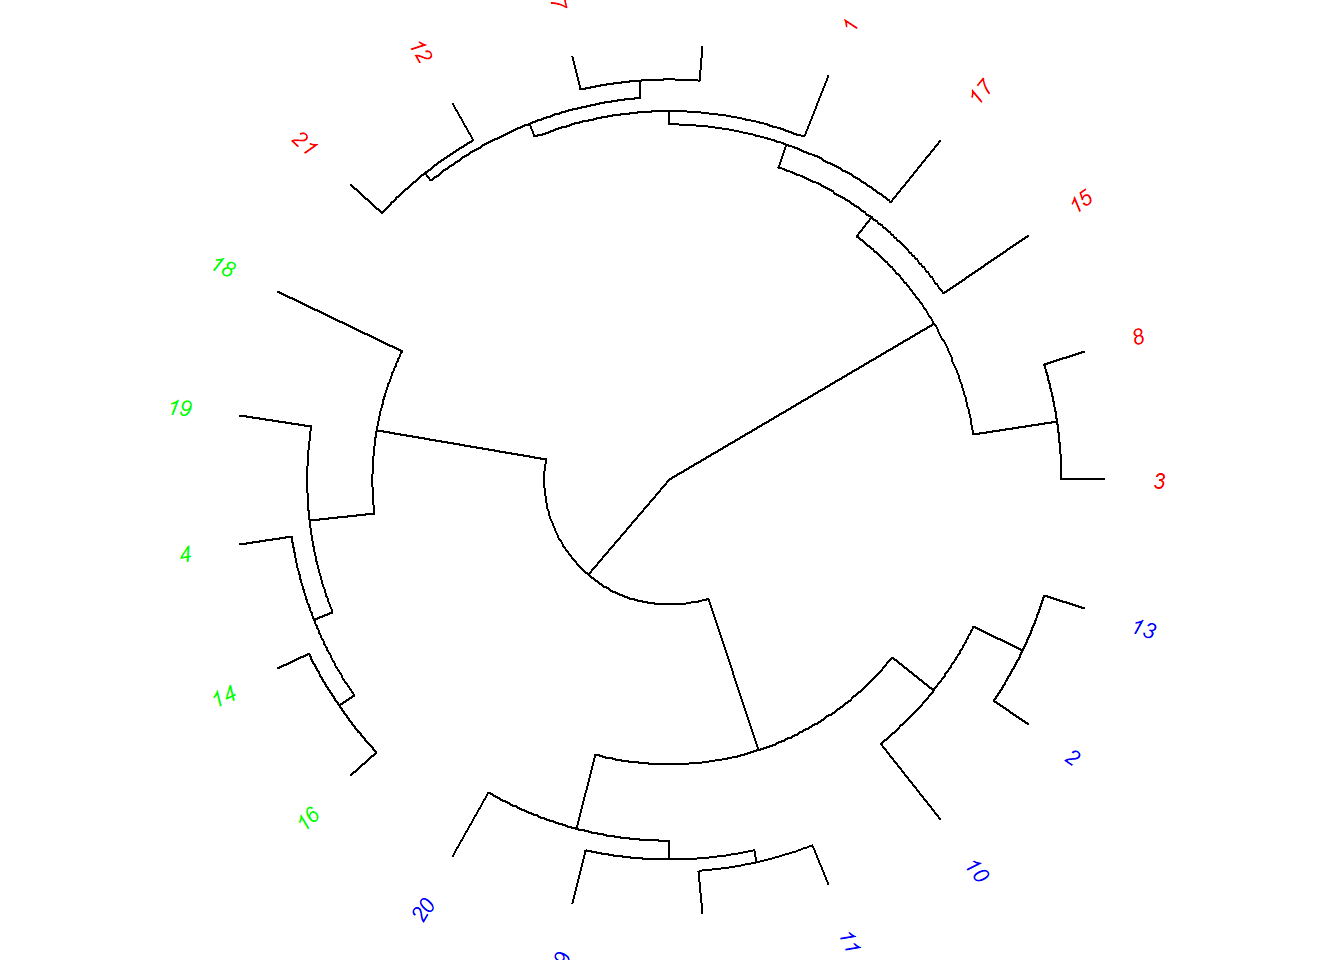
# Cambiando la apariencia
plot(as.phylo(hc), type = "cladogram", cex = 0.6,
     edge.color = "steelblue", edge.width = 2, edge.lty = 2,
     tip.color = "steelblue")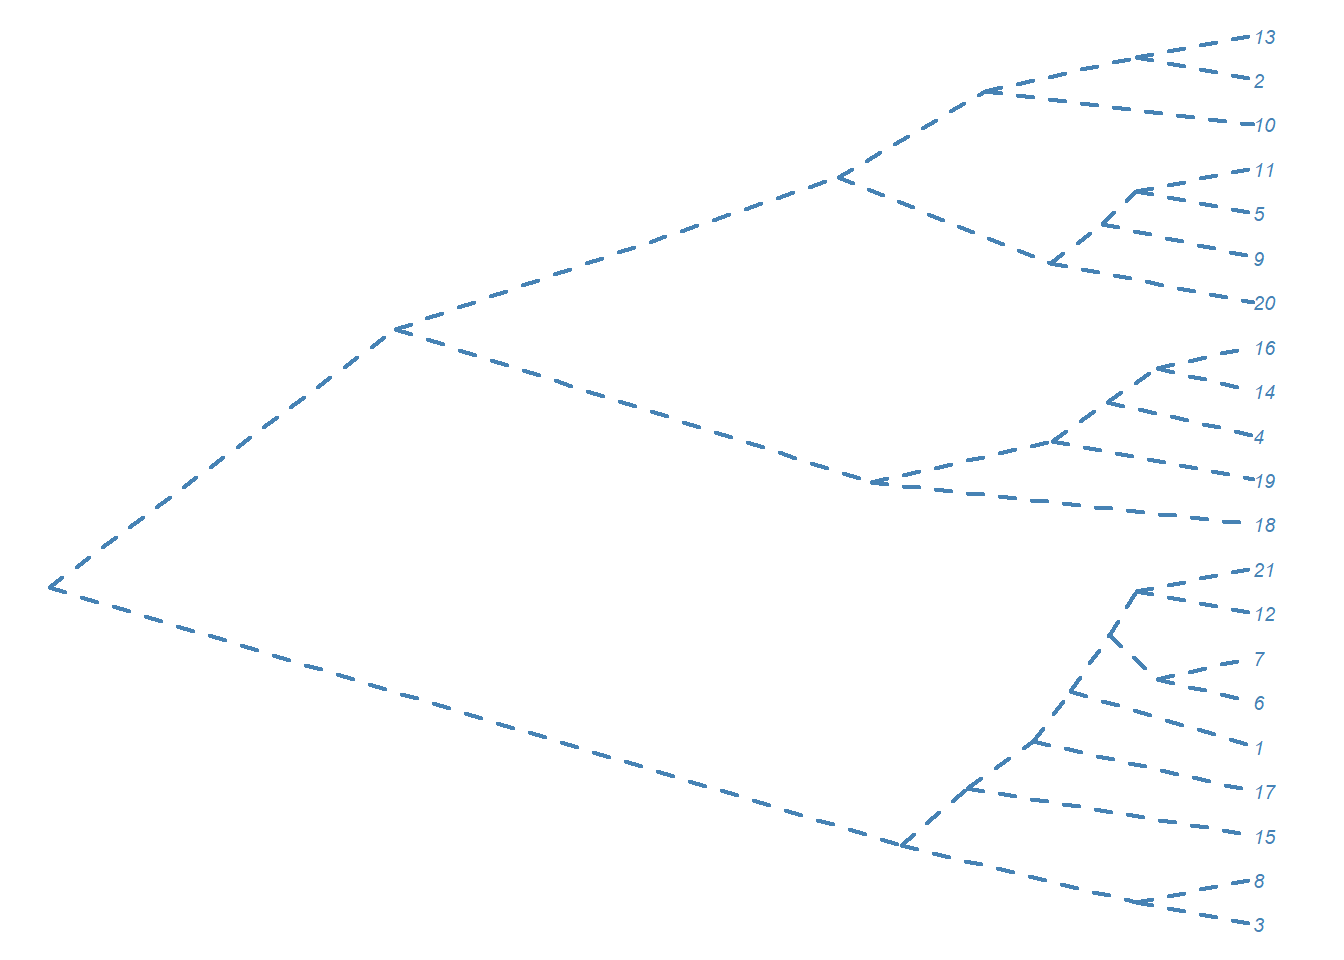
Cluster con métodos gráficos
Caras de Chernoff
library(aplpack)
aplpack::faces(datosc)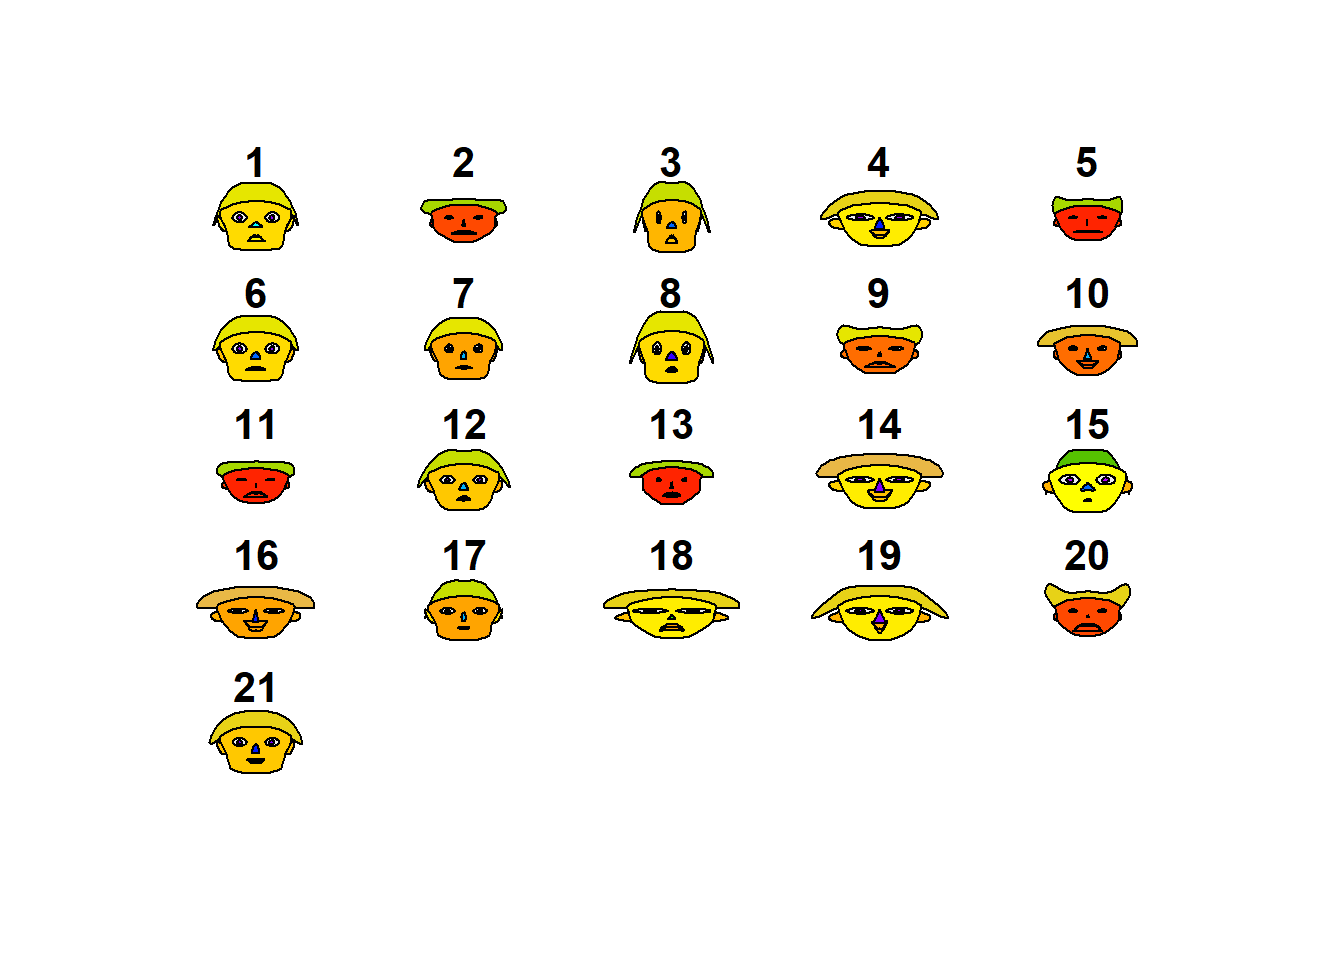
## effect of variables:
##  modified item       Var
##  "height of face   " "divertid"
##  "width of face    " "presupu"
##  "structure of face" "aprovech"
##  "height of mouth  " "buenacom"
##  "width of mouth   " "noimport"
##  "smiling          " "ahorro"
##  "height of eyes   " "divertid"
##  "width of eyes    " "presupu"
##  "height of hair   " "aprovech"
##  "width of hair   "  "buenacom"
##  "style of hair   "  "noimport"
##  "height of nose  "  "ahorro"
##  "width of nose   "  "divertid"
##  "width of ear    "  "presupu"
## "height of ear " "aprovech"aplpack::faces(datosc,face.type=0)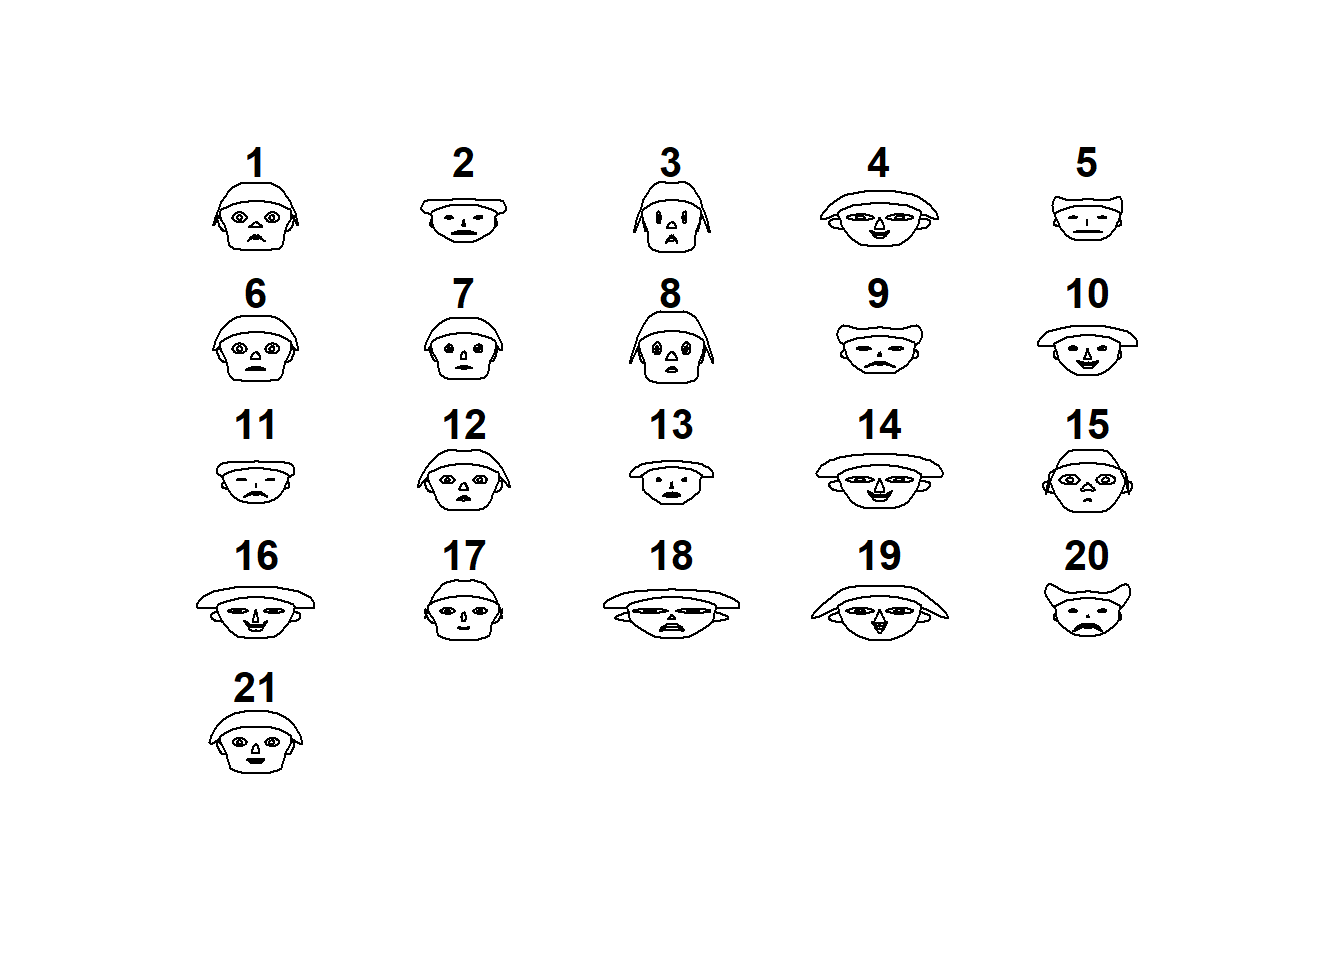
## effect of variables:
##  modified item       Var
##  "height of face   " "divertid"
##  "width of face    " "presupu"
##  "structure of face" "aprovech"
##  "height of mouth  " "buenacom"
##  "width of mouth   " "noimport"
##  "smiling          " "ahorro"
##  "height of eyes   " "divertid"
##  "width of eyes    " "presupu"
##  "height of hair   " "aprovech"
##  "width of hair   "  "buenacom"
##  "style of hair   "  "noimport"
##  "height of nose  "  "ahorro"
##  "width of nose   "  "divertid"
##  "width of ear    "  "presupu"
## "height of ear " "aprovech"aplpack::faces(datosc,face.type=1)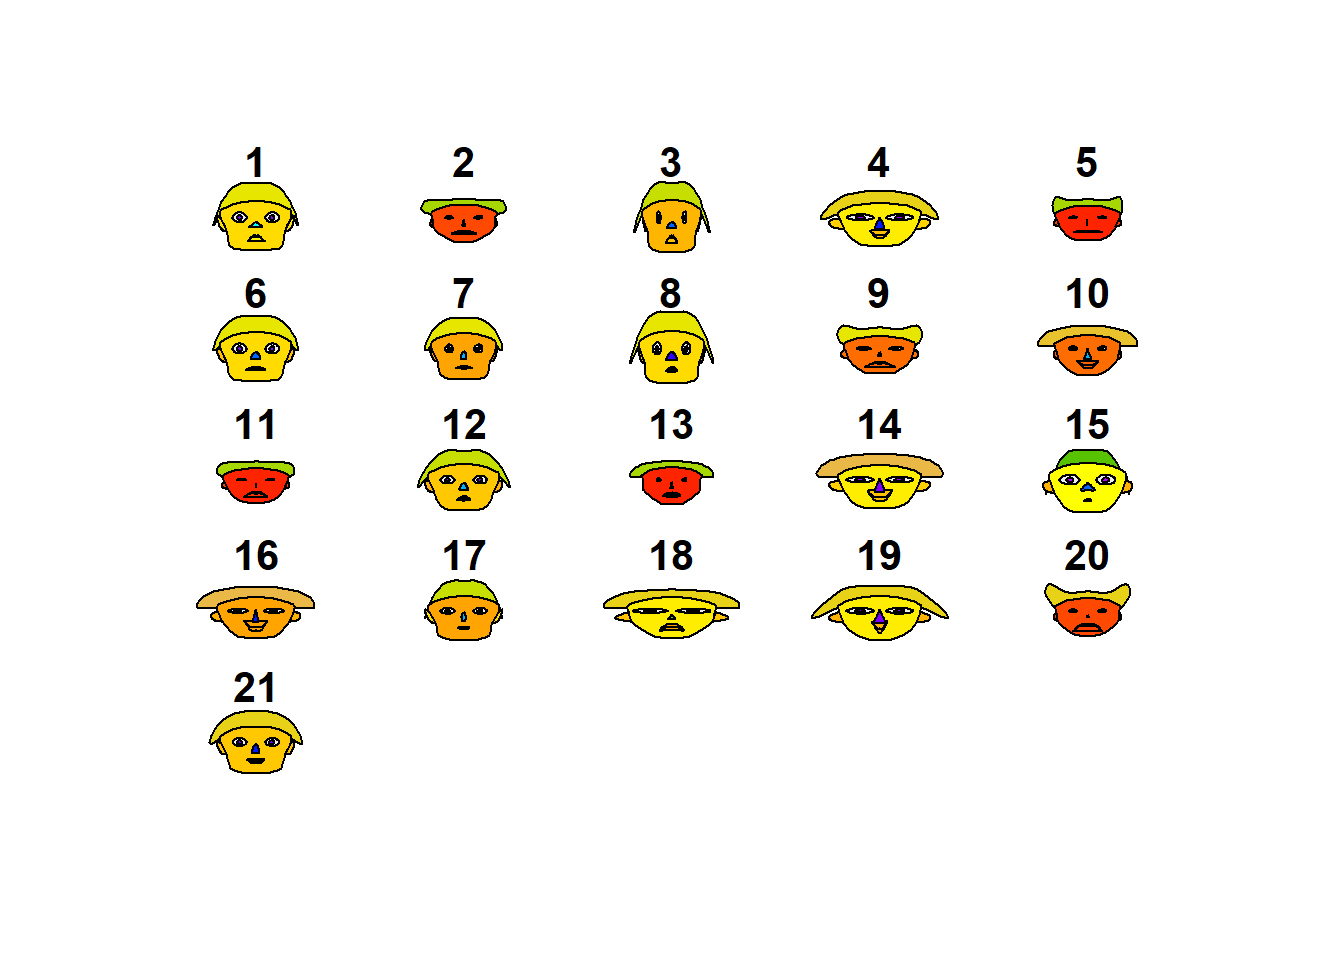
## effect of variables:
##  modified item       Var
##  "height of face   " "divertid"
##  "width of face    " "presupu"
##  "structure of face" "aprovech"
##  "height of mouth  " "buenacom"
##  "width of mouth   " "noimport"
##  "smiling          " "ahorro"
##  "height of eyes   " "divertid"
##  "width of eyes    " "presupu"
##  "height of hair   " "aprovech"
##  "width of hair   "  "buenacom"
##  "style of hair   "  "noimport"
##  "height of nose  "  "ahorro"
##  "width of nose   "  "divertid"
##  "width of ear    "  "presupu"
## "height of ear " "aprovech"aplpack::faces(datosc,face.type=2)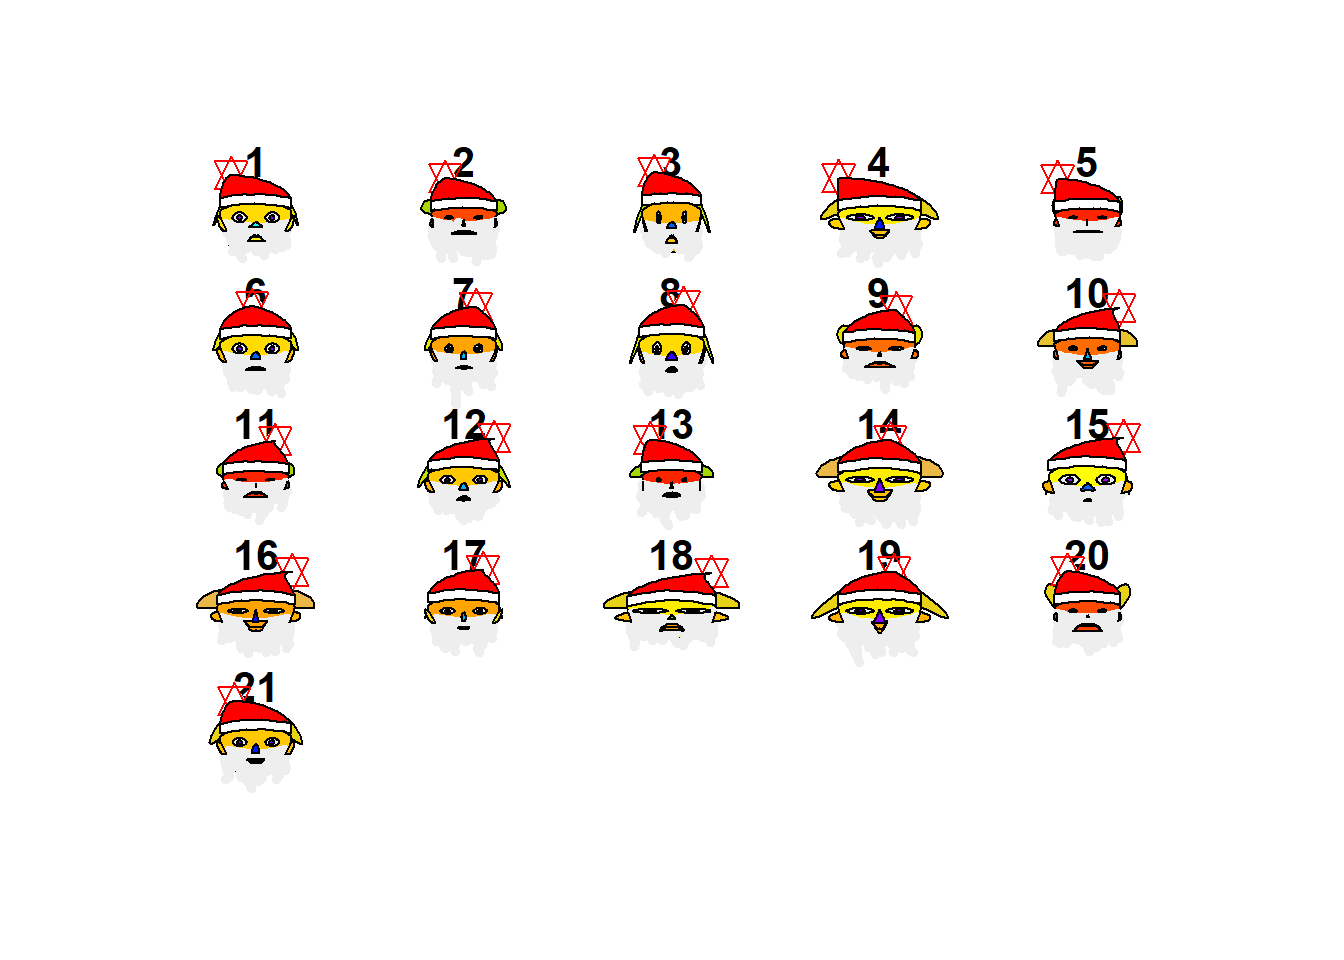
## effect of variables:
##  modified item       Var
##  "height of face   " "divertid"
##  "width of face    " "presupu"
##  "structure of face" "aprovech"
##  "height of mouth  " "buenacom"
##  "width of mouth   " "noimport"
##  "smiling          " "ahorro"
##  "height of eyes   " "divertid"
##  "width of eyes    " "presupu"
##  "height of hair   " "aprovech"
##  "width of hair   "  "buenacom"
##  "style of hair   "  "noimport"
##  "height of nose  "  "ahorro"
##  "width of nose   "  "divertid"
##  "width of ear    "  "presupu"
## "height of ear " "aprovech"library(TeachingDemos)
TeachingDemos::faces(datosc)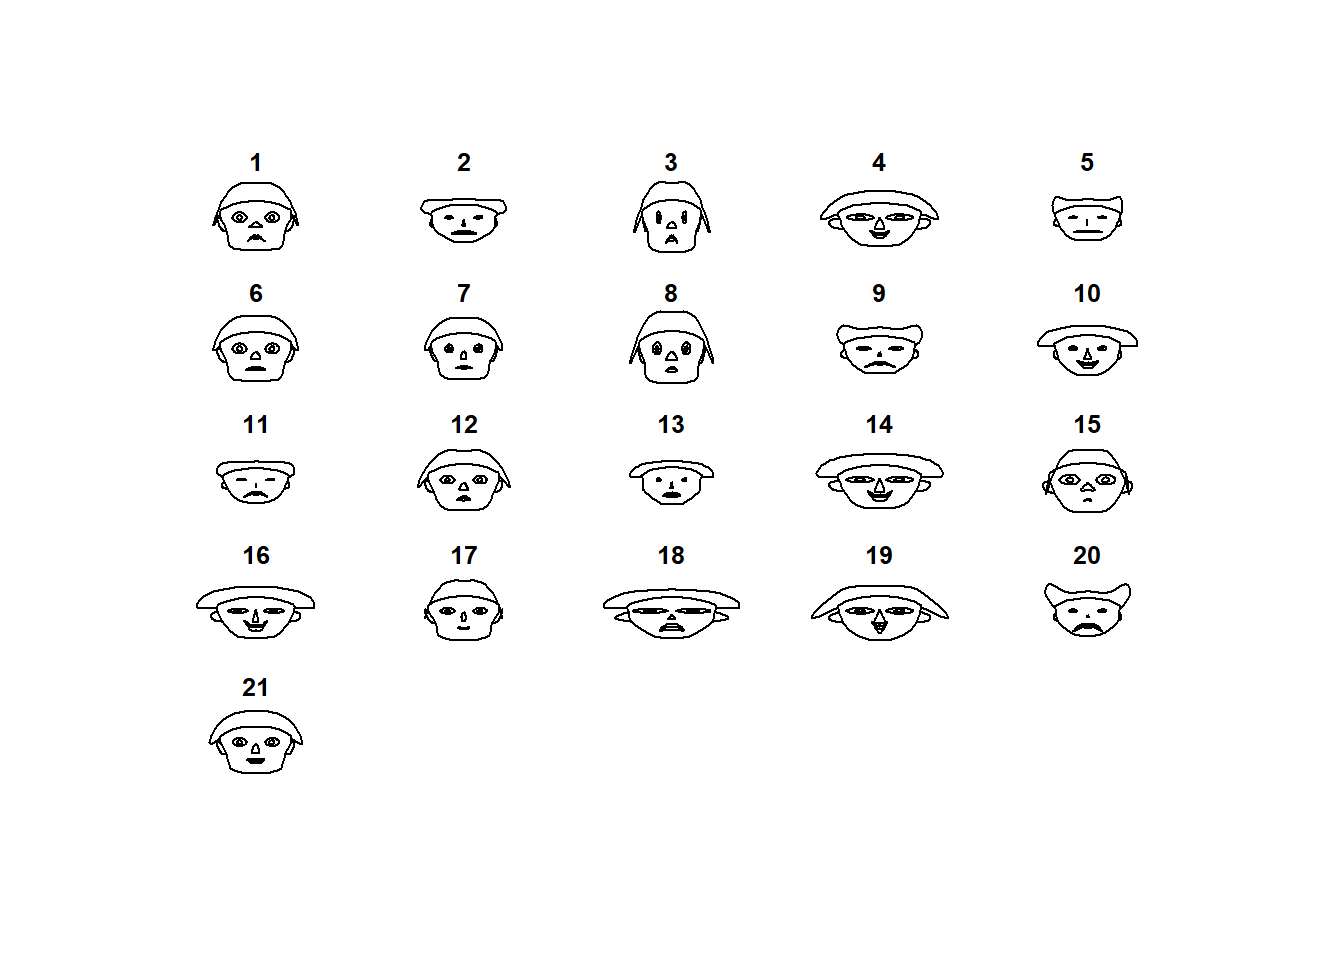
Gráfico de estrellas
stars(datosc,labels=seq(1,21))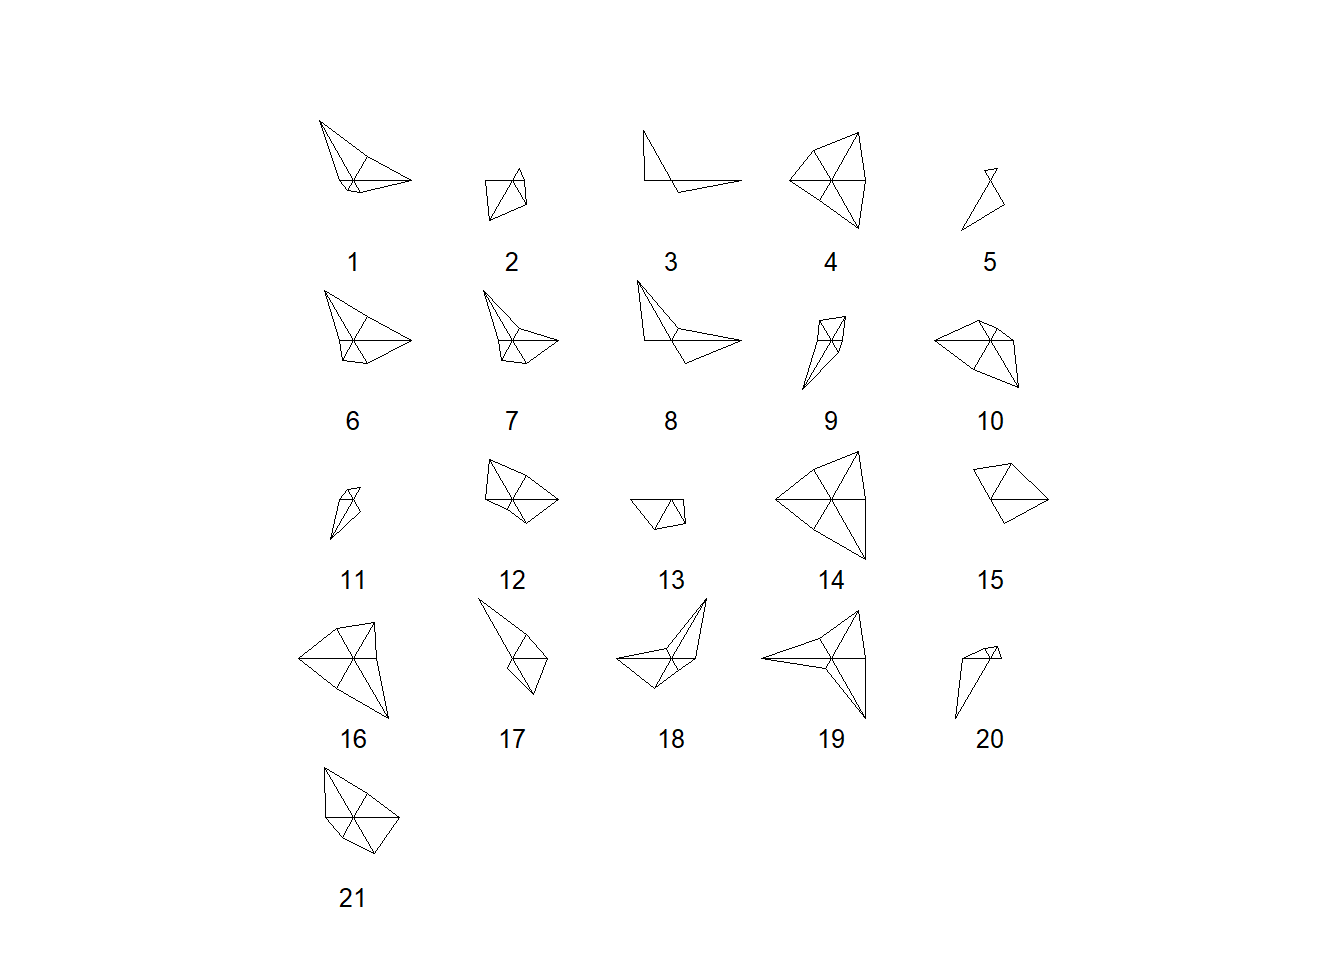
Cluster de Partición - No Jerárquicos
1. Usando el criterio del Gráfico de Silueta
library(factoextra)
set.seed(123)
fviz_nbclust(datosc, kmeans, method = "silhouette") +
  labs(subtitle = "Silhouette method")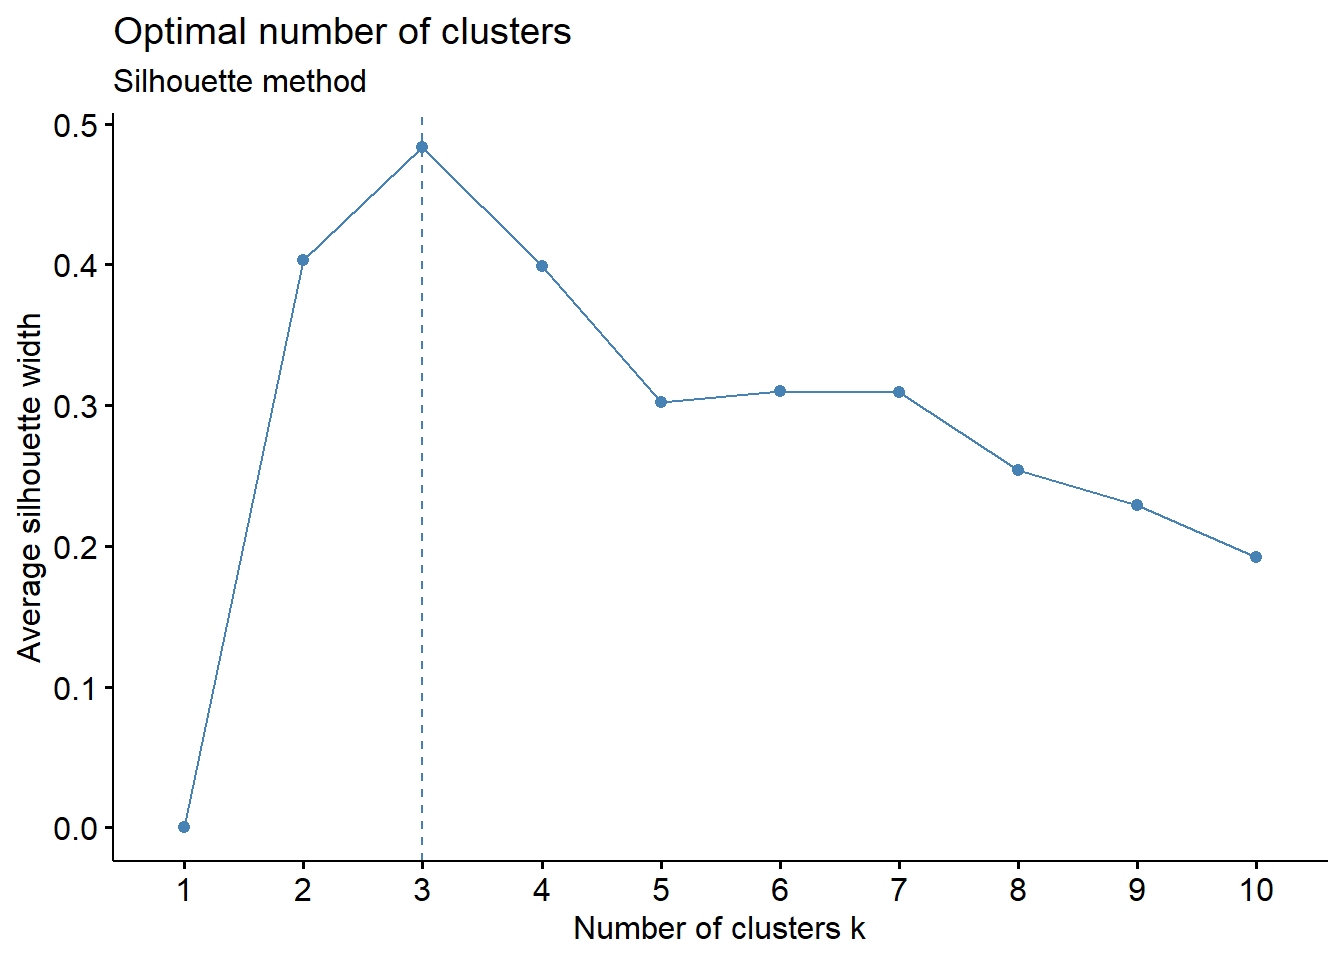
2. Usando el criterio de Suma de Cuadrados dentro de clusters
# Usando el paquete factoextra
library(factoextra)
set.seed(123)
wss <- numeric()
for(h in 1:10){
  b<-kmeans(datosc,h)
  wss[h]<-b$tot.withinss #scintra
}
wss
[1] 334.7 177.6 89.9 73.7 67.5 55.3 40.8 35.6 30.3 24.5wss1 <- data.frame(cluster=c(1:10),wss)
wss1 cluster wss
1 1 334.7
2 2 177.6
3 3 89.9
4 4 73.7
5 5 67.5
6 6 55.3
7 7 40.8
8 8 35.6
9 9 30.3
10 10 24.5# Gráficamos el cluster con la S.C.
library(ggplot2)
ggplot(wss1) + aes(cluster,wss) + geom_line(color="blue") +
geom_point(color="blue") +
geom_vline(xintercept = 3, linetype = 2, col="red") +
labs(title = "Método Elbow") +
scale_x_continuous(breaks=1:10) +
theme_classic()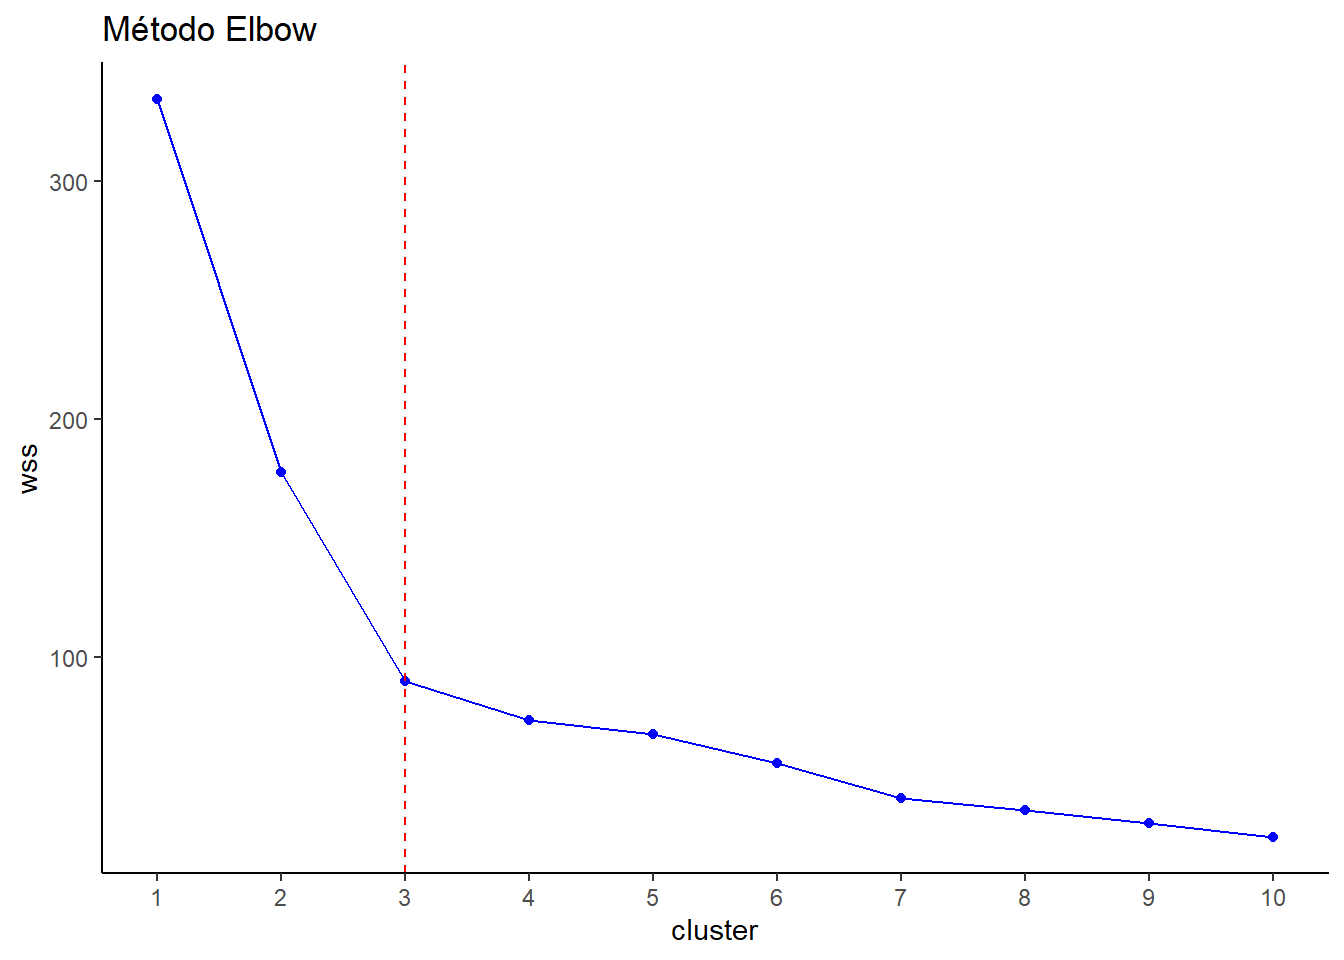
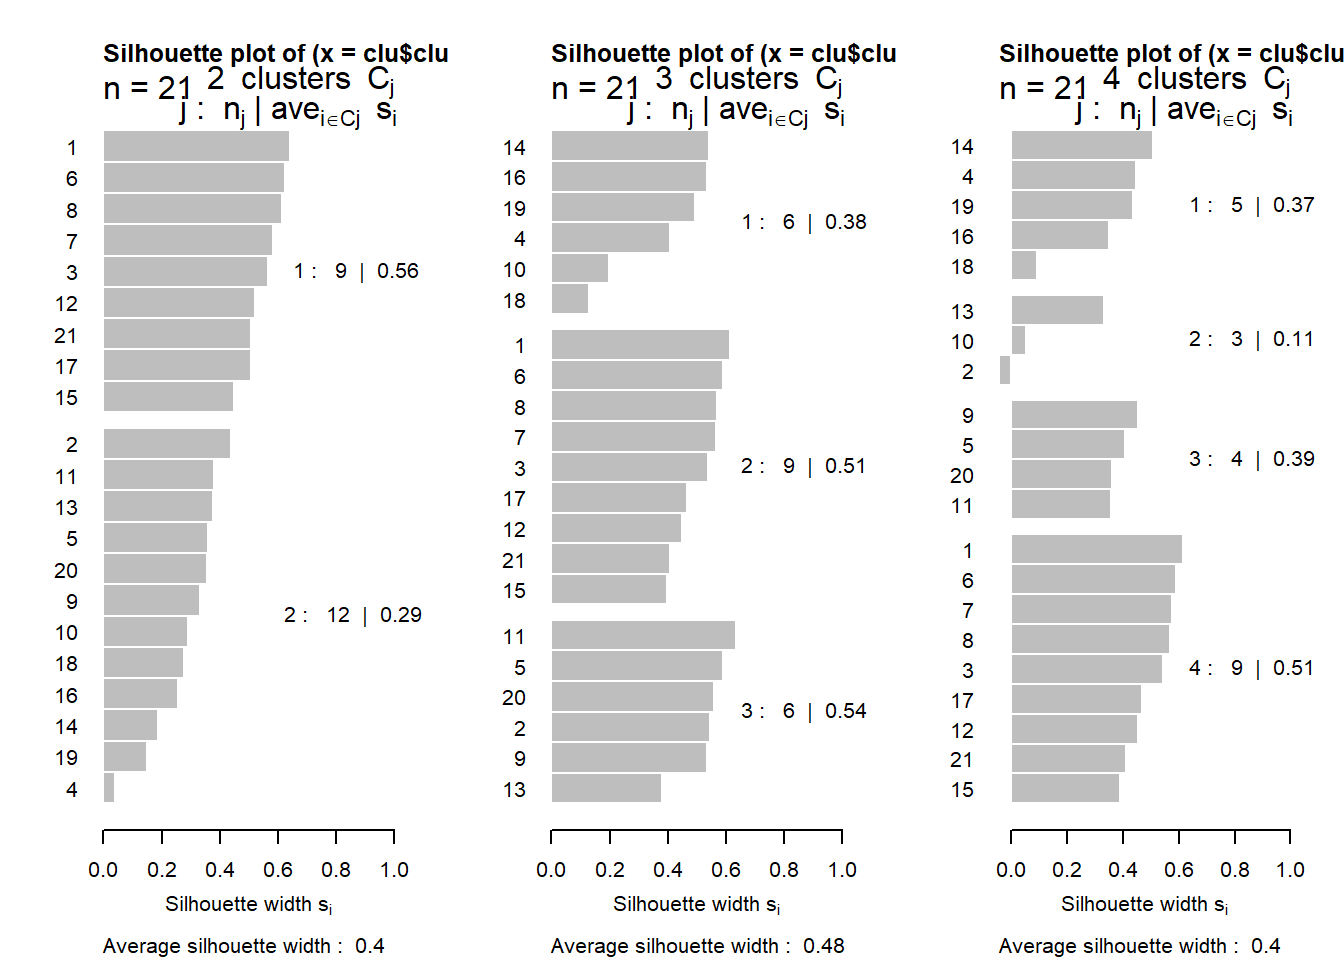
# Usando la función k-means
library(cluster)
set.seed(123)
diss.datos <- daisy(datosc)
par(mfrow=c(1,3))
for(h in 2:4){
  clu=kmeans(datosc,h)
  plot(silhouette(clu$cluster,diss.datos))
}
par(mfrow=c(1,1))3. NbClust: 30 Indices para determinar el número de clusters
library(NbClust)
set.seed(123)
res.nbclust <- NbClust(datosc, distance = "euclidean",
                       min.nc = 2, max.nc = 5,
method = "average", index ="all") 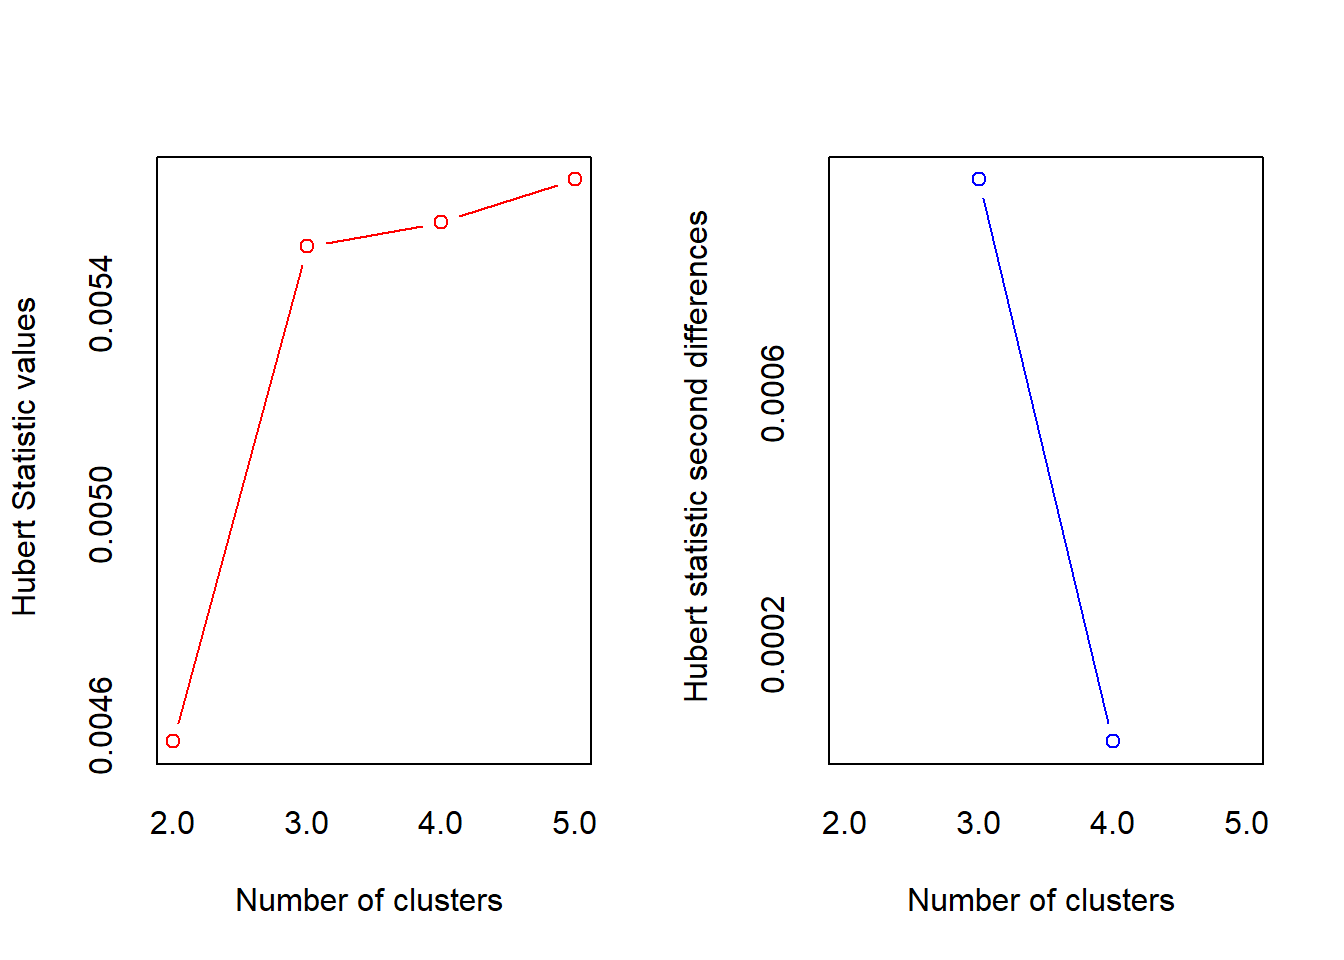
*** : The Hubert index is a graphical method of determining the number of clusters.
                In the plot of Hubert index, we seek a significant knee that corresponds to a
                significant increase of the value of the measure i.e the significant peak in Hubert
                index second differences plot.
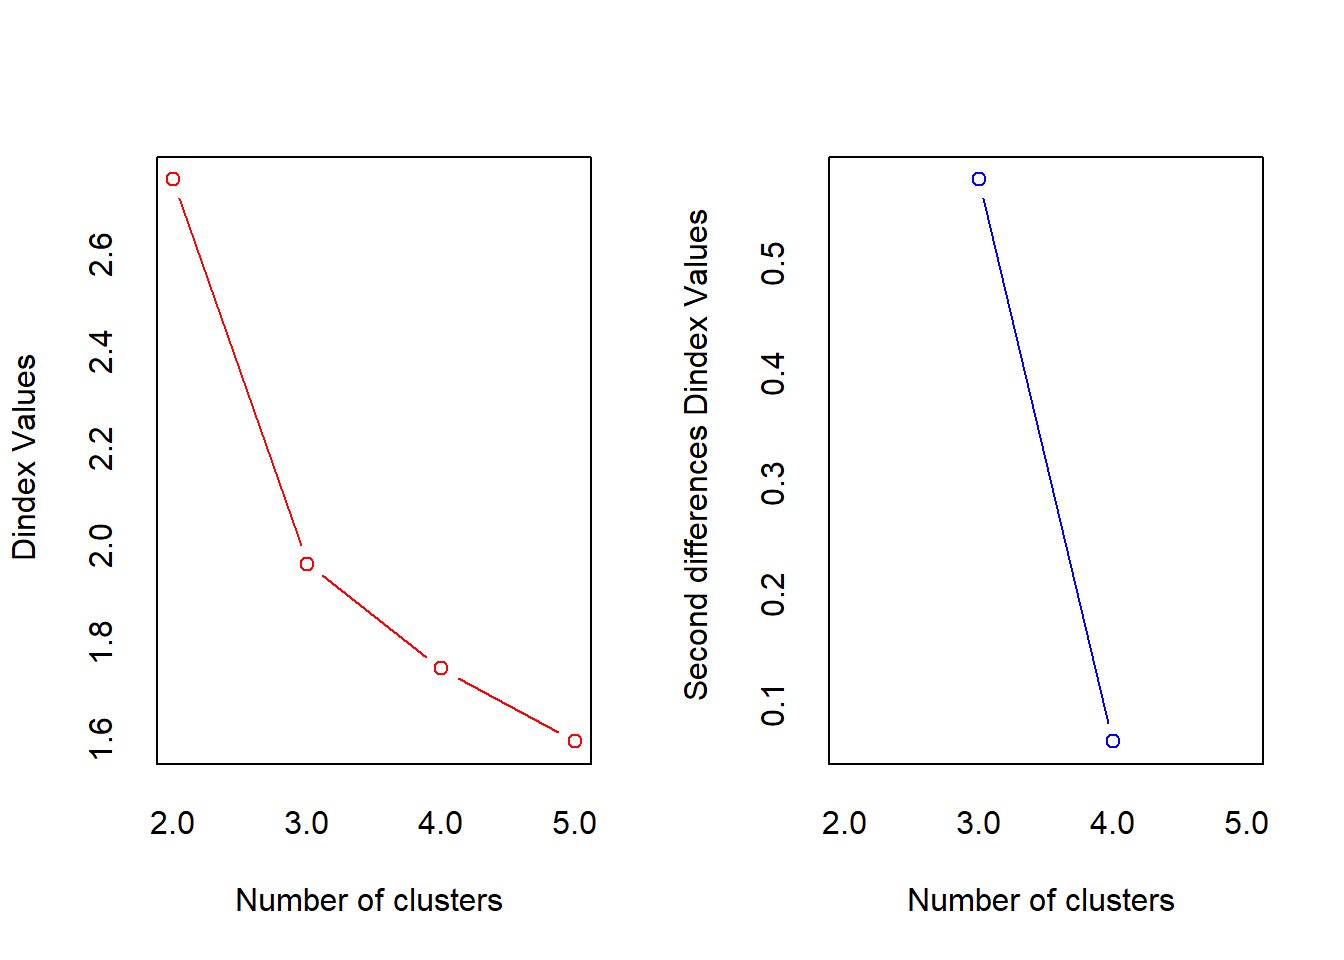
*** : The D index is a graphical method of determining the number of clusters.
                In the plot of D index, we seek a significant knee (the significant peak in Dindex
                second differences plot) that corresponds to a significant increase of the value of
                the measure.

*******************************************************************
* Among all indices:
* 2 proposed 2 as the best number of clusters
* 14 proposed 3 as the best number of clusters
* 4 proposed 4 as the best number of clusters
* 3 proposed 5 as the best number of clusters

                   ***** Conclusion *****

* According to the majority rule, the best number of clusters is  3


******************************************************************* res.nbclust$All.index KL CH Hartigan CCC Scott Marriot TrCovW TraceW Friedman Rubin Cindex
2 1.180 16.8 18.53 7.06 155 131173585 1483 177.6 182 13.2 0.374
3 7.394 24.5 3.97 8.66 199 35572266 317 89.9 223 26.0 0.430
4 1.792 20.1 2.50 8.24 230 14387782 227 73.7 318 31.7 0.489
5 0.961 16.8 2.23 7.24 260 5479556 194 64.2 443 36.4 0.454
DB Silhouette Duda Pseudot2 Beale Ratkowsky Ball Ptbiserial Frey
2 0.988 0.403 0.374 16.752 5.859 0.401 88.8 0.648 0.147
3 0.793 0.483 1.082 -0.302 -0.232 0.482 30.0 0.814 0.421
4 0.612 0.499 1.210 -1.217 -0.585 0.435 18.4 0.814 1.064
5 0.590 0.437 1.191 -0.482 -0.463 0.397 12.8 0.777 1.369
McClain Dunn Hubert SDindex Dindex SDbw
2 0.645 0.388 0.0046 0.603 2.75 0.505
3 1.001 0.650 0.0055 0.465 1.96 0.296
4 1.077 0.692 0.0056 0.450 1.74 0.181
5 1.273 0.590 0.0056 0.542 1.59 0.138factoextra::fviz_nbclust(res.nbclust) + theme_minimal()Among all indices:
===================
* 2 proposed 0 as the best number of clusters
* 1 proposed 1 as the best number of clusters
* 2 proposed 2 as the best number of clusters
* 14 proposed 3 as the best number of clusters
* 4 proposed 4 as the best number of clusters
* 3 proposed 5 as the best number of clusters
Conclusion
=========================
* According to the majority rule, the best number of clusters is 3 .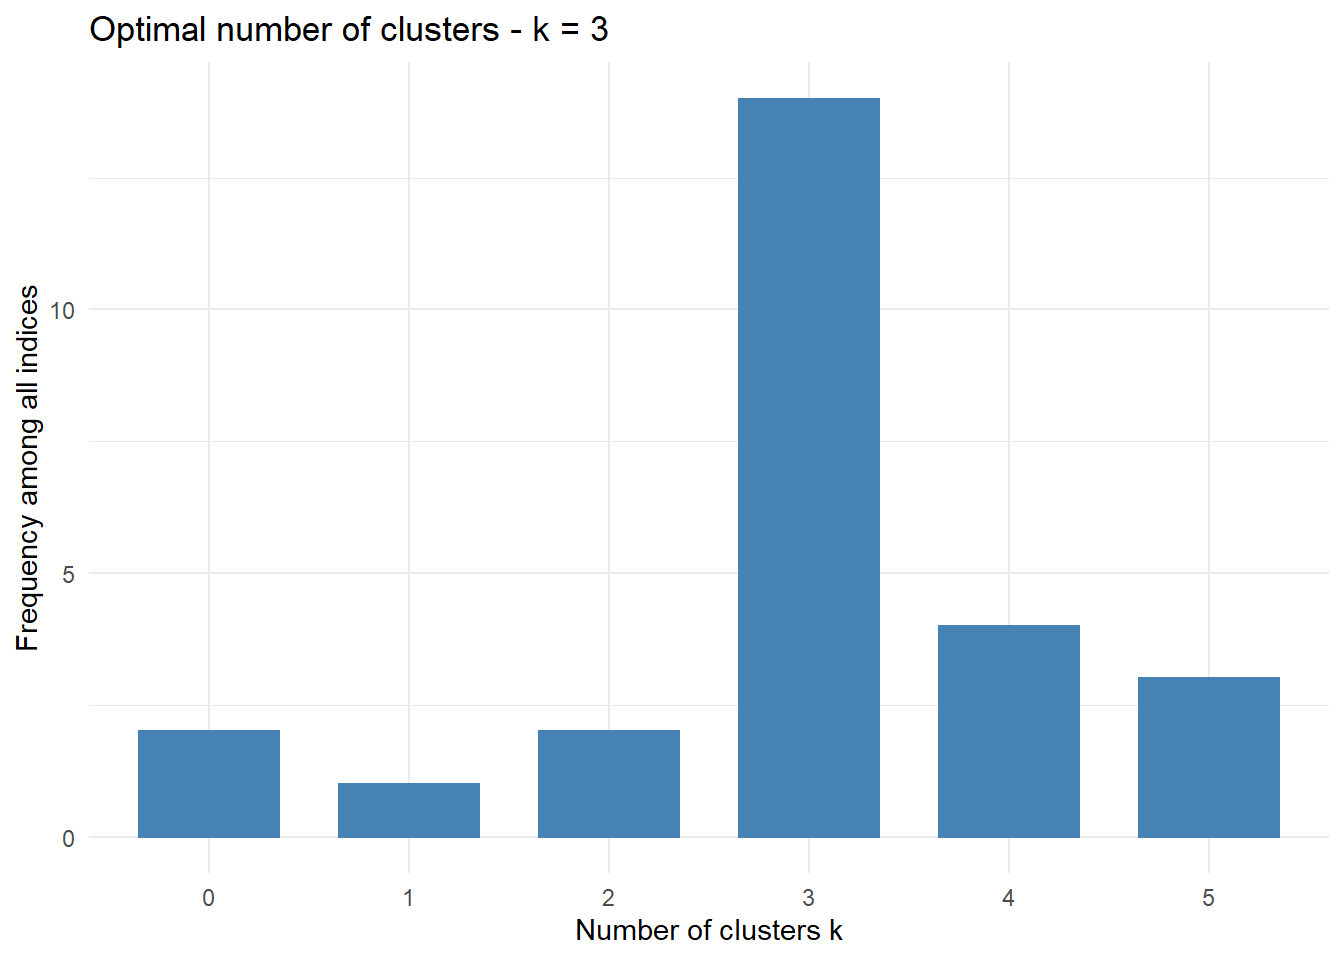
Métodos de particion: K-means
# Usando la funcion kmeans() con 3 clusters
# Indice de silueta de cada individuo
set.seed(123)
km <- kmeans(datosc,
             centers=3,      # Número de Cluster
             iter.max = 100, # Número de iteraciones máxima
             nstart = 25)    # Número de puntos iniciales

# Mostrar resumen de los clusters
print(km)
K-means clustering with 3 clusters of sizes 9, 6, 6
Cluster means:
  divertid presupu aprovech buenacom noimport ahorro
1     5.67    3.67     6.00     3.22      2.0   4.00
2     3.50    5.50     3.33     6.00      3.5   6.00
3     1.67    3.00     1.83     3.50      5.5   3.33
Clustering vector:
[1] 1 3 1 2 3 1 1 1 3 2 3 1 3 2 1 2 1 2 2 3 1
Within cluster sum of squares by cluster:
[1] 37.6 31.8 20.5
(between_SS / total_SS = 73.1 %)
Available components:
[1] "cluster" "centers" "totss" "withinss" "tot.withinss"
[6] "betweenss" "size" "iter" "ifault" # Sumas de cuadrados
km$withinss [1] 37.6 31.8 20.5km$tot.withinss [1] 89.9km$totss [1] 335km$betweenss[1] 245# Tamaño de cada cluster
km$size[1] 9 6 6# Promedios de cada cluster
km$centers divertid presupu aprovech buenacom noimport ahorro
1 5.67 3.67 6.00 3.22 2.0 4.00
2 3.50 5.50 3.33 6.00 3.5 6.00
3 1.67 3.00 1.83 3.50 5.5 3.33# Número de interaciones
km$iter[1] 2# Otra forma de obtener promedios de cada cluster
aggregate(datosc, by=list(cluster=km$cluster), mean) cluster divertid presupu aprovech buenacom noimport ahorro
1 1 5.67 3.67 6.00 3.22 2.0 4.00
2 2 3.50 5.50 3.33 6.00 3.5 6.00
3 3 1.67 3.00 1.83 3.50 5.5 3.33# Junta el archivo de datos con la columna de cluster
library(dplyr)
datosc %>% mutate(grp=km$cluster) -> datos.k
head(datos.k) divertid presupu aprovech buenacom noimport ahorro grp
1 6 4 7 3 2 3 1
2 2 3 1 4 5 4 3
3 7 2 6 4 1 3 1
4 4 6 4 5 3 6 2
5 1 3 2 2 6 4 3
6 6 4 6 3 3 4 1str(datos.k)'data.frame': 21 obs. of 7 variables:
$ divertid: num 6 2 7 4 1 6 5 7 2 3 ...
$ presupu : num 4 3 2 6 3 4 3 3 4 3 ...
$ aprovech: num 7 1 6 4 2 6 6 7 3 3 ...
$ buenacom: num 3 4 4 5 2 3 3 4 3 6 ...
$ noimport: num 2 5 1 3 6 3 3 1 6 4 ...
$ ahorro : num 3 4 3 6 4 4 4 4 3 6 ...
$ grp : int 1 3 1 2 3 1 1 1 3 2 ...
- attr(*, "codepage")= int 1252datos.k$grp <- factor(datos.k$grp)
# Visualización de las soluciones usando ACP
library(factoextra)
fviz_cluster(km,data=datosc,ellipse.type = "convex") +
theme_classic()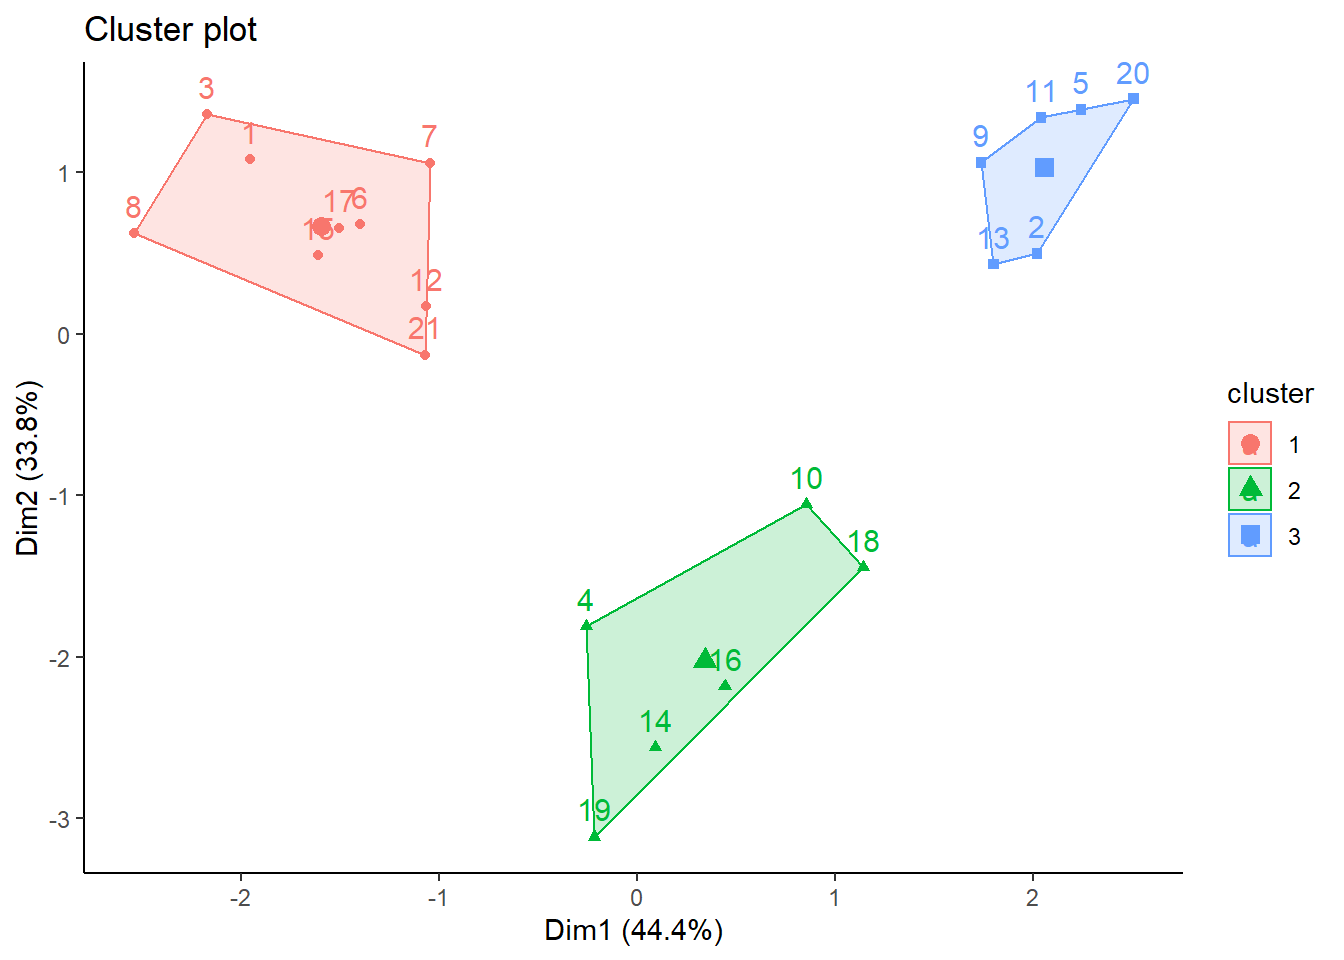
Métodos de particion: K-means++
# Usando la funcion kmansapp() con 3 clusters
library(LICORS)
set.seed(123)
kmpp <- kmeanspp(datosc,
                 k=3,
                 start="random",
                 nstart = 25,
                 iter.max=100)
kmpp
K-means clustering with 3 clusters of sizes 6, 9, 6
Cluster means:
  divertid presupu aprovech buenacom noimport ahorro
1     3.50    5.50     3.33     6.00      3.5   6.00
2     5.67    3.67     6.00     3.22      2.0   4.00
3     1.67    3.00     1.83     3.50      5.5   3.33
Clustering vector:
[1] 2 3 2 1 3 2 2 2 3 1 3 2 3 1 2 1 2 1 1 3 2
Within cluster sum of squares by cluster:
[1] 31.8 37.6 20.5
(between_SS / total_SS = 73.1 %)
Available components:
[1] "cluster" "centers" "totss" "withinss"
[5] "tot.withinss" "betweenss" "size" "iter"
[9] "ifault" "inicial.centers"kmpp$withinss [1] 31.8 37.6 20.5kmpp$tot.withinss[1] 89.9kmpp$totss [1] 335kmpp$betweenss [1] 245# Tamaño de cada cluster
kmpp$size[1] 6 9 6# Promedios de cada cluster
kmpp$centers divertid presupu aprovech buenacom noimport ahorro
1 3.50 5.50 3.33 6.00 3.5 6.00
2 5.67 3.67 6.00 3.22 2.0 4.00
3 1.67 3.00 1.83 3.50 5.5 3.33# Otra forma de obtener promedios de cada cluster
aggregate(datosc, by=list(cluster=kmpp$cluster), mean) cluster divertid presupu aprovech buenacom noimport ahorro
1 1 3.50 5.50 3.33 6.00 3.5 6.00
2 2 5.67 3.67 6.00 3.22 2.0 4.00
3 3 1.67 3.00 1.83 3.50 5.5 3.33# Junta el archivo de datos con la columna de cluster
datos.kpp <- cbind(datosc,grp=as.factor(kmpp$cluster))
head(datos.kpp) divertid presupu aprovech buenacom noimport ahorro grp
1 6 4 7 3 2 3 2
2 2 3 1 4 5 4 3
3 7 2 6 4 1 3 2
4 4 6 4 5 3 6 1
5 1 3 2 2 6 4 3
6 6 4 6 3 3 4 2str(datos.kpp)'data.frame': 21 obs. of 7 variables:
$ divertid: num 6 2 7 4 1 6 5 7 2 3 ...
$ presupu : num 4 3 2 6 3 4 3 3 4 3 ...
$ aprovech: num 7 1 6 4 2 6 6 7 3 3 ...
$ buenacom: num 3 4 4 5 2 3 3 4 3 6 ...
$ noimport: num 2 5 1 3 6 3 3 1 6 4 ...
$ ahorro : num 3 4 3 6 4 4 4 4 3 6 ...
$ grp : Factor w/ 3 levels "1","2","3": 2 3 2 1 3 2 2 2 3 1 ...Cluster K-Means Jerárquico
# Calcular el hierarchical k-means clustering
library(factoextra)

res.hk<- hkmeans(datosc,3,
                 hc.metric="euclidean",
                 hc.method="ward.D2",
                 iter.max=10)

names(res.hk)
[1] "cluster" "centers" "totss" "withinss" "tot.withinss"
[6] "betweenss" "size" "iter" "ifault" "data"
[11] "hclust" res.hkHierarchical K-means clustering with 3 clusters of sizes 9, 6, 6
Cluster means:
divertid presupu aprovech buenacom noimport ahorro
1 5.67 3.67 6.00 3.22 2.0 4.00
2 1.67 3.00 1.83 3.50 5.5 3.33
3 3.50 5.50 3.33 6.00 3.5 6.00
Clustering vector:
[1] 1 2 1 3 2 1 1 1 2 3 2 1 2 3 1 3 1 3 3 2 1
Within cluster sum of squares by cluster:
[1] 37.6 20.5 31.8
(between_SS / total_SS = 73.1 %)
Available components:
 [1] "cluster"      "centers"      "totss"        "withinss"     "tot.withinss"
 [6] "betweenss"    "size"         "iter"         "ifault"       "data"
[11] "hclust" res.hk$cluster [1] 1 2 1 3 2 1 1 1 2 3 2 1 2 3 1 3 1 3 3 2 1head(cbind(datosc,cluster=res.hk$cluster)) divertid presupu aprovech buenacom noimport ahorro cluster
1 6 4 7 3 2 3 1
2 2 3 1 4 5 4 2
3 7 2 6 4 1 3 1
4 4 6 4 5 3 6 3
5 1 3 2 2 6 4 2
6 6 4 6 3 3 4 1res.hk$centers divertid presupu aprovech buenacom noimport ahorro
1 5.67 3.67 6.00 3.22 2.0 4.00
2 1.67 3.00 1.83 3.50 5.5 3.33
3 3.50 5.50 3.33 6.00 3.5 6.00res.hk$size[1] 9 6 6datos.hk <- cbind(datosc,grp=as.factor(res.hk$cluster))Cluster con el paquete H2O
library(h2o)
localH2O <- h2o.init(nthreads = -1, max_mem_size = "4g")
Connection successful!
R is connected to the H2O cluster:
H2O cluster uptime: 39 minutes 6 seconds
H2O cluster timezone: America/Bogota
H2O data parsing timezone: UTC
H2O cluster version: 3.34.0.3
H2O cluster version age: 3 months and 10 days !!!
H2O cluster name: H2O_started_from_R_Casa_syt588
H2O cluster total nodes: 1
H2O cluster total memory: 3.55 GB
H2O cluster total cores: 4
H2O cluster allowed cores: 4
H2O cluster healthy: TRUE
H2O Connection ip: localhost
H2O Connection port: 54321
H2O Connection proxy: NA
H2O Internal Security: FALSE
H2O API Extensions: Amazon S3, Algos, AutoML, Core V3, TargetEncoder, Core V4
R Version: R version 4.1.2 (2021-11-01) h2o.init() Connection successful!
R is connected to the H2O cluster:
H2O cluster uptime: 39 minutes 6 seconds
H2O cluster timezone: America/Bogota
H2O data parsing timezone: UTC
H2O cluster version: 3.34.0.3
H2O cluster version age: 3 months and 10 days !!!
H2O cluster name: H2O_started_from_R_Casa_syt588
H2O cluster total nodes: 1
H2O cluster total memory: 3.55 GB
H2O cluster total cores: 4
H2O cluster allowed cores: 4
H2O cluster healthy: TRUE
H2O Connection ip: localhost
H2O Connection port: 54321
H2O Connection proxy: NA
H2O Internal Security: FALSE
H2O API Extensions: Amazon S3, Algos, AutoML, Core V3, TargetEncoder, Core V4
R Version: R version 4.1.2 (2021-11-01) # Convirtiendo a formato h2o
my_data.h2o <- as.h2o(datosc)
  |
  |                                                                      |   0%
  |
|======================================================================| 100%str(my_data.h2o)Class 'H2OFrame' <environment: 0x000000004483a0f0>
- attr(*, "op")= chr "Parse"
- attr(*, "id")= chr "datosc_sid_85b9_1"
- attr(*, "eval")= logi FALSE
- attr(*, "nrow")= int 21
- attr(*, "ncol")= int 6
- attr(*, "types")=List of 6
..$ : chr "int"
..$ : chr "int"
..$ : chr "int"
..$ : chr "int"
..$ : chr "int"
..$ : chr "int"
- attr(*, "data")='data.frame': 10 obs. of 6 variables:
..$ divertid: num 6 2 7 4 1 6 5 7 2 3
..$ presupu : num 4 3 2 6 3 4 3 3 4 3
..$ aprovech: num 7 1 6 4 2 6 6 7 3 3
..$ buenacom: num 3 4 4 5 2 3 3 4 3 6
..$ noimport: num 2 5 1 3 6 3 3 1 6 4
..$ ahorro : num 3 4 3 6 4 4 4 4 3 6km.model <- h2o.kmeans(my_data.h2o,
k = 3,
standardize = FALSE,
seed =123,
max_iterations = 100,
init = "PlusPlus")
  |
  |                                                                      |   0%
  |
|======================================================================| 100%km.modelModel Details:
==============
H2OClusteringModel: kmeans
Model ID: KMeans_model_R_1642441787139_4
Model Summary:
number_of_rows number_of_clusters number_of_categorical_columns
1 21 3 0
number_of_iterations within_cluster_sum_of_squares total_sum_of_squares
1 5 89.88889 334.66667
between_cluster_sum_of_squares
1 244.77778
H2OClusteringMetrics: kmeans
** Reported on training data. **
Total Within SS: 89.9
Between SS: 245
Total SS: 335
Centroid Statistics:
centroid size within_cluster_sum_of_squares
1 1 9.00000 37.55556
2 2 6.00000 20.50000
3 3 6.00000 31.83333km.model@parameters$model_id
[1] "KMeans_model_R_1642441787139_4"
$training_frame
[1] "datosc_sid_85b9_1"
$k
[1] 3
$max_iterations
[1] 100
$standardize
[1] FALSE
$seed
[1] 123
$init
[1] "PlusPlus"
$categorical_encoding
[1] "Enum"
$x
[1] "divertid" "presupu" "aprovech" "buenacom" "noimport" "ahorro" km.model@model$centers # Los centros de cada clusterCluster Means:
centroid divertid presupu aprovech buenacom noimport ahorro
1 1 5.666667 3.666667 6.000000 3.222222 2.000000 4.000000
2 2 1.666667 3.000000 1.833333 3.500000 5.500000 3.333333
3 3 3.500000 5.500000 3.333333 6.000000 3.500000 6.000000# Suma de Cuadrados Dentro de Cluster Total
km.model@model$model_summary$within_cluster_sum_of_squares[1] 89.9# Tamaños de cada cluster
h2o.cluster_sizes(km.model)[1] 9 6 6p <- h2o.predict(km.model, my_data.h2o)
  |
  |                                                                      |   0%
  |
  |======================================================================| 100%
p predict
1 0
2 1
3 0
4 2
5 1
6 0
[21 rows x 1 column] p <- as.data.frame(p)
str(p)'data.frame': 21 obs. of 1 variable:
$ predict: int 0 1 0 2 1 0 0 0 1 2 ...datos.h2o <- cbind(as.data.frame(datosc),
grp=as.factor(p$predict))
table(datos.h2o$grp)
0 1 2
9 6 6 prop.table(table(datos.h2o$grp))
    0     1     2
0.429 0.286 0.286
Caracterizando a los clusters con H2O
# Diagrama de lineas de promedios por cluster
library(dplyr)

datos.h2o %>%
  group_by(grp) %>%
  summarise_all(list(mean)) -> medias.h2o
medias.h2o
# A tibble: 3 x 7
grp divertid presupu aprovech buenacom noimport ahorro
<fct> <dbl> <dbl> <dbl> <dbl> <dbl> <dbl>
1 0 5.67 3.67 6 3.22 2 4
2 1 1.67 3 1.83 3.5 5.5 3.33
3 2 3.5 5.5 3.33 6 3.5 6 datos.h2o %>% summarise_if(is.numeric,mean) -> general.h2o
general.h2o divertid presupu aprovech buenacom noimport ahorro
1 3.9 4 4.05 4.1 3.43 4.38general.h2o <- cbind(grp="general",general.h2o)
general.h2o grp divertid presupu aprovech buenacom noimport ahorro
1 general 3.9 4 4.05 4.1 3.43 4.38medias.h2o <- as.data.frame(rbind(medias.h2o,general.h2o))
medias.h2o grp divertid presupu aprovech buenacom noimport ahorro
1 0 5.67 3.67 6.00 3.22 2.00 4.00
2 1 1.67 3.00 1.83 3.50 5.50 3.33
3 2 3.50 5.50 3.33 6.00 3.50 6.00
4 general 3.90 4.00 4.05 4.10 3.43 4.38# Convirtiendo la data a formato tidy
library(tidyr)
gathered_datos.h2o <- pivot_longer(data = medias.h2o,
-grp,
names_to = "variable",
values_to = "valor")
gathered_datos.h2o# A tibble: 24 x 3
grp variable valor
<fct> <chr> <dbl>
1 0 divertid 5.67
2 0 presupu 3.67
3 0 aprovech 6
4 0 buenacom 3.22
5 0 noimport 2
6 0 ahorro 4
7 1 divertid 1.67
8 1 presupu 3
9 1 aprovech 1.83
10 1 buenacom 3.5
# ... with 14 more rowslibrary(ggplot2)
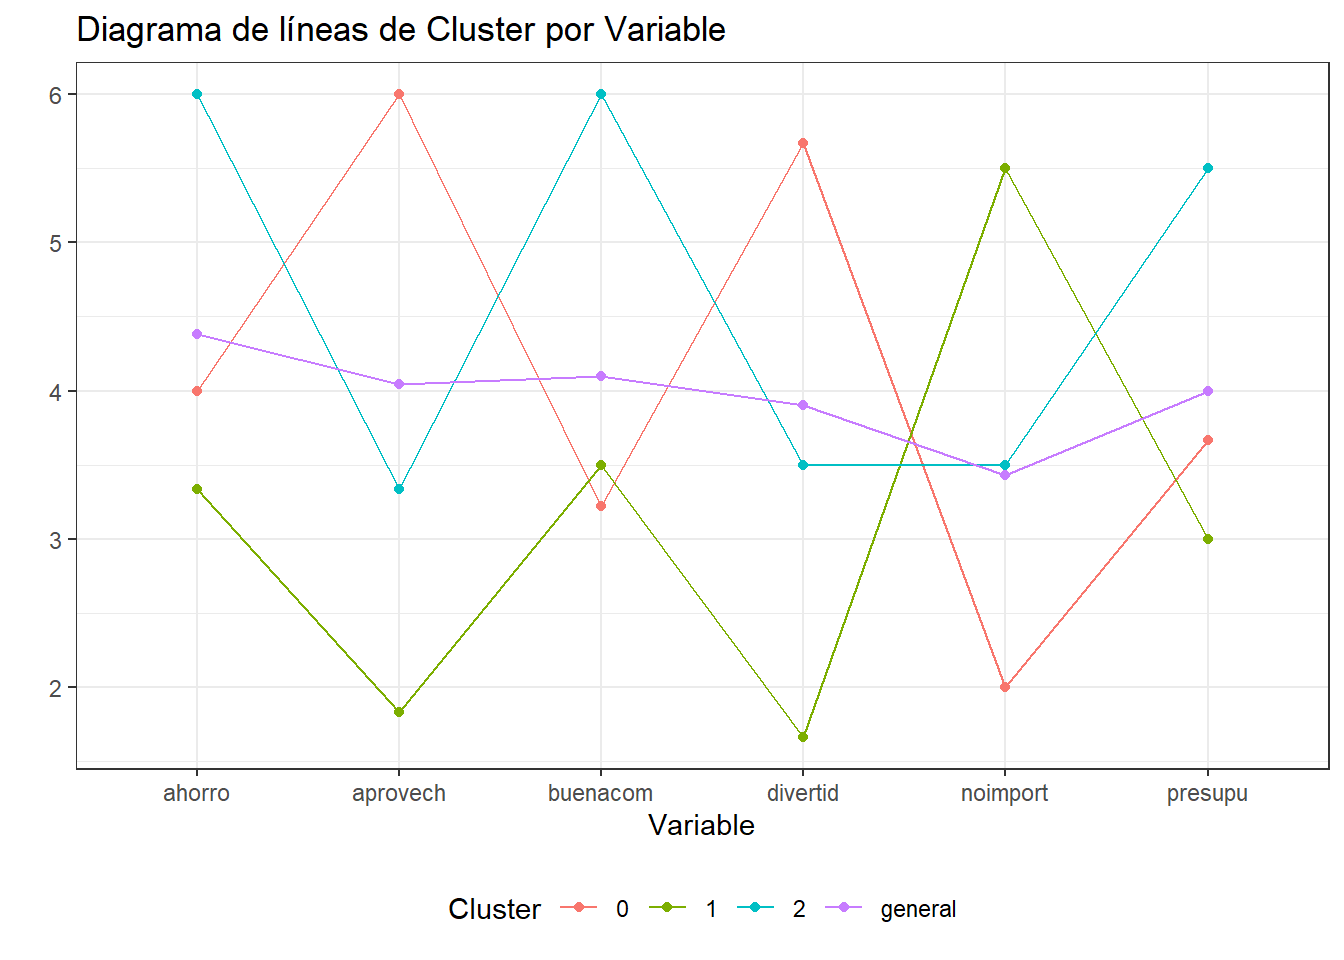
ggplot(gathered_datos.h2o) + aes(x=variable,y=valor,color=grp) +
geom_point() + geom_line(aes(group = grp)) +
scale_y_continuous(breaks = 1:10 ) +
theme_bw() +
theme(legend.position = "bottom") +
labs(title="Diagrama de líneas de Cluster por Variable",
x="Variable",y="") +
scale_colour_discrete("Cluster") 