Capítulo 4 Análisis Factorial
4.1 Marco Téorico
El Análisis Factorial es otra técnica de interdependencia que se aplica a variables medidas en escala de intervalo o de razón. A pesar de las semejanzas con el Análisis de Componentes Principales visto en el capítulo anterior, tiene varias diferencias. En primer lugar, el modelo de un Análisis Factorial propone descomponer la variabilidad total de una variable en función a los factores comunes y específicos, en cambio en un ACP el modelo propone descomponer cada componente como una combinación lineal de las variables. En segundo lugar, cuando se trabaja con la matriz de correlación, los componentes principales tienen media 0 y variancia igual a los autovalores, en cambio en un análisis factorial los factores comunes son variables ya estandarizadas (media cero y variancia uno).
4.2 Ejemplos
options(scipen=999)      # Eliminar la notación científica
options(digits = 4)      # Número de decimales

# Paquetes
library(pacman)
p_load(MASS, ca, anacor,FactoMineR,vegan,gplots,vcd,
       graphics,factoextra,DandEFA,polycor,GGally)
Este ejemplo fue tomado del libro de Hair
Hair, J. Anderson, R. Tatham, R. Black, W. (1999). Análisis Multivariante Prentice Hall
Ingreso de datos
Estos datos corresponden a 100 observaciones de 7 variables influyentes en la elección de distribuidor, en un ejemplo de un estudio de segmentación de la situación empresa a empresa, específicamente un informe sobre los clientes actuales de HATCO.
datos <- read.delim("hatco-factorial.txt")
str(datos)
'data.frame': 100 obs. of 8 variables:
$ id: int 1 2 3 4 5 6 7 8 9 10 ...
$ x1: num 4.1 1.8 3.4 2.7 6 1.9 4.6 1.3 5.5 4 ...
$ x2: num 0.6 3 5.2 1 0.9 3.3 2.4 4.2 1.6 3.5 ...
$ x3: num 6.9 6.3 5.7 7.1 9.6 7.9 9.5 6.2 9.4 6.5 ...
$ x4: num 4.7 6.6 6 5.9 7.8 4.8 6.6 5.1 4.7 6 ...
$ x5: num 2.35 4 2.7 2.3 4.6 1.9 4.5 2.2 3 3.2 ...
$ x6: num 5.2 8.4 8.2 7.8 4.5 9.7 7.6 6.9 7.6 8.7 ...
$ x7: num 2.4 2.5 4.3 1.8 3.4 2.6 3.5 2.8 3.5 3.7 ...# No considerar la primera columna Id
datos$id <- NULL
str(datos)'data.frame': 100 obs. of 7 variables:
$ x1: num 4.1 1.8 3.4 2.7 6 1.9 4.6 1.3 5.5 4 ...
$ x2: num 0.6 3 5.2 1 0.9 3.3 2.4 4.2 1.6 3.5 ...
$ x3: num 6.9 6.3 5.7 7.1 9.6 7.9 9.5 6.2 9.4 6.5 ...
$ x4: num 4.7 6.6 6 5.9 7.8 4.8 6.6 5.1 4.7 6 ...
$ x5: num 2.35 4 2.7 2.3 4.6 1.9 4.5 2.2 3 3.2 ...
$ x6: num 5.2 8.4 8.2 7.8 4.5 9.7 7.6 6.9 7.6 8.7 ...
$ x7: num 2.4 2.5 4.3 1.8 3.4 2.6 3.5 2.8 3.5 3.7 ...Primero realizaremos el Análisis Exploratorio con 7 variables
Análisis Descriptivo y Análisis de Correlación
library(psych)
describe(datos)
vars n mean sd median trimmed mad min max range skew kurtosis se
x1 1 100 3.52 1.32 3.40 3.53 1.48 0.0 6.1 6.1 -0.08 -0.59 0.13
x2 2 100 2.36 1.20 2.15 2.30 1.19 0.2 5.4 5.2 0.46 -0.59 0.12
x3 3 100 7.89 1.39 8.05 7.95 1.70 5.0 10.0 5.0 -0.28 -1.12 0.14
x4 4 100 5.25 1.13 5.00 5.23 1.04 2.5 8.2 5.7 0.21 -0.04 0.11
x5 5 100 2.67 0.77 2.60 2.63 0.59 1.1 4.6 3.5 0.48 -0.02 0.08
x6 6 100 6.97 1.59 7.15 7.01 1.85 3.7 10.0 6.3 -0.22 -0.91 0.16
x7 7 100 2.92 0.75 3.00 2.94 0.74 0.7 4.6 3.9 -0.36 0.01 0.08cor(datos) x1 x2 x3 x4 x5 x6 x7
x1 1.00000 -0.3492 0.50930 0.05041 0.07743 -0.48263 0.61190
x2 -0.34923 1.0000 -0.48721 0.27219 0.18533 0.46975 0.51298
x3 0.50930 -0.4872 1.00000 -0.11610 -0.03480 -0.44811 0.06662
x4 0.05041 0.2722 -0.11610 1.00000 0.78814 0.19998 0.29868
x5 0.07743 0.1853 -0.03480 0.78814 1.00000 0.17661 0.24043
x6 -0.48263 0.4697 -0.44811 0.19998 0.17661 1.00000 -0.05516
x7 0.61190 0.5130 0.06662 0.29868 0.24043 -0.05516 1.00000corr.test(datos)Call:corr.test(x = datos)
Correlation matrix
x1 x2 x3 x4 x5 x6 x7
x1 1.00 -0.35 0.51 0.05 0.08 -0.48 0.61
x2 -0.35 1.00 -0.49 0.27 0.19 0.47 0.51
x3 0.51 -0.49 1.00 -0.12 -0.03 -0.45 0.07
x4 0.05 0.27 -0.12 1.00 0.79 0.20 0.30
x5 0.08 0.19 -0.03 0.79 1.00 0.18 0.24
x6 -0.48 0.47 -0.45 0.20 0.18 1.00 -0.06
x7 0.61 0.51 0.07 0.30 0.24 -0.06 1.00
Sample Size
[1] 100
Probability values (Entries above the diagonal are adjusted for multiple tests.)
x1 x2 x3 x4 x5 x6 x7
x1 0.00 0.00 0.00 1.00 1.00 0.00 0.00
x2 0.00 0.00 0.00 0.07 0.52 0.00 0.00
x3 0.00 0.00 0.00 1.00 1.00 0.00 1.00
x4 0.62 0.01 0.25 0.00 0.00 0.41 0.03
x5 0.44 0.06 0.73 0.00 0.00 0.55 0.16
x6 0.00 0.00 0.00 0.05 0.08 0.00 1.00
x7 0.00 0.00 0.51 0.00 0.02 0.59 0.00
To see confidence intervals of the correlations, print with the short=FALSE optionlibrary(xts)
library(zoo)
library(PerformanceAnalytics)
chart.Correlation(datos, histogram=TRUE, pch=20)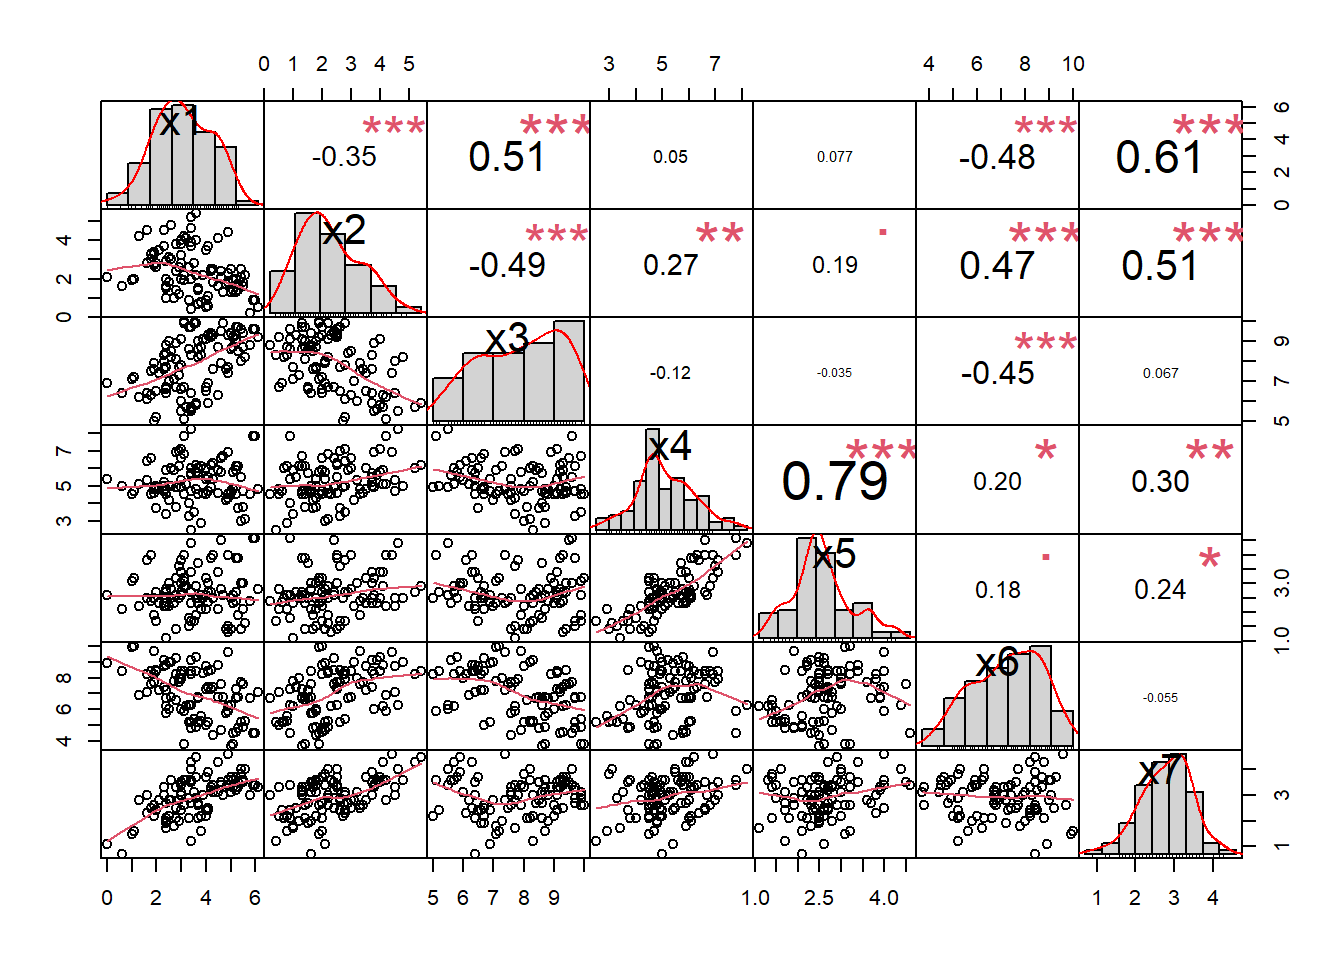
# Otra Forma
library(psych)
cor.plot(cor(datos),
         main="Mapa de Calor",
         diag=F,
show.legend = TRUE) 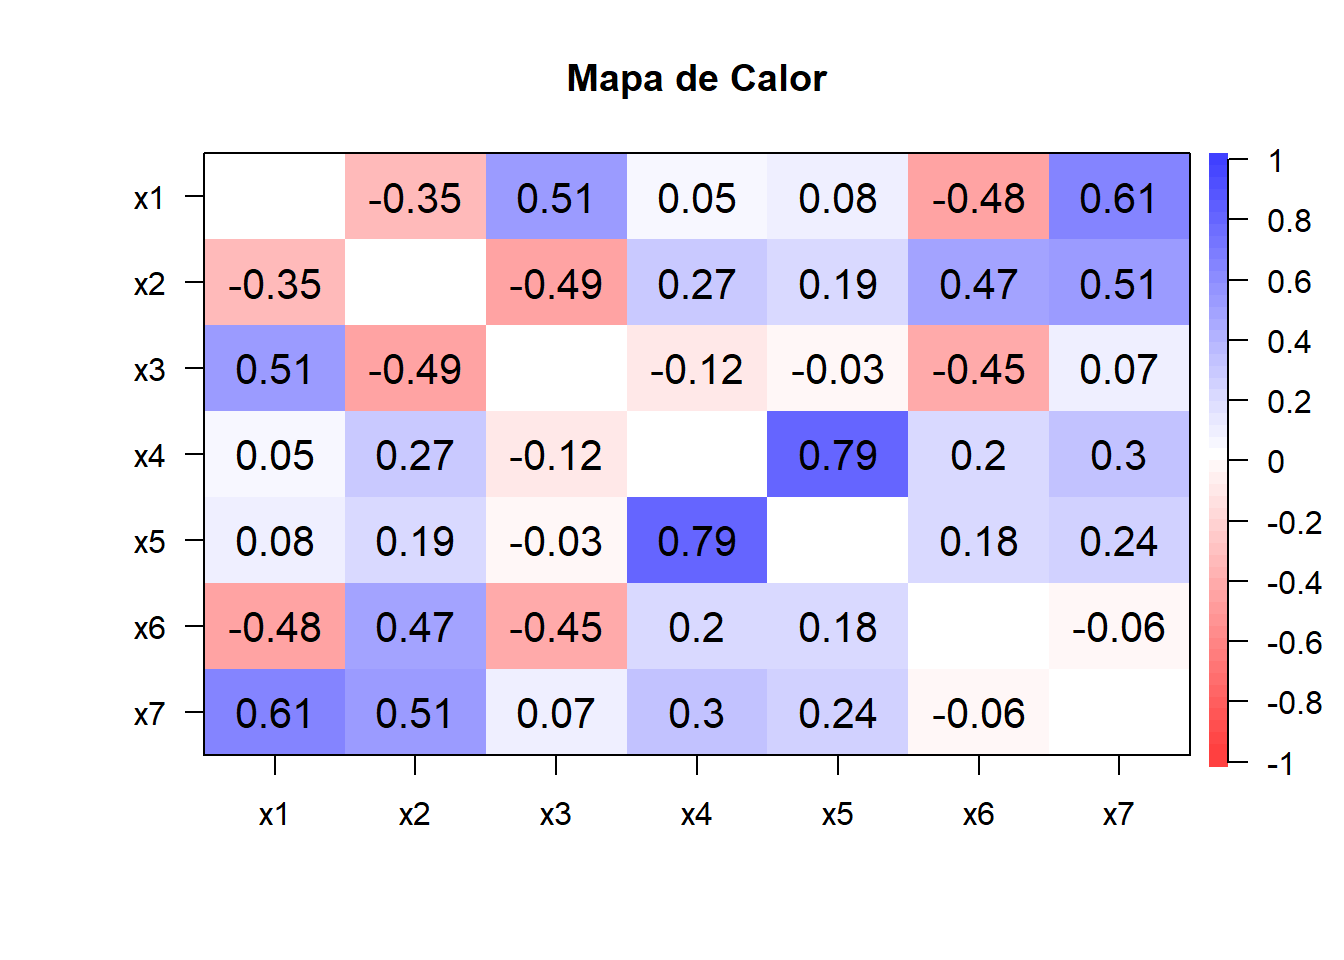
Prueba de Esfericidad de Bartlett
library(rela)
cortest.bartlett(cor(datos),n=nrow(datos))
$chisq
[1] 567.5
$p.value
[1] 0.0000000000000000000000000000000000000000000000000000000000000000000000000000000000000000000000000000000001094
$df
[1] 21Indicador Kaiser-Meyer-Olkinn KMO y MSA
KMO(datos)## Kaiser-Meyer-Olkin factor adequacy
## Call: KMO(r = datos)
## Overall MSA = 0.45
## MSA for each item =
## x1 x2 x3 x4 x5 x6 x7
## 0.34 0.33 0.91 0.56 0.55 0.93 0.29Análisis Exploratorio con 6 variables
datos <- read.delim("hatco-factorial.txt")
str(datos)
'data.frame': 100 obs. of 8 variables:
$ id: int 1 2 3 4 5 6 7 8 9 10 ...
$ x1: num 4.1 1.8 3.4 2.7 6 1.9 4.6 1.3 5.5 4 ...
$ x2: num 0.6 3 5.2 1 0.9 3.3 2.4 4.2 1.6 3.5 ...
$ x3: num 6.9 6.3 5.7 7.1 9.6 7.9 9.5 6.2 9.4 6.5 ...
$ x4: num 4.7 6.6 6 5.9 7.8 4.8 6.6 5.1 4.7 6 ...
$ x5: num 2.35 4 2.7 2.3 4.6 1.9 4.5 2.2 3 3.2 ...
$ x6: num 5.2 8.4 8.2 7.8 4.5 9.7 7.6 6.9 7.6 8.7 ...
$ x7: num 2.4 2.5 4.3 1.8 3.4 2.6 3.5 2.8 3.5 3.7 ...# No considerar la primera columna Id ni la última variable X7
datos$id <- NULL
datos$x7 <- NULL
datos.facto <- datos
str(datos.facto)'data.frame': 100 obs. of 6 variables:
$ x1: num 4.1 1.8 3.4 2.7 6 1.9 4.6 1.3 5.5 4 ...
$ x2: num 0.6 3 5.2 1 0.9 3.3 2.4 4.2 1.6 3.5 ...
$ x3: num 6.9 6.3 5.7 7.1 9.6 7.9 9.5 6.2 9.4 6.5 ...
$ x4: num 4.7 6.6 6 5.9 7.8 4.8 6.6 5.1 4.7 6 ...
$ x5: num 2.35 4 2.7 2.3 4.6 1.9 4.5 2.2 3 3.2 ...
$ x6: num 5.2 8.4 8.2 7.8 4.5 9.7 7.6 6.9 7.6 8.7 ...Análisis descriptivo y Análisis de Correlación
library(psych)
describe(datos.facto)
vars n mean sd median trimmed mad min max range skew kurtosis se
x1 1 100 3.52 1.32 3.40 3.53 1.48 0.0 6.1 6.1 -0.08 -0.59 0.13
x2 2 100 2.36 1.20 2.15 2.30 1.19 0.2 5.4 5.2 0.46 -0.59 0.12
x3 3 100 7.89 1.39 8.05 7.95 1.70 5.0 10.0 5.0 -0.28 -1.12 0.14
x4 4 100 5.25 1.13 5.00 5.23 1.04 2.5 8.2 5.7 0.21 -0.04 0.11
x5 5 100 2.67 0.77 2.60 2.63 0.59 1.1 4.6 3.5 0.48 -0.02 0.08
x6 6 100 6.97 1.59 7.15 7.01 1.85 3.7 10.0 6.3 -0.22 -0.91 0.16cor(datos.facto) x1 x2 x3 x4 x5 x6
x1 1.00000 -0.3492 0.5093 0.05041 0.07743 -0.4826
x2 -0.34923 1.0000 -0.4872 0.27219 0.18533 0.4697
x3 0.50930 -0.4872 1.0000 -0.11610 -0.03480 -0.4481
x4 0.05041 0.2722 -0.1161 1.00000 0.78814 0.2000
x5 0.07743 0.1853 -0.0348 0.78814 1.00000 0.1766
x6 -0.48263 0.4697 -0.4481 0.19998 0.17661 1.0000corr.test(datos.facto)Call:corr.test(x = datos.facto)
Correlation matrix
x1 x2 x3 x4 x5 x6
x1 1.00 -0.35 0.51 0.05 0.08 -0.48
x2 -0.35 1.00 -0.49 0.27 0.19 0.47
x3 0.51 -0.49 1.00 -0.12 -0.03 -0.45
x4 0.05 0.27 -0.12 1.00 0.79 0.20
x5 0.08 0.19 -0.03 0.79 1.00 0.18
x6 -0.48 0.47 -0.45 0.20 0.18 1.00
Sample Size
[1] 100
Probability values (Entries above the diagonal are adjusted for multiple tests.)
x1 x2 x3 x4 x5 x6
x1 0.00 0.00 0.00 1.00 1.00 0.00
x2 0.00 0.00 0.00 0.05 0.39 0.00
x3 0.00 0.00 0.00 1.00 1.00 0.00
x4 0.62 0.01 0.25 0.00 0.00 0.32
x5 0.44 0.06 0.73 0.00 0.00 0.39
x6 0.00 0.00 0.00 0.05 0.08 0.00
To see confidence intervals of the correlations, print with the short=FALSE option# Gráfico de correlación
library(PerformanceAnalytics)
chart.Correlation(datos.facto, histogram=TRUE, pch=20)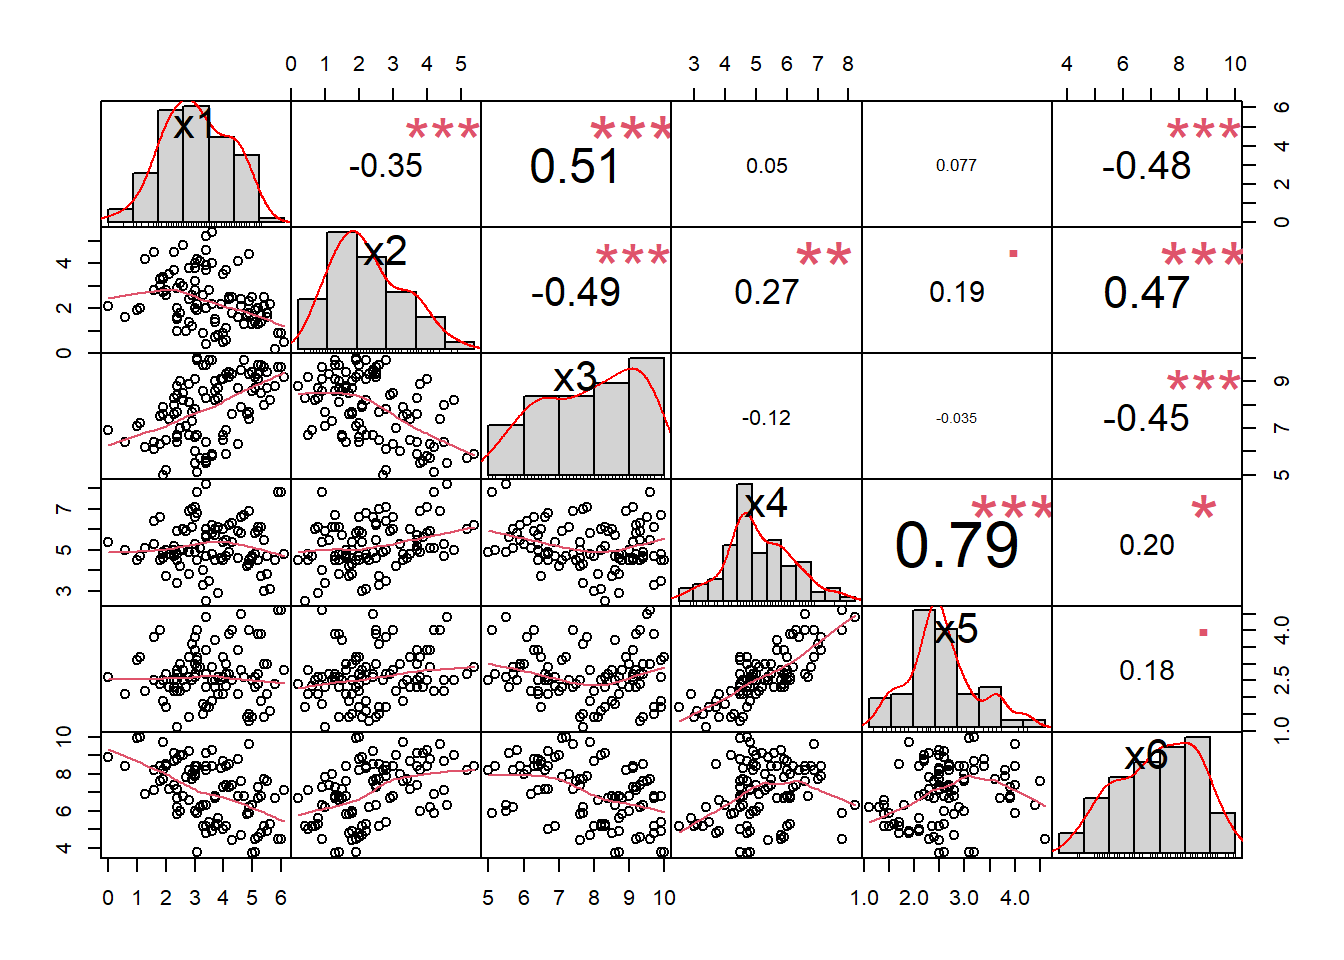
library(psych)
cor.plot(cor(datos.facto),
         main="Mapa de Calor",
         diag=TRUE,number=F,
         show.legend = TRUE)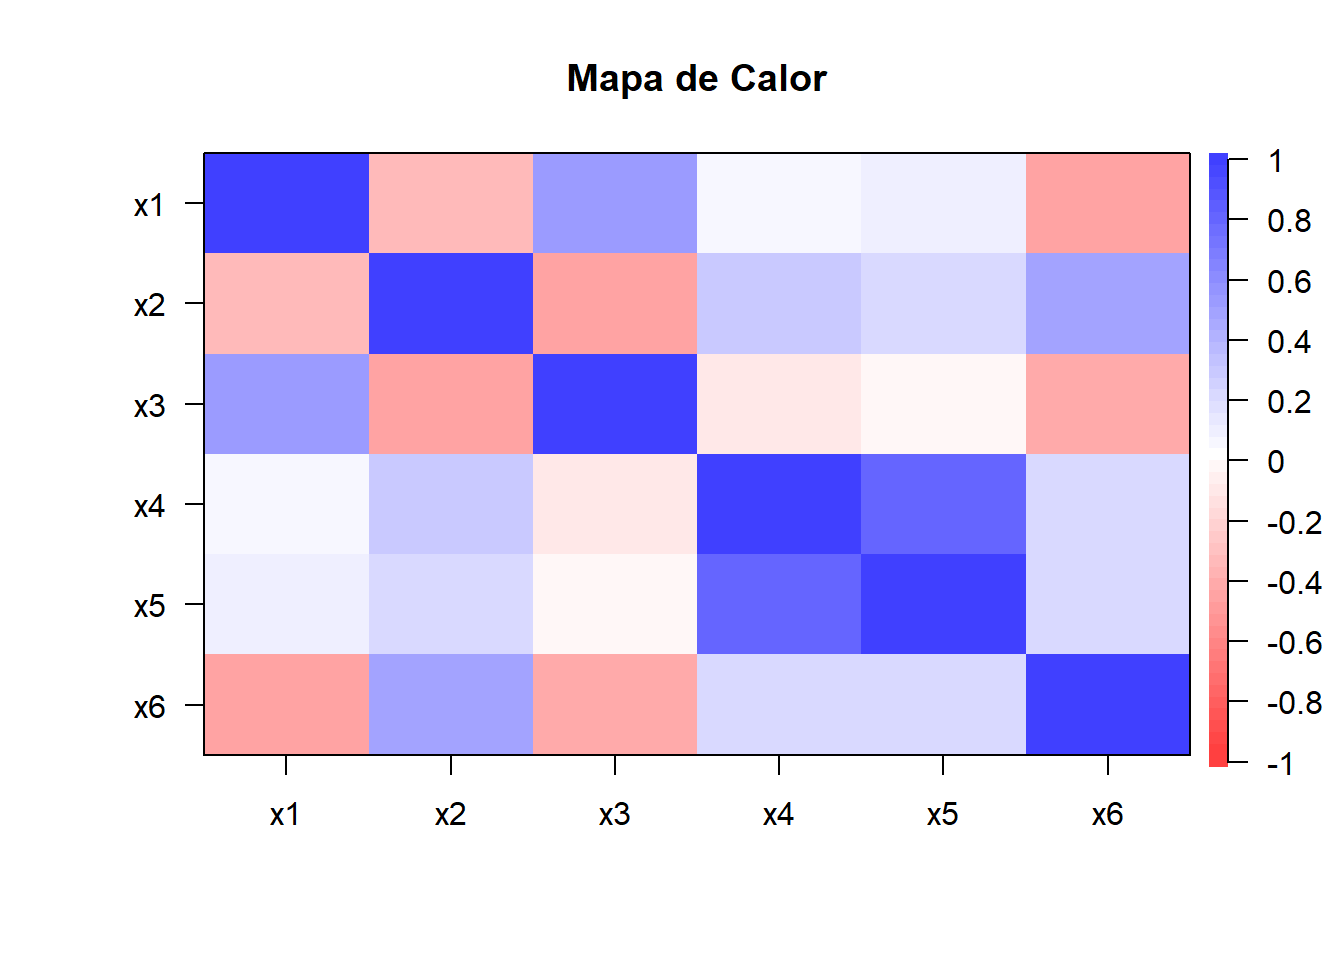
Prueba de Esfericidad de Bartlett
library(rela)
cortest.bartlett(cor(datos.facto),n=nrow(datos.facto))
$chisq
[1] 205.9
$p.value
[1] 0.00000000000000000000000000000000001339
$df
[1] 15Indicador Kaiser-Meyer-Olkinn KMO y MSA
KMO(datos.facto)Kaiser-Meyer-Olkin factor adequacy
Call: KMO(r = datos.facto)
Overall MSA = 0.66
MSA for each item =
x1 x2 x3 x4 x5 x6
0.72 0.79 0.75 0.54 0.53 0.78 Análisis Factorial con 6 variables con el Método de Componentes Principales
Análisis Factorial sin rotación con función principal
library(psych)
facto.sin.rota <- principal(r=datos.facto,
                            nfactors=2, #nfactors inicial=6
                            covar=F,#matriz de correlacion
                            rotate="none")
str(facto.sin.rota)
List of 29
$ values : num [1:6] 2.513 1.74 0.598 0.53 0.416 ...
$ rotation : chr "none"
$ n.obs : int 100
$ communality : Named num [1:6] 0.658 0.58 0.646 0.882 0.872 ...
..- attr(*, "names")= chr [1:6] "x1" "x2" "x3" "x4" ...
$ loadings : 'loadings' num [1:6, 1:2] -0.627 0.759 -0.73 0.494 0.424 ...
..- attr(*, "dimnames")=List of 2
.. ..$ : chr [1:6] "x1" "x2" "x3" "x4" ...
.. ..$ : chr [1:2] "PC1" "PC2"
$ fit : num 0.916
$ fit.off : num 0.939
$ fn : chr "principal"
$ Call : language principal(r = datos.facto, nfactors = 2, rotate = "none", covar = F)
$ uniquenesses: Named num [1:6] 0.342 0.42 0.354 0.118 0.128 ...
..- attr(*, "names")= chr [1:6] "x1" "x2" "x3" "x4" ...
$ complexity : Named num [1:6] 1.93 1.02 1.41 1.67 1.49 ...
..- attr(*, "names")= chr [1:6] "x1" "x2" "x3" "x4" ...
$ chi : num 25.5
$ EPVAL : num 0.0000401
$ R2 : Named num [1:2] 1 1
..- attr(*, "names")= chr [1:2] "PC1" "PC2"
$ objective : num 0.416
$ residual : num [1:6, 1:6] 0.3424 0.1614 -0.1211 -0.0504 -0.0842 ...
..- attr(*, "dimnames")=List of 2
.. ..$ : chr [1:6] "x1" "x2" "x3" "x4" ...
.. ..$ : chr [1:6] "x1" "x2" "x3" "x4" ...
$ rms : num 0.0922
$ factors : int 2
$ dof : num 4
$ null.dof : num 15
$ null.model : num 2.14
$ criteria : Named num [1:3] 0.416 NA NA
..- attr(*, "names")= chr [1:3] "objective" "" ""
$ STATISTIC : num 39.5
$ PVAL : num 0.0000000561
$ weights : num [1:6, 1:2] -0.25 0.302 -0.29 0.197 0.169 ...
..- attr(*, "dimnames")=List of 2
.. ..$ : chr [1:6] "x1" "x2" "x3" "x4" ...
.. ..$ : chr [1:2] "PC1" "PC2"
$ r.scores : num [1:2, 1:2] 1 0.000000000000000125 0.000000000000000208 1
..- attr(*, "dimnames")=List of 2
.. ..$ : chr [1:2] "PC1" "PC2"
.. ..$ : chr [1:2] "PC1" "PC2"
$ Vaccounted : num [1:5, 1:2] 2.513 0.419 0.419 0.591 0.591 ...
..- attr(*, "dimnames")=List of 2
.. ..$ : chr [1:5] "SS loadings" "Proportion Var" "Cumulative Var" "Proportion Explained" ...
.. ..$ : chr [1:2] "PC1" "PC2"
$ Structure : 'loadings' num [1:6, 1:2] -0.627 0.759 -0.73 0.494 0.424 ...
..- attr(*, "dimnames")=List of 2
.. ..$ : chr [1:6] "x1" "x2" "x3" "x4" ...
.. ..$ : chr [1:2] "PC1" "PC2"
$ scores : num [1:100, 1:2] -0.853 1.621 1.572 0.169 -0.805 ...
..- attr(*, "dimnames")=List of 2
.. ..$ : NULL
.. ..$ : chr [1:2] "PC1" "PC2"
- attr(*, "class")= chr [1:2] "psych" "principal"# Autovalores
facto.sin.rota$values[1] 2.5131 1.7396 0.5975 0.5298 0.4157 0.2043Gráfica de Valores propios
# Primera forma
plot(facto.sin.rota$values,type="b",pch=20,col="blue",
     main="Gráfico de sedimentación")
abline(h=1,lty=3,col="red")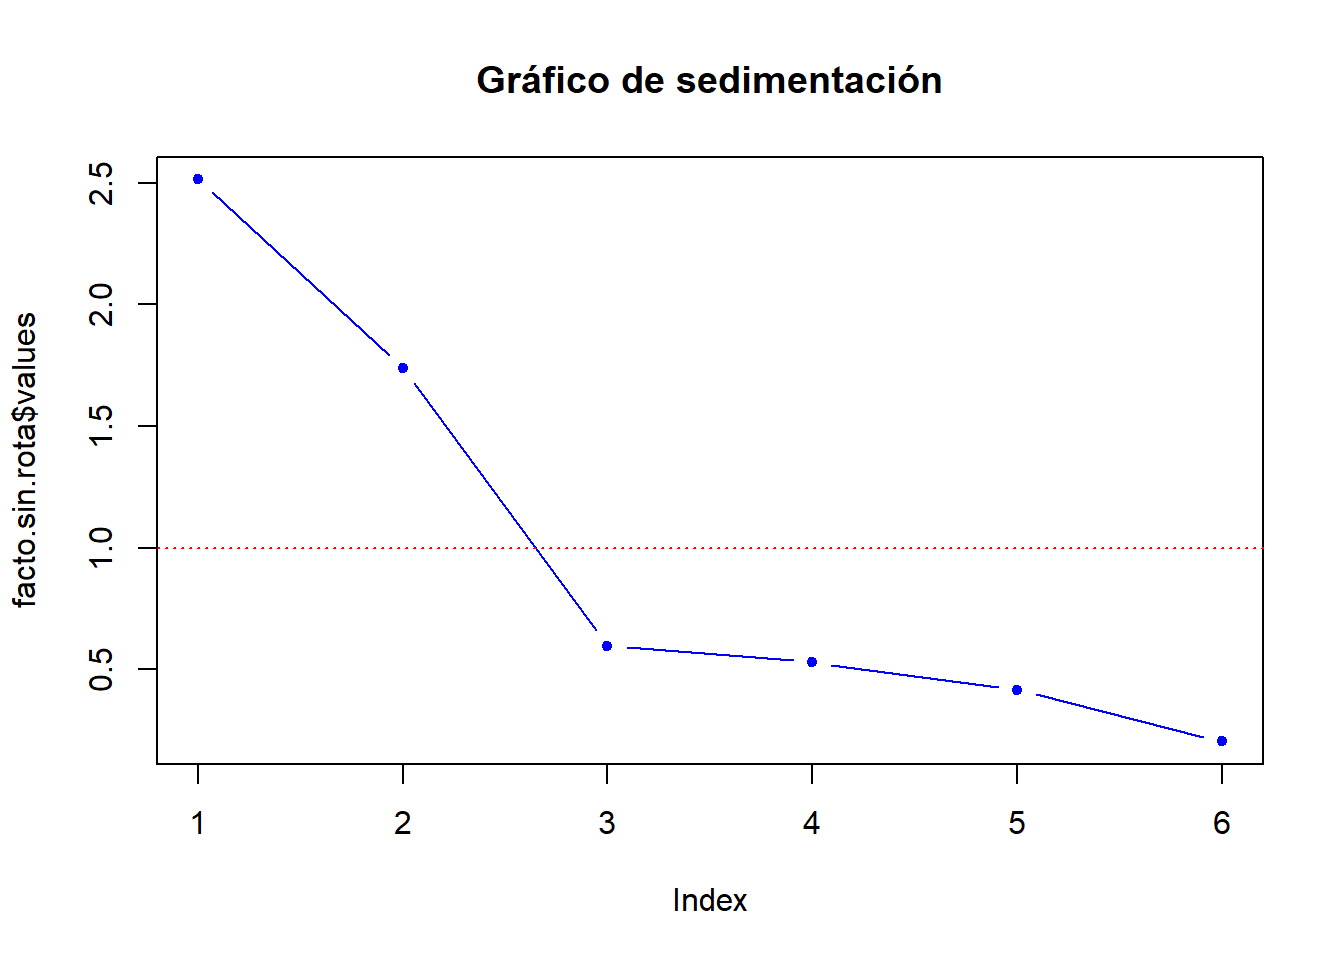
# Segunda forma
eig.val <- facto.sin.rota$values
barplot(eig.val, names.arg=1:6,
        main = "Gráfico de Sedimentación",
        xlab = "Factores",
        ylab = "Autovalores",
        col ="steelblue")
lines(x = 1:6, eig.val,
      type="b", pch=19, col = "red")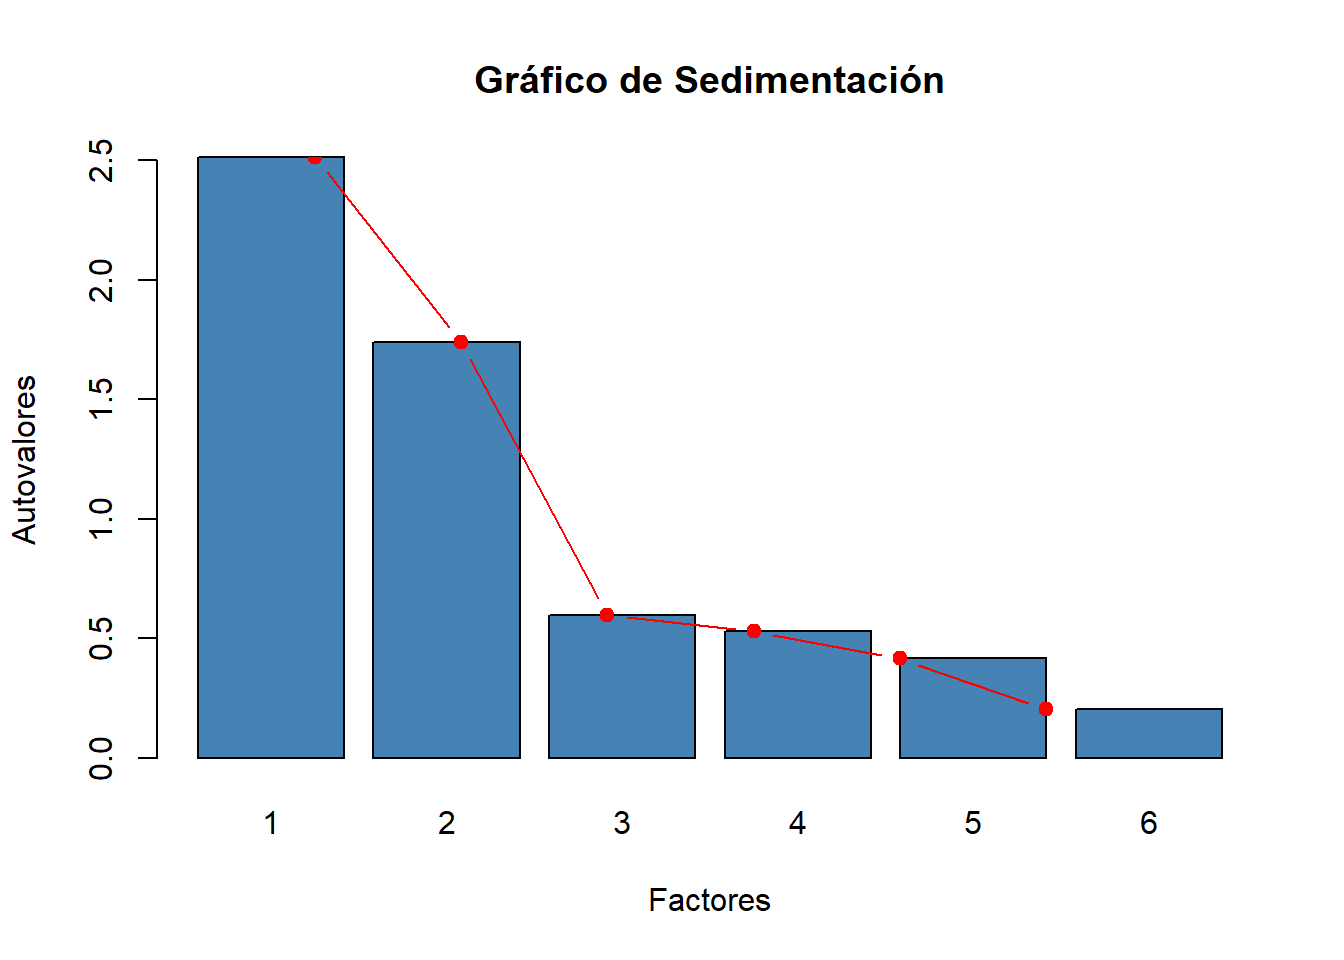
Comunalidades
facto.sin.rota$communality x1 x2 x3 x4 x5 x6
0.6576 0.5800 0.6456 0.8817 0.8722 0.6156 Cargas Factoriales, Correlaciones Factor, Variable
facto.sin.rota$loadings ##
## Loadings:
## PC1 PC2
## x1 -0.627 0.514
## x2 0.759
## x3 -0.730 0.336
## x4 0.494 0.799
## x5 0.424 0.832
## x6 0.767 -0.167
##
## PC1 PC2
## SS loadings 2.513 1.740
## Proportion Var 0.419 0.290
## Cumulative Var 0.419 0.709Gráfica de círculo de correlaciones
library(ade4)
load.sin.rota <- facto.sin.rota$loadings[,1:2]
s.corcircle(load.sin.rota,grid=FALSE)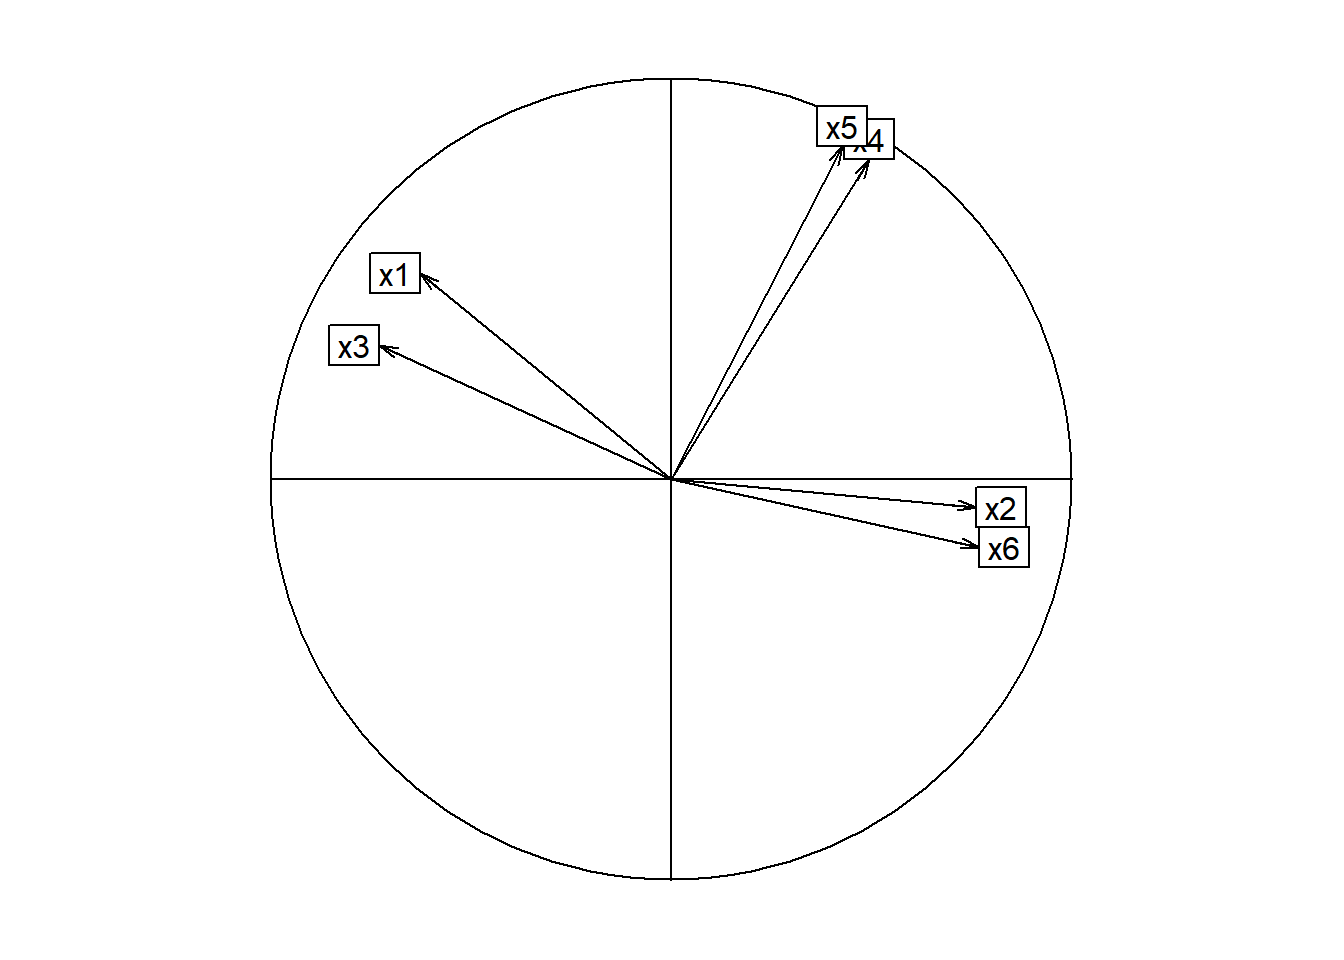
Análisis Factorial con rotacion con función principal
library(psych)
facto.con.rota <- principal(r=datos.facto,
                            nfactors=2,
                            rotate="varimax")
str(facto.con.rota)
List of 30
$ values : num [1:6] 2.513 1.74 0.598 0.53 0.416 ...
$ rotation : chr "varimax"
$ n.obs : int 100
$ communality : Named num [1:6] 0.658 0.58 0.646 0.882 0.872 ...
..- attr(*, "names")= chr [1:6] "x1" "x2" "x3" "x4" ...
$ loadings : 'loadings' num [1:6, 1:2] -0.7875 0.7137 -0.8034 0.1013 0.0241 ...
..- attr(*, "dimnames")=List of 2
.. ..$ : chr [1:6] "x1" "x2" "x3" "x4" ...
.. ..$ : chr [1:2] "RC1" "RC2"
$ fit : num 0.916
$ fit.off : num 0.939
$ fn : chr "principal"
$ Call : language principal(r = datos.facto, nfactors = 2, rotate = "varimax")
$ uniquenesses: Named num [1:6] 0.342 0.42 0.354 0.118 0.128 ...
..- attr(*, "names")= chr [1:6] "x1" "x2" "x3" "x4" ...
$ complexity : Named num [1:6] 1.12 1.27 1 1.02 1 ...
..- attr(*, "names")= chr [1:6] "x1" "x2" "x3" "x4" ...
$ chi : num 25.5
$ EPVAL : num 0.0000401
$ R2 : Named num [1:2] 1 1
..- attr(*, "names")= chr [1:2] "RC1" "RC2"
$ objective : num 0.416
$ residual : num [1:6, 1:6] 0.3424 0.1614 -0.1211 -0.0504 -0.0842 ...
..- attr(*, "dimnames")=List of 2
.. ..$ : chr [1:6] "x1" "x2" "x3" "x4" ...
.. ..$ : chr [1:6] "x1" "x2" "x3" "x4" ...
$ rms : num 0.0922
$ factors : int 2
$ dof : num 4
$ null.dof : num 15
$ null.model : num 2.14
$ criteria : Named num [1:3] 0.416 NA NA
..- attr(*, "names")= chr [1:3] "objective" "" ""
$ STATISTIC : num 39.5
$ PVAL : num 0.0000000561
$ weights : num [1:6, 1:2] -0.3526 0.2892 -0.3453 -0.0206 -0.0539 ...
..- attr(*, "dimnames")=List of 2
.. ..$ : chr [1:6] "x1" "x2" "x3" "x4" ...
.. ..$ : chr [1:2] "RC1" "RC2"
$ r.scores : num [1:2, 1:2] 1 -0.000000000000000749 -0.000000000000000729 1
..- attr(*, "dimnames")=List of 2
.. ..$ : chr [1:2] "RC1" "RC2"
.. ..$ : chr [1:2] "RC1" "RC2"
$ rot.mat : num [1:2, 1:2] 0.902 -0.431 0.431 0.902
$ Vaccounted : num [1:5, 1:2] 2.369 0.395 0.395 0.557 0.557 ...
..- attr(*, "dimnames")=List of 2
.. ..$ : chr [1:5] "SS loadings" "Proportion Var" "Cumulative Var" "Proportion Explained" ...
.. ..$ : chr [1:2] "RC1" "RC2"
$ Structure : 'loadings' num [1:6, 1:2] -0.7875 0.7137 -0.8034 0.1013 0.0241 ...
..- attr(*, "dimnames")=List of 2
.. ..$ : chr [1:6] "x1" "x2" "x3" "x4" ...
.. ..$ : chr [1:2] "RC1" "RC2"
$ scores : num [1:100, 1:2] -0.657 1.176 1.492 0.265 -2.118 ...
..- attr(*, "dimnames")=List of 2
.. ..$ : NULL
.. ..$ : chr [1:2] "RC1" "RC2"
- attr(*, "class")= chr [1:2] "psych" "principal"facto.con.rota$values[1] 2.5131 1.7396 0.5975 0.5298 0.4157 0.2043facto.con.rota$communality x1 x2 x3 x4 x5 x6
0.6576 0.5800 0.6456 0.8817 0.8722 0.6156 facto.con.rota$loadings
Loadings:
   RC1    RC2
x1 -0.788  0.193
x2  0.714  0.266
x3 -0.803
x4  0.101  0.933
x5         0.934
x6  0.764  0.179

                 RC1   RC2
SS loadings    2.369 1.883
Proportion Var 0.395 0.314
Cumulative Var 0.395 0.709head(facto.con.rota$scores) RC1 RC2
[1,] -0.6570 -0.6026
[2,] 1.1762 1.2975
[3,] 1.4924 0.5227
[4,] 0.2647 -0.1627
[5,] -2.1179 2.5649
[6,] 1.2629 -0.7416head(cbind(datos.facto,
as.data.frame(scale(datos.facto)),
facto.con.rota$scores )) x1 x2 x3 x4 x5 x6 x1 x2 x3 x4 x5 x6
1 4.1 0.6 6.9 4.7 2.35 5.2 0.44294 -1.4753 -0.716912 -0.4843 -0.40940 -1.1172
2 1.8 3.0 6.3 6.6 4.00 8.4 -1.29853 0.5319 -1.149656 1.1950 1.73170 0.9014
3 3.4 5.2 5.7 6.0 2.70 8.2 -0.08707 2.3719 -1.582399 0.6647 0.04477 0.7753
4 2.7 1.0 7.1 5.9 2.30 7.8 -0.61708 -1.1408 -0.572664 0.5763 -0.47429 0.5229
5 6.0 0.9 9.6 7.8 4.60 4.5 1.88154 -1.2244 1.230435 2.2556 2.51028 -1.5588
6 1.9 3.3 7.9 4.8 1.90 9.7 -1.22281 0.7828 0.004327 -0.3960 -0.99334 1.7215
RC1 RC2
1 -0.6570 -0.6026
2 1.1762 1.2975
3 1.4924 0.5227
4 0.2647 -0.1627
5 -2.1179 2.5649
6 1.2629 -0.7416Gráfica de variables sobre el primer plano de componentes
load <- facto.con.rota$loadings[,1:2]

plot(load, pch=20,
     xlim=c(-1,1),
     ylim=c(-1,1),
     xlab="Factor 1",
     ylab="Factor 2")
abline(h=0,lty=3)
abline(v=0,lty=3)
text(load,pos=1,labels=names(datos.facto),cex=0.8)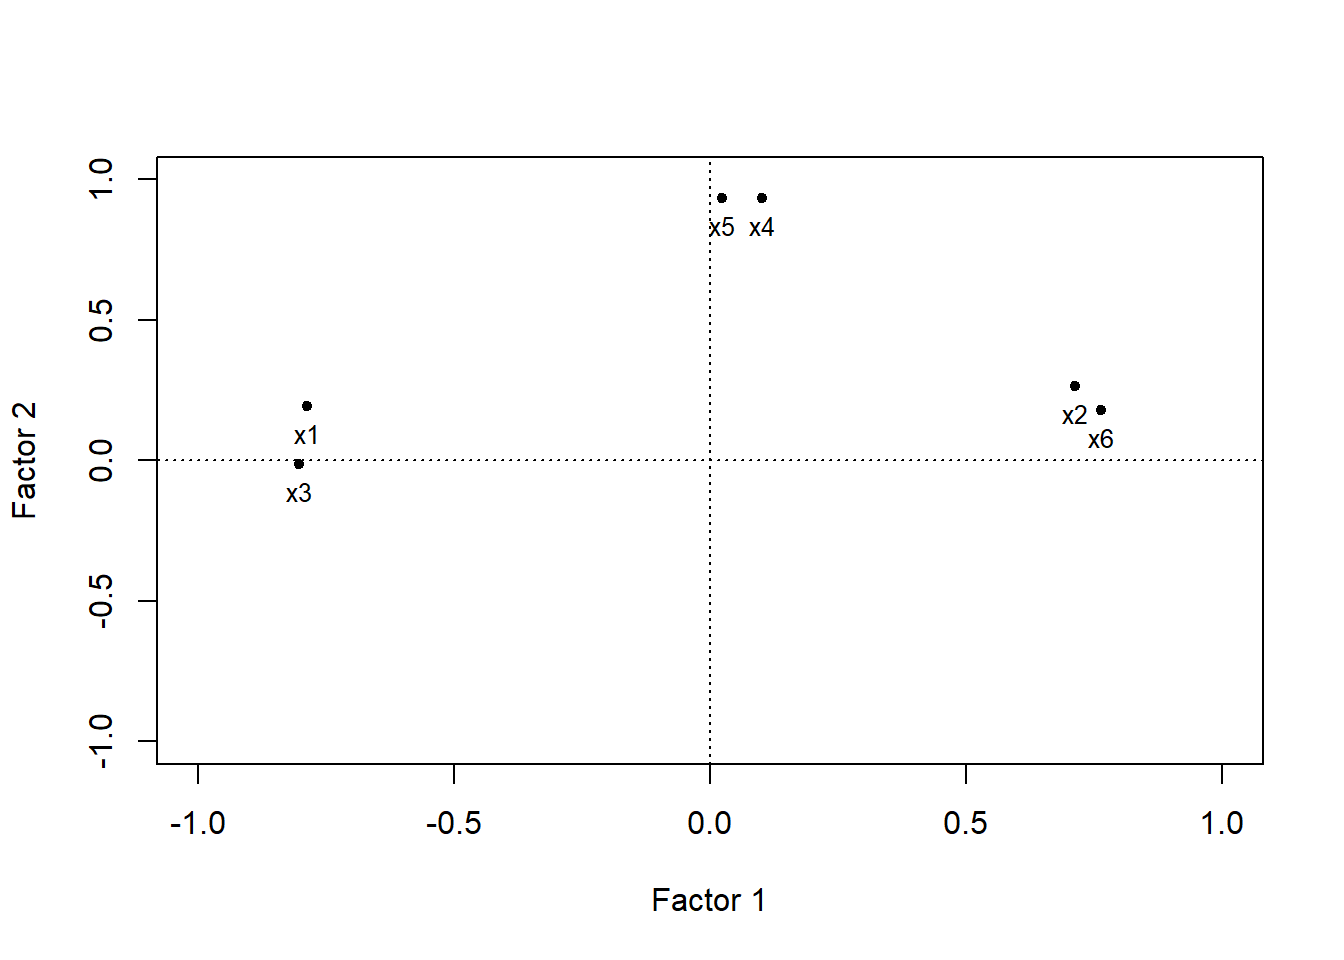
Gráfica de círculo de correlaciones
library(ade4)
load <- facto.con.rota$loadings[,1:2]
s.corcircle(load,grid=FALSE)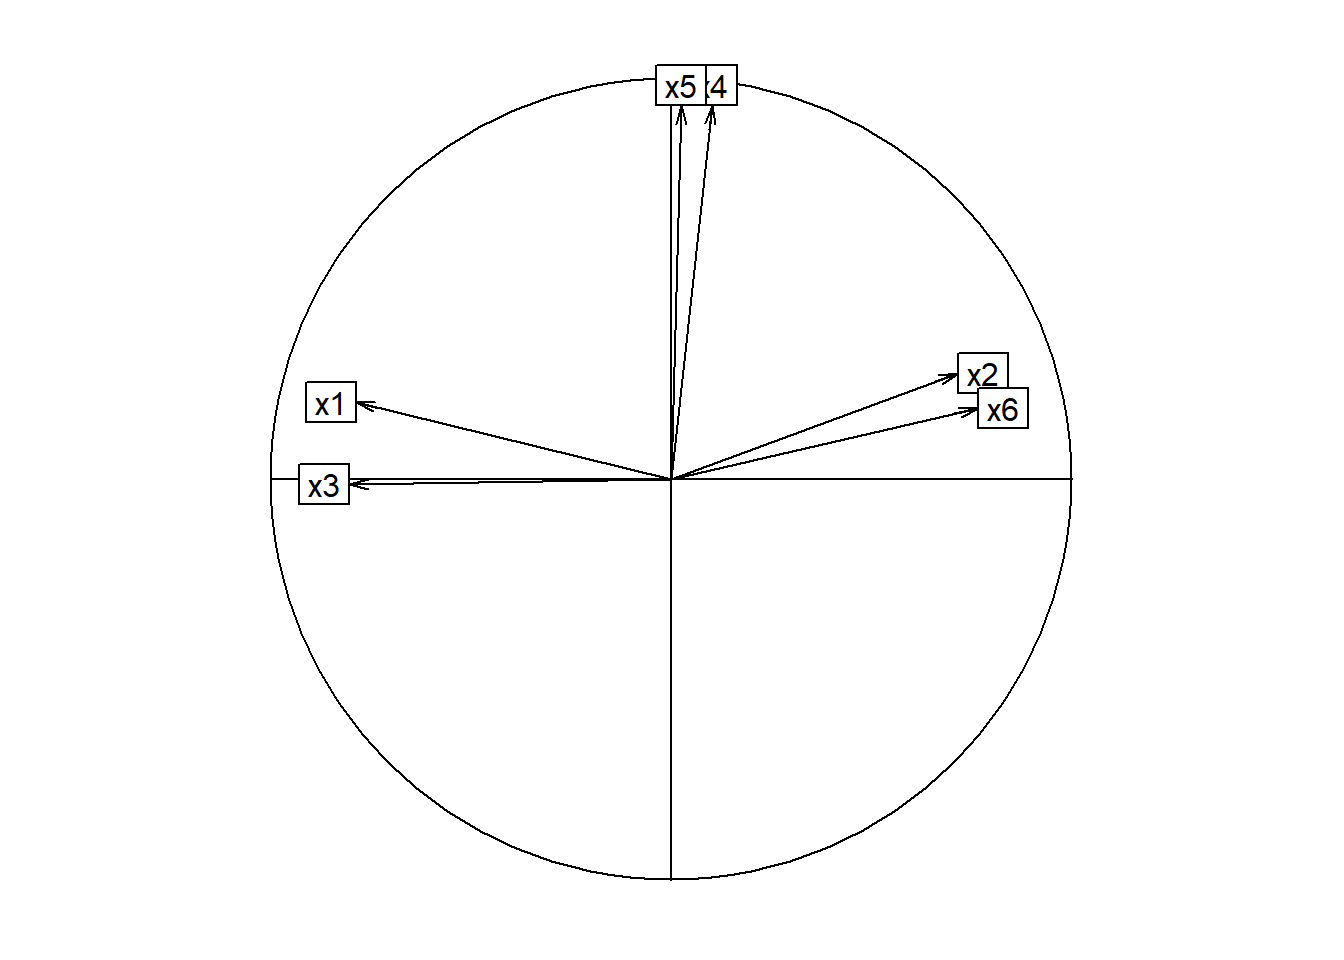
fa.diagram(facto.con.rota)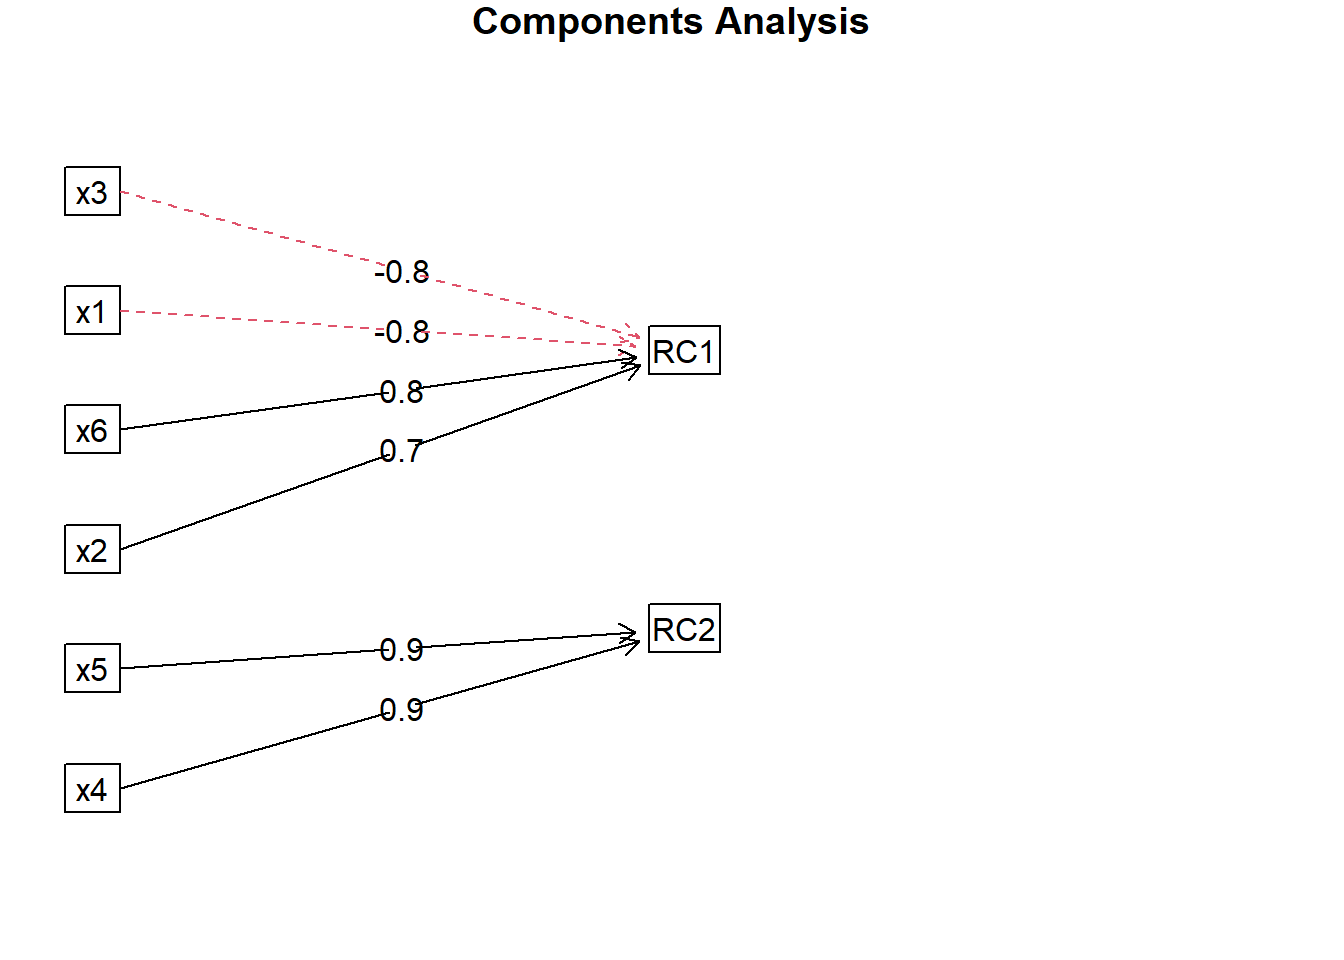
Gráfica de Matriz de Correlación entre Variables y Factores
library(psych)
salida.facto <- cbind(datos.facto,facto.con.rota$scores)
cor.plot(cor(salida.facto),
         main="Mapa de Calor",
         diag=TRUE,number=F,
show.legend = TRUE) 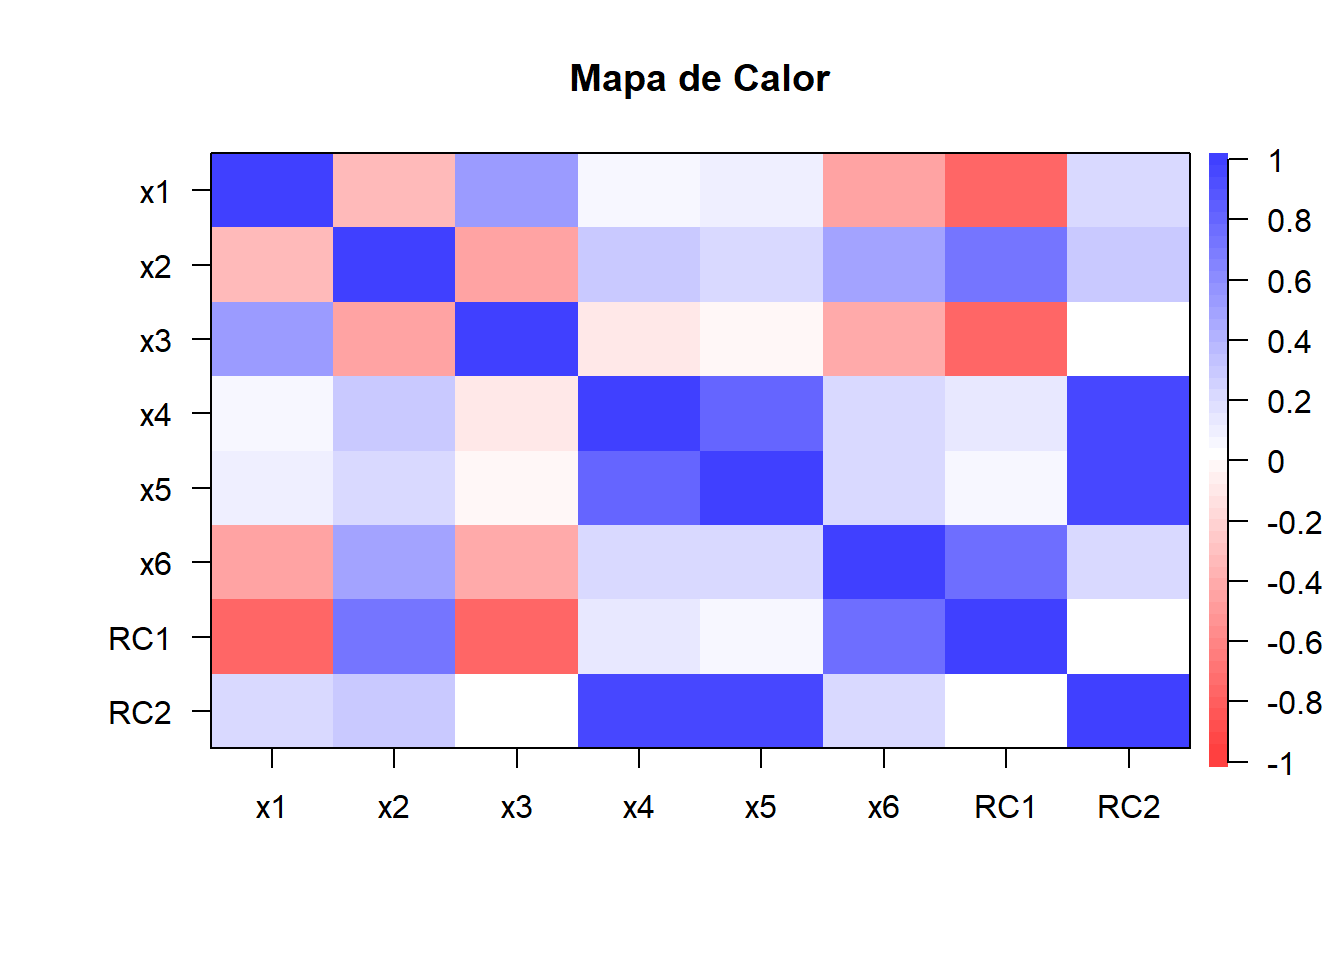
library(GGally)
ggpairs(salida.facto)
library(gplots)
library(polycor)
library(DandEFA)
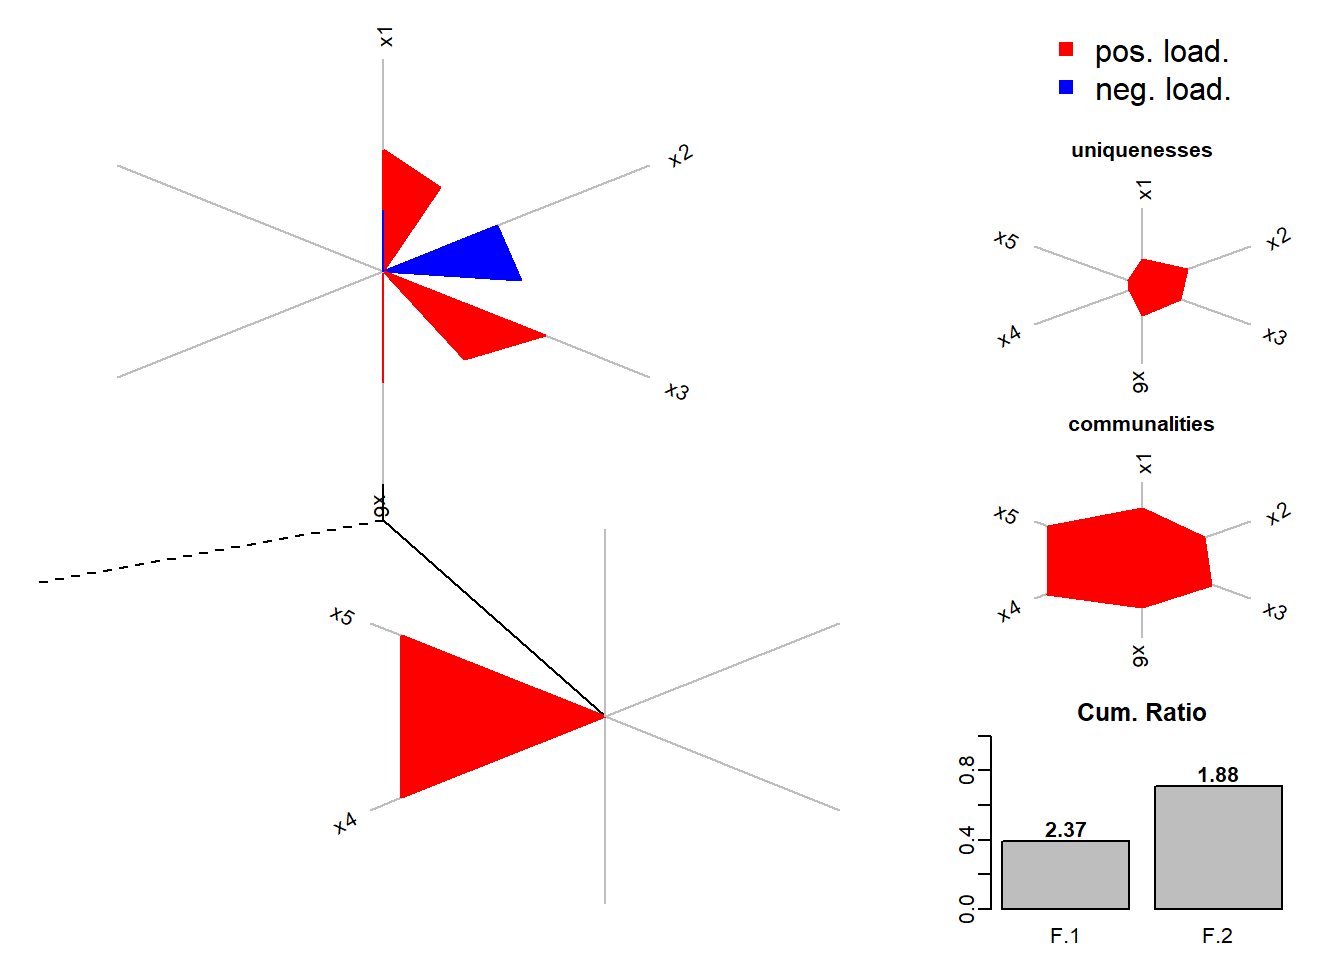
dandelion(facto.con.rota$loadings,bound = 0.5,mcex = c(-1,1),
          palet = c("red","blue"))