2 Lahman
The Lahman package contains several tables with data on pitching, hitting, fielding, and more. This package is updated with each season. The following references the 10.0-1 version.
type of data available: season-by-season, broken down by team for Batting / Pitching (so if a player played on multiple teams in one season, each team as their own row), broken down by team and position for Fielding
The main tables are:
People: player names, dates of birth, death, and other biographical infoBatting: batting statisticsbattingStats: calculates batting average (BA) plate appearances (PA), total bases (TB), slugging percentage (SlugPct), on-base percentage (OBP), on-base percentage + slugging (OPS), and batting average on balls in play (BABIP)
Pitching: pitching statisticsFielding: fielding statisticsSalaries: player name, year, team, league, and salary (from 1985-2016)Teams: overall season statistics- Additional tables cover information such as All Star appearances, post season data, managers, Hall of Fame voting, awards, parks, and colleges.
A full list of the tables and their contents can be found in the documentation.
library(Lahman)2.1 People
Here is an example of the People table. Each row contains data about a player’s birth date, hometown, death date, physical characteristics, first game, last game, and their ID for a few popular databases.
People %>%
sample_n(6)| playerID | birthYear | birthMonth | birthDay | birthCountry | birthState | birthCity | deathYear | deathMonth | deathDay | deathCountry | deathState | deathCity | nameFirst | nameLast | nameGiven | weight | height | bats | throws | debut | finalGame | retroID | bbrefID | deathDate | birthDate |
|---|---|---|---|---|---|---|---|---|---|---|---|---|---|---|---|---|---|---|---|---|---|---|---|---|---|
| lippto01 | 1870 | 6 | 4 | USA | MD | Baltimore | 1932 | 5 | 30 | USA | MD | Baltimore | Tom | Lipp | Thomas Charles | 170 | 71 | NA | R | 1897-09-18 | 1897-09-18 | lippt101 | lippto01 | 1932-05-30 | 1870-06-04 |
| brentja01 | 1994 | 9 | 14 | USA | MO | Ballwin | NA | NA | NA | NA | NA | NA | Jake | Brentz | Jacob Steven | 205 | 73 | L | L | 2021-04-03 | 2021-09-28 | brenj001 | brentja01 | NA | 1994-09-14 |
| hemonro99 | 1929 | 10 | 26 | USA | RI | Central Falls | 2021 | 12 | 12 | NA | NA | NA | Roland | Hemond | Roland | NA | NA | NA | NA | NA | NA | NA | hemonro99 | 2021-12-12 | 1929-10-26 |
| hasegsh01 | 1968 | 8 | 1 | Japan | Hyogo | Kobe | NA | NA | NA | NA | NA | NA | Shigetoshi | Hasegawa | Shigetoshi | 160 | 71 | R | R | 1997-04-05 | 2005-09-28 | hases001 | hasegsh01 | NA | 1968-08-01 |
| snydebr02 | 1982 | 5 | 25 | USA | OH | Sandusky | NA | NA | NA | NA | NA | NA | Brad | Snyder | Bradley Michael | 220 | 75 | L | L | 2010-09-07 | 2014-06-22 | snydb002 | snydebr02 | NA | 1982-05-25 |
| kippebo01 | 1964 | 7 | 8 | USA | IL | Aurora | NA | NA | NA | NA | NA | NA | Bob | Kipper | Robert Wayne | 200 | 74 | R | L | 1985-04-12 | 1992-07-27 | kippb001 | kippebo01 | NA | 1964-07-08 |
2.2 Batting
Example: José Iglesias
Here is what the Batting table looks like for a single player. Seasons where Iglesias played for multiple teams are highlighted to help show how this table is organized.
iglesias <- Batting %>%
  filter(playerID == "iglesjo01") %>%
arrange(desc(yearID))| playerID | yearID | stint | teamID | lgID | G | AB | R | H | X2B | X3B | HR | RBI | SB | CS | BB | SO | IBB | HBP | SH | SF | GIDP |
|---|---|---|---|---|---|---|---|---|---|---|---|---|---|---|---|---|---|---|---|---|---|
| iglesjo01 | 2021 | 1 | LAA | AL | 114 | 424 | 57 | 110 | 23 | 1 | 8 | 41 | 5 | 2 | 18 | 66 | 0 | 4 | 0 | 1 | 10 |
| iglesjo01 | 2021 | 2 | BOS | AL | 23 | 59 | 8 | 21 | 4 | 1 | 1 | 7 | 0 | 0 | 3 | 9 | 0 | 2 | 0 | 0 | 0 |
| iglesjo01 | 2020 | 1 | BAL | AL | 39 | 142 | 16 | 53 | 17 | 0 | 3 | 24 | 0 | 0 | 3 | 17 | 0 | 4 | 0 | 1 | 1 |
| iglesjo01 | 2019 | 1 | CIN | NL | 146 | 504 | 62 | 145 | 21 | 3 | 11 | 59 | 6 | 6 | 20 | 70 | 3 | 3 | 1 | 2 | 17 |
| iglesjo01 | 2018 | 1 | DET | AL | 125 | 432 | 43 | 116 | 31 | 3 | 5 | 48 | 15 | 6 | 19 | 47 | 0 | 8 | 3 | 2 | 11 |
| iglesjo01 | 2017 | 1 | DET | AL | 130 | 463 | 56 | 118 | 33 | 1 | 6 | 54 | 7 | 4 | 21 | 65 | 0 | 1 | 3 | 1 | 6 |
| iglesjo01 | 2016 | 1 | DET | AL | 137 | 467 | 57 | 119 | 26 | 0 | 4 | 32 | 7 | 4 | 28 | 50 | 1 | 8 | 7 | 3 | 12 |
| iglesjo01 | 2015 | 1 | DET | AL | 120 | 416 | 44 | 125 | 17 | 3 | 2 | 23 | 11 | 8 | 25 | 44 | 2 | 6 | 4 | 3 | 10 |
| iglesjo01 | 2013 | 1 | BOS | AL | 63 | 215 | 27 | 71 | 10 | 2 | 1 | 19 | 3 | 1 | 11 | 30 | 0 | 6 | 0 | 2 | 4 |
| iglesjo01 | 2013 | 2 | DET | AL | 46 | 135 | 12 | 35 | 6 | 0 | 2 | 10 | 2 | 1 | 4 | 30 | 0 | 5 | 4 | 0 | 3 |
| iglesjo01 | 2012 | 1 | BOS | AL | 25 | 68 | 5 | 8 | 2 | 0 | 1 | 2 | 1 | 0 | 4 | 16 | 0 | 3 | 2 | 0 | 2 |
| iglesjo01 | 2011 | 1 | BOS | AL | 10 | 6 | 3 | 2 | 0 | 0 | 0 | 0 | 0 | 0 | 0 | 2 | 0 | 0 | 0 | 0 | 0 |
battingStats() produces a data frame with the same variables as Batting, and additionally calculates some statistics (as mentioned above). This table is only showing playerID, yearID, teamID, and the variables exclusive to battingStats().
iglesias_stats <- battingStats(iglesias) %>%
dplyr::select(playerID, yearID, teamID, BA:BABIP)| playerID | yearID | teamID | BA | PA | TB | SlugPct | OBP | OPS | BABIP |
|---|---|---|---|---|---|---|---|---|---|
| iglesjo01 | 2021 | LAA | 0.259 | 447 | 159 | 0.375 | 0.295 | 0.670 | 0.291 |
| iglesjo01 | 2021 | BOS | 0.356 | 64 | 30 | 0.508 | 0.406 | 0.914 | 0.408 |
| iglesjo01 | 2020 | BAL | 0.373 | 150 | 79 | 0.556 | 0.400 | 0.956 | 0.407 |
| iglesjo01 | 2019 | CIN | 0.288 | 530 | 205 | 0.407 | 0.318 | 0.725 | 0.315 |
| iglesjo01 | 2018 | DET | 0.269 | 464 | 168 | 0.389 | 0.310 | 0.699 | 0.291 |
| iglesjo01 | 2017 | DET | 0.255 | 489 | 171 | 0.369 | 0.288 | 0.657 | 0.285 |
| iglesjo01 | 2016 | DET | 0.255 | 513 | 157 | 0.336 | 0.306 | 0.642 | 0.276 |
| iglesjo01 | 2015 | DET | 0.300 | 454 | 154 | 0.370 | 0.347 | 0.717 | 0.330 |
| iglesjo01 | 2013 | BOS | 0.330 | 234 | 88 | 0.409 | 0.376 | 0.785 | 0.376 |
| iglesjo01 | 2013 | DET | 0.259 | 148 | 47 | 0.348 | 0.306 | 0.654 | 0.320 |
| iglesjo01 | 2012 | BOS | 0.118 | 77 | 13 | 0.191 | 0.200 | 0.391 | 0.137 |
| iglesjo01 | 2011 | BOS | 0.333 | 6 | 2 | 0.333 | 0.333 | 0.666 | 0.500 |
2.3 Pitching
Example: Justin Verlander
Just like the Batting table, the Pitching table is split by season, and team if the player pitched for several teams in one year. There are two rows for 2017 because Verlander moved from the Tigers to the Astros.
verlander <- Pitching %>%
  filter(playerID == "verlaju01") %>%
arrange(desc(yearID))| playerID | yearID | stint | teamID | lgID | W | L | G | GS | CG | SHO | SV | IPouts | H | ER | HR | BB | SO | BAOpp | ERA | IBB | WP | HBP | BK | BFP | GF | R | SH | SF | GIDP |
|---|---|---|---|---|---|---|---|---|---|---|---|---|---|---|---|---|---|---|---|---|---|---|---|---|---|---|---|---|---|
| verlaju01 | 2020 | 1 | HOU | AL | 1 | 0 | 1 | 1 | 0 | 0 | 0 | 18 | 3 | 2 | 2 | 1 | 7 | 0.150 | 3.00 | 0 | 0 | 0 | 0 | 21 | 0 | 2 | 0 | 0 | 1 |
| verlaju01 | 2019 | 1 | HOU | AL | 21 | 6 | 34 | 34 | 2 | 1 | 0 | 669 | 137 | 64 | 36 | 42 | 300 | 0.172 | 2.58 | 0 | 4 | 6 | 0 | 847 | 0 | 66 | 0 | 2 | 7 |
| verlaju01 | 2018 | 1 | HOU | AL | 16 | 9 | 34 | 34 | 1 | 1 | 0 | 642 | 156 | 60 | 28 | 37 | 290 | 0.200 | 2.52 | 0 | 5 | 8 | 2 | 833 | 0 | 63 | 2 | 5 | 3 |
| verlaju01 | 2017 | 1 | DET | AL | 10 | 8 | 28 | 28 | 0 | 0 | 0 | 516 | 153 | 73 | 23 | 67 | 176 | 0.234 | 3.82 | 4 | 5 | 3 | 0 | 729 | 0 | 76 | 1 | 4 | 8 |
| verlaju01 | 2017 | 2 | HOU | AL | 5 | 0 | 5 | 5 | 0 | 0 | 0 | 102 | 17 | 4 | 4 | 5 | 43 | 0.149 | 1.06 | 0 | 0 | 1 | 0 | 120 | 0 | 4 | 0 | 0 | 4 |
| verlaju01 | 2016 | 1 | DET | AL | 16 | 9 | 34 | 34 | 2 | 0 | 0 | 683 | 171 | 77 | 30 | 57 | 254 | 0.207 | 3.04 | 1 | 6 | 8 | 0 | 903 | 0 | 81 | 4 | 7 | 8 |
2.4 Fielding
Example: DJ LeMahieu
The Fielding table contains some of the basic statistics used for fielders. Notice the last five variables; they all say “NA”. This means that when there is a missing value the Lahman database fills in “NA” as opposed to leaving the box blank.
Fielding %>%
  filter(playerID == "lemahdj01") %>%
arrange(desc(yearID))| playerID | yearID | stint | teamID | lgID | POS | G | GS | InnOuts | PO | A | E | DP | PB | WP | SB | CS | ZR |
|---|---|---|---|---|---|---|---|---|---|---|---|---|---|---|---|---|---|
| lemahdj01 | 2021 | 1 | NYA | AL | 1B | 55 | 33 | 963 | 286 | 13 | 1 | 21 | NA | NA | NA | NA | NA |
| lemahdj01 | 2021 | 1 | NYA | AL | 2B | 83 | 77 | 1989 | 117 | 156 | 2 | 48 | NA | NA | NA | NA | NA |
| lemahdj01 | 2021 | 1 | NYA | AL | 3B | 39 | 36 | 897 | 18 | 62 | 6 | 6 | NA | NA | NA | NA | NA |
| lemahdj01 | 2020 | 1 | NYA | AL | 1B | 11 | 1 | 72 | 24 | 0 | 0 | 1 | NA | NA | NA | NA | NA |
| lemahdj01 | 2020 | 1 | NYA | AL | 2B | 37 | 34 | 812 | 51 | 82 | 4 | 19 | NA | NA | NA | NA | NA |
| lemahdj01 | 2020 | 1 | NYA | AL | 3B | 11 | 11 | 261 | 10 | 16 | 2 | 2 | NA | NA | NA | NA | NA |
| lemahdj01 | 2019 | 1 | NYA | AL | 1B | 40 | 28 | 786 | 215 | 19 | 2 | 24 | NA | NA | NA | NA | NA |
| lemahdj01 | 2019 | 1 | NYA | AL | 2B | 75 | 66 | 1739 | 118 | 155 | 2 | 32 | NA | NA | NA | NA | NA |
| lemahdj01 | 2019 | 1 | NYA | AL | 3B | 52 | 47 | 1200 | 18 | 87 | 4 | 7 | NA | NA | NA | NA | NA |
| lemahdj01 | 2018 | 1 | COL | NL | 2B | 128 | 127 | 3345 | 209 | 378 | 4 | 90 | NA | NA | NA | NA | NA |
| lemahdj01 | 2017 | 1 | COL | NL | 2B | 153 | 151 | 3906 | 251 | 470 | 8 | 106 | NA | NA | NA | NA | NA |
| lemahdj01 | 2016 | 1 | COL | NL | 2B | 146 | 144 | 3728 | 276 | 422 | 6 | 91 | NA | NA | NA | NA | NA |
| lemahdj01 | 2015 | 1 | COL | NL | 2B | 149 | 146 | 3852 | 300 | 452 | 9 | 120 | NA | NA | NA | NA | NA |
| lemahdj01 | 2014 | 1 | COL | NL | 1B | 1 | 0 | 3 | 0 | 0 | 0 | 0 | NA | NA | NA | NA | NA |
| lemahdj01 | 2014 | 1 | COL | NL | 2B | 144 | 135 | 3539 | 257 | 413 | 6 | 99 | NA | NA | NA | NA | NA |
| lemahdj01 | 2014 | 1 | COL | NL | 3B | 7 | 4 | 115 | 2 | 5 | 0 | 0 | NA | NA | NA | NA | NA |
| lemahdj01 | 2014 | 1 | COL | NL | SS | 1 | 0 | 3 | 0 | 0 | 0 | 0 | NA | NA | NA | NA | NA |
| lemahdj01 | 2013 | 1 | COL | NL | 1B | 1 | 0 | 3 | 2 | 0 | 0 | 0 | NA | NA | NA | NA | NA |
| lemahdj01 | 2013 | 1 | COL | NL | 2B | 90 | 86 | 2250 | 168 | 271 | 3 | 57 | NA | NA | NA | NA | NA |
| lemahdj01 | 2013 | 1 | COL | NL | 3B | 14 | 9 | 302 | 6 | 24 | 0 | 2 | NA | NA | NA | NA | NA |
| lemahdj01 | 2013 | 1 | COL | NL | SS | 1 | 0 | 3 | 0 | 0 | 0 | 0 | NA | NA | NA | NA | NA |
| lemahdj01 | 2012 | 1 | COL | NL | 1B | 1 | 0 | 9 | 1 | 0 | 0 | 0 | NA | NA | NA | NA | NA |
| lemahdj01 | 2012 | 1 | COL | NL | 2B | 67 | 60 | 1527 | 105 | 204 | 2 | 33 | NA | NA | NA | NA | NA |
| lemahdj01 | 2012 | 1 | COL | NL | 3B | 9 | 5 | 138 | 2 | 8 | 0 | 0 | NA | NA | NA | NA | NA |
| lemahdj01 | 2012 | 1 | COL | NL | SS | 2 | 0 | 6 | 0 | 0 | 0 | 0 | NA | NA | NA | NA | NA |
| lemahdj01 | 2011 | 1 | CHN | NL | 1B | 1 | 1 | 24 | 8 | 0 | 0 | 1 | NA | NA | NA | NA | NA |
| lemahdj01 | 2011 | 1 | CHN | NL | 2B | 15 | 8 | 233 | 16 | 22 | 0 | 5 | NA | NA | NA | NA | NA |
| lemahdj01 | 2011 | 1 | CHN | NL | 3B | 11 | 6 | 180 | 6 | 12 | 4 | 5 | NA | NA | NA | NA | NA |
2.5 Salaries
The Salaries table is very simple with only five variables. One limitation of it is restricted time frame; the earliest season available is 1985 and the latest season is seven years prior to the current year.
Salaries %>%
  filter(yearID == 2016) %>%
sample_n(15) | yearID | teamID | lgID | playerID | salary |
|---|---|---|---|---|
| 2016 | OAK | AL | hendrli01 | 523400 |
| 2016 | CHN | NL | rosscza01 | 524500 |
| 2016 | BAL | AL | mcfartj01 | 523500 |
| 2016 | MIN | AL | rosared01 | 542500 |
| 2016 | LAN | NL | howeljp01 | 6250000 |
| 2016 | CLE | AL | gomesya01 | 2583333 |
| 2016 | ATL | NL | perezwi01 | 511250 |
| 2016 | TEX | AL | barneto01 | 1500000 |
| 2016 | SLN | NL | siegrke01 | 539000 |
| 2016 | SDN | NL | quackke01 | 521200 |
| 2016 | LAN | NL | guerral01 | 7500000 |
| 2016 | TEX | AL | odorro01 | 522700 |
| 2016 | CHN | NL | solerjo01 | 3666666 |
| 2016 | NYN | NL | harvema01 | 4325000 |
| 2016 | HOU | AL | tuckepr01 | 515000 |
2.6 Teams
This is what the Teams table looks like for the 2021 season. It includes 48 variables, covering team identifications, standings, totals for numerous statistics, home ballpark, attendance, park factors, and their ID for a couple other databases.
Teams %>%
  arrange(desc(yearID)) %>%
head(30)| yearID | lgID | teamID | franchID | divID | Rank | G | Ghome | W | L | DivWin | WCWin | LgWin | WSWin | R | AB | H | X2B | X3B | HR | BB | SO | SB | CS | HBP | SF | RA | ER | ERA | CG | SHO | SV | IPouts | HA | HRA | BBA | SOA | E | DP | FP | name | park | attendance | BPF | PPF | teamIDBR | teamIDlahman45 | teamIDretro |
|---|---|---|---|---|---|---|---|---|---|---|---|---|---|---|---|---|---|---|---|---|---|---|---|---|---|---|---|---|---|---|---|---|---|---|---|---|---|---|---|---|---|---|---|---|---|---|---|
| 2021 | NL | ARI | ARI | W | 5 | 162 | 81 | 52 | 110 | N | N | N | N | 679 | 5489 | 1297 | 308 | 31 | 144 | 537 | 1465 | 43 | 16 | 54 | 28 | 893 | 804 | 5.11 | 3 | 4 | 22 | 4252 | 1480 | 232 | 555 | 1238 | 100 | 113 | 0.983 | Arizona Diamondbacks | Chase Field | 1043010 | 99 | 101 | ARI | ARI | ARI |
| 2021 | NL | ATL | ATL | E | 1 | 161 | 80 | 88 | 73 | Y | N | Y | Y | 790 | 5363 | 1307 | 269 | 20 | 239 | 549 | 1453 | 59 | 19 | 67 | 43 | 656 | 608 | 3.88 | 2 | 18 | 40 | 4232 | 1237 | 183 | 516 | 1417 | 71 | 104 | 0.988 | Atlanta Braves | SunTrust Park | 2300247 | 107 | 105 | ATL | ATL | ATL |
| 2021 | AL | BAL | BAL | E | 5 | 162 | 81 | 52 | 110 | N | N | N | N | 659 | 5420 | 1296 | 266 | 15 | 195 | 451 | 1454 | 54 | 23 | 65 | 31 | 956 | 910 | 5.84 | 1 | 5 | 26 | 4206 | 1518 | 258 | 563 | 1234 | 74 | 101 | 0.987 | Baltimore Orioles | Oriole Park at Camden Yards | 793229 | 103 | 105 | BAL | BAL | BAL |
| 2021 | AL | BOS | BOS | E | 2 | 162 | 81 | 92 | 70 | N | Y | N | N | 829 | 5495 | 1434 | 330 | 23 | 219 | 512 | 1386 | 40 | 21 | 61 | 42 | 749 | 671 | 4.26 | 0 | 7 | 49 | 4257 | 1409 | 176 | 546 | 1527 | 108 | 143 | 0.981 | Boston Red Sox | Fenway Park II | 1725323 | 109 | 109 | BOS | BOS | BOS |
| 2021 | AL | CHA | CHW | C | 1 | 162 | 81 | 93 | 69 | Y | N | N | N | 796 | 5357 | 1373 | 275 | 22 | 190 | 586 | 1389 | 57 | 20 | 78 | 39 | 636 | 581 | 3.73 | 4 | 13 | 43 | 4210 | 1205 | 182 | 485 | 1588 | 97 | 112 | 0.982 | Chicago White Sox | Guaranteed Rate Field | 1596385 | 101 | 100 | CHW | CHA | CHA |
| 2021 | NL | CHN | CHC | C | 4 | 162 | 81 | 71 | 91 | N | N | N | N | 705 | 5306 | 1255 | 225 | 26 | 210 | 502 | 1596 | 86 | 37 | 92 | 30 | 839 | 765 | 4.87 | 1 | 8 | 40 | 4238 | 1386 | 235 | 596 | 1358 | 87 | 149 | 0.985 | Chicago Cubs | Wrigley Field | 1978934 | 100 | 101 | CHC | CHN | CHN |
| 2021 | NL | CIN | CIN | C | 3 | 162 | 81 | 83 | 79 | N | N | N | N | 786 | 5423 | 1352 | 295 | 13 | 222 | 553 | 1425 | 36 | 24 | 105 | 45 | 760 | 702 | 4.40 | 1 | 8 | 41 | 4303 | 1330 | 206 | 617 | 1524 | 91 | 124 | 0.984 | Cincinnati Reds | Great American Ball Park | 1505024 | 113 | 113 | CIN | CIN | CIN |
| 2021 | AL | CLE | CLE | C | 2 | 162 | 81 | 80 | 82 | N | N | N | N | 717 | 5332 | 1269 | 248 | 22 | 203 | 453 | 1387 | 109 | 17 | 64 | 36 | 727 | 679 | 4.34 | 0 | 9 | 39 | 4224 | 1281 | 216 | 522 | 1391 | 86 | 138 | 0.985 | Cleveland Indians | Progressive Field | 1114368 | 101 | 101 | CLE | CLE | CLE |
| 2021 | NL | COL | COL | W | 4 | 161 | 81 | 74 | 87 | N | N | N | N | 739 | 5374 | 1338 | 275 | 34 | 182 | 491 | 1356 | 76 | 23 | 58 | 36 | 796 | 748 | 4.82 | 3 | 6 | 33 | 4191 | 1397 | 196 | 539 | 1269 | 73 | 140 | 0.987 | Colorado Rockies | Coors Field | 1938645 | 112 | 113 | COL | COL | COL |
| 2021 | AL | DET | DET | C | 3 | 162 | 81 | 77 | 85 | N | N | N | N | 697 | 5376 | 1299 | 236 | 37 | 179 | 490 | 1514 | 88 | 25 | 44 | 50 | 756 | 681 | 4.32 | 2 | 7 | 42 | 4259 | 1370 | 199 | 571 | 1259 | 83 | 136 | 0.986 | Detroit Tigers | Comerica Park | 1102621 | 96 | 98 | DET | DET | DET |
| 2021 | AL | HOU | HOU | W | 1 | 162 | 81 | 95 | 67 | Y | N | Y | N | 863 | 5593 | 1496 | 299 | 14 | 221 | 569 | 1222 | 53 | 16 | 64 | 54 | 658 | 607 | 3.78 | 2 | 8 | 34 | 4335 | 1231 | 187 | 549 | 1456 | 69 | 126 | 0.988 | Houston Astros | Minute Maid Park | 2068509 | 101 | 99 | HOU | HOU | HOU |
| 2021 | AL | KCA | KCR | C | 4 | 162 | 81 | 74 | 88 | N | N | N | N | 686 | 5427 | 1349 | 251 | 29 | 163 | 421 | 1258 | 124 | 33 | 55 | 52 | 788 | 731 | 4.64 | 1 | 7 | 37 | 4252 | 1375 | 189 | 591 | 1344 | 84 | 152 | 0.985 | Kansas City Royals | Kauffman Stadium | 1159613 | 105 | 106 | KCR | KCA | KCA |
| 2021 | AL | LAA | ANA | W | 4 | 162 | 82 | 77 | 85 | N | N | N | N | 723 | 5437 | 1331 | 265 | 23 | 190 | 464 | 1394 | 79 | 26 | 59 | 25 | 804 | 741 | 4.69 | 1 | 4 | 39 | 4265 | 1373 | 188 | 592 | 1453 | 88 | 131 | 0.985 | Los Angeles Angels of Anaheim | Angel Stadium of Anaheim | 1515689 | 102 | 103 | LAA | ANA | ANA |
| 2021 | NL | LAN | LAD | W | 2 | 162 | 81 | 106 | 56 | N | Y | N | N | 830 | 5445 | 1330 | 247 | 24 | 237 | 613 | 1408 | 65 | 17 | 104 | 45 | 561 | 486 | 3.01 | 1 | 17 | 56 | 4356 | 1107 | 161 | 486 | 1599 | 89 | 94 | 0.985 | Los Angeles Dodgers | Dodger Stadium | 2804693 | 100 | 97 | LAD | LAN | LAN |
| 2021 | NL | MIA | FLA | E | 4 | 162 | 81 | 67 | 95 | N | N | N | N | 623 | 5348 | 1244 | 226 | 23 | 158 | 450 | 1553 | 106 | 29 | 65 | 30 | 701 | 622 | 3.96 | 1 | 8 | 33 | 4245 | 1282 | 162 | 529 | 1381 | 122 | 146 | 0.979 | Miami Marlins | Marlins Park | 642617 | 98 | 99 | MIA | FLO | MIA |
| 2021 | NL | MIL | MIL | C | 1 | 162 | 81 | 95 | 67 | Y | N | N | N | 738 | 5362 | 1251 | 255 | 18 | 194 | 586 | 1465 | 82 | 21 | 88 | 35 | 623 | 558 | 3.50 | 2 | 19 | 44 | 4308 | 1156 | 168 | 537 | 1618 | 94 | 102 | 0.984 | Milwaukee Brewers | Miller Park | 1824282 | 101 | 101 | MIL | ML4 | MIL |
| 2021 | AL | MIN | MIN | C | 5 | 162 | 81 | 73 | 89 | N | N | N | N | 729 | 5431 | 1311 | 271 | 17 | 228 | 525 | 1405 | 54 | 15 | 70 | 42 | 834 | 762 | 4.83 | 1 | 9 | 42 | 4258 | 1392 | 239 | 484 | 1317 | 107 | 138 | 0.982 | Minnesota Twins | Target Field | 1310199 | 98 | 98 | MIN | MIN | MIN |
| 2021 | AL | NYA | NYY | E | 2 | 162 | 81 | 92 | 70 | N | Y | N | N | 711 | 5331 | 1266 | 213 | 12 | 222 | 621 | 1482 | 63 | 18 | 63 | 34 | 669 | 596 | 3.74 | 3 | 13 | 47 | 4306 | 1243 | 196 | 492 | 1569 | 98 | 112 | 0.983 | New York Yankees | Yankee Stadium III | 1959854 | 100 | 99 | NYY | NYA | NYA |
| 2021 | NL | NYN | NYM | E | 3 | 162 | 81 | 77 | 85 | N | N | N | N | 636 | 5210 | 1243 | 228 | 18 | 176 | 495 | 1392 | 54 | 26 | 94 | 23 | 668 | 597 | 3.90 | 2 | 8 | 41 | 4138 | 1221 | 190 | 475 | 1453 | 95 | 121 | 0.983 | New York Mets | Citi Field | 1511926 | 95 | 95 | NYM | NYN | NYN |
| 2021 | AL | OAK | OAK | W | 3 | 162 | 81 | 86 | 76 | N | N | N | N | 743 | 5395 | 1284 | 271 | 19 | 199 | 545 | 1349 | 88 | 20 | 98 | 49 | 687 | 640 | 4.02 | 3 | 11 | 39 | 4299 | 1362 | 191 | 439 | 1332 | 72 | 116 | 0.987 | Oakland Athletics | O.co Coliseum | 701430 | 95 | 94 | OAK | OAK | OAK |
| 2021 | NL | PHI | PHI | E | 2 | 162 | 81 | 82 | 80 | N | N | N | N | 734 | 5366 | 1288 | 262 | 24 | 198 | 564 | 1402 | 77 | 19 | 67 | 43 | 745 | 692 | 4.39 | 5 | 12 | 36 | 4256 | 1321 | 200 | 509 | 1480 | 94 | 142 | 0.984 | Philadelphia Phillies | Citizens Bank Park | 1515890 | 99 | 99 | PHI | PHI | PHI |
| 2021 | NL | PIT | PIT | C | 5 | 162 | 81 | 61 | 101 | N | N | N | N | 609 | 5336 | 1261 | 240 | 35 | 124 | 529 | 1328 | 60 | 30 | 49 | 37 | 833 | 788 | 5.08 | 0 | 6 | 25 | 4189 | 1400 | 213 | 606 | 1312 | 70 | 139 | 0.988 | Pittsburgh Pirates | PNC Park | 859498 | 98 | 100 | PIT | PIT | PIT |
| 2021 | NL | SDN | SDP | W | 3 | 162 | 81 | 79 | 83 | N | N | N | N | 729 | 5384 | 1305 | 273 | 21 | 180 | 586 | 1324 | 110 | 39 | 61 | 46 | 708 | 651 | 4.10 | 2 | 11 | 43 | 4290 | 1277 | 205 | 516 | 1517 | 82 | 139 | 0.986 | San Diego Padres | Petco Park | 2191950 | 92 | 92 | SDP | SDN | SDN |
| 2021 | AL | SEA | SEA | W | 2 | 162 | 81 | 90 | 72 | N | N | N | N | 697 | 5355 | 1209 | 233 | 11 | 199 | 535 | 1492 | 64 | 24 | 72 | 36 | 748 | 688 | 4.30 | 1 | 10 | 51 | 4321 | 1356 | 197 | 485 | 1328 | 79 | 135 | 0.986 | Seattle Mariners | T-Mobile Park | 1215985 | 95 | 96 | SEA | SEA | SEA |
| 2021 | NL | SFN | SFG | W | 1 | 162 | 81 | 107 | 55 | Y | N | N | N | 804 | 5462 | 1360 | 271 | 25 | 241 | 602 | 1461 | 66 | 14 | 64 | 30 | 594 | 524 | 3.24 | 2 | 18 | 56 | 4365 | 1254 | 151 | 416 | 1425 | 80 | 122 | 0.986 | San Francisco Giants | Oracle Park | 1679484 | 98 | 97 | SFG | SFN | SFN |
| 2021 | NL | SLN | STL | C | 2 | 162 | 81 | 90 | 72 | N | Y | N | N | 706 | 5351 | 1303 | 261 | 22 | 198 | 478 | 1341 | 89 | 22 | 86 | 44 | 672 | 626 | 3.98 | 3 | 15 | 50 | 4251 | 1234 | 152 | 608 | 1225 | 84 | 137 | 0.986 | St. Louis Cardinals | Busch Stadium III | 2102530 | 92 | 92 | STL | SLN | SLN |
| 2021 | AL | TBA | TBD | E | 1 | 162 | 81 | 100 | 62 | Y | N | N | N | 857 | 5507 | 1336 | 288 | 36 | 222 | 585 | 1542 | 88 | 42 | 72 | 41 | 651 | 593 | 3.67 | 1 | 13 | 42 | 4367 | 1264 | 184 | 436 | 1478 | 80 | 130 | 0.986 | Tampa Bay Rays | Tropicana Field | 761072 | 92 | 91 | TBR | TBA | TBA |
| 2021 | AL | TEX | TEX | W | 5 | 162 | 81 | 60 | 102 | N | N | N | N | 625 | 5405 | 1254 | 225 | 24 | 167 | 433 | 1381 | 106 | 29 | 58 | 31 | 815 | 758 | 4.79 | 0 | 3 | 31 | 4273 | 1402 | 232 | 513 | 1239 | 83 | 146 | 0.986 | Texas Rangers | Globe Life Field | 2110258 | 99 | 101 | TEX | TEX | TEX |
| 2021 | AL | TOR | TOR | E | 4 | 162 | 80 | 91 | 71 | N | N | N | N | 846 | 5476 | 1455 | 285 | 13 | 262 | 496 | 1218 | 81 | 20 | 51 | 35 | 663 | 610 | 3.91 | 1 | 14 | 34 | 4216 | 1257 | 209 | 473 | 1468 | 90 | 122 | 0.984 | Toronto Blue Jays | Sahlen Field | 805901 | 102 | 101 | TOR | TOR | TOR |
| 2021 | NL | WAS | WSN | E | 5 | 162 | 81 | 65 | 97 | N | N | N | N | 724 | 5385 | 1388 | 272 | 20 | 182 | 573 | 1303 | 56 | 26 | 84 | 31 | 820 | 743 | 4.80 | 1 | 8 | 36 | 4183 | 1364 | 247 | 548 | 1346 | 96 | 116 | 0.983 | Washington Nationals | Nationals Park | 1465543 | 95 | 96 | WSN | MON | WAS |
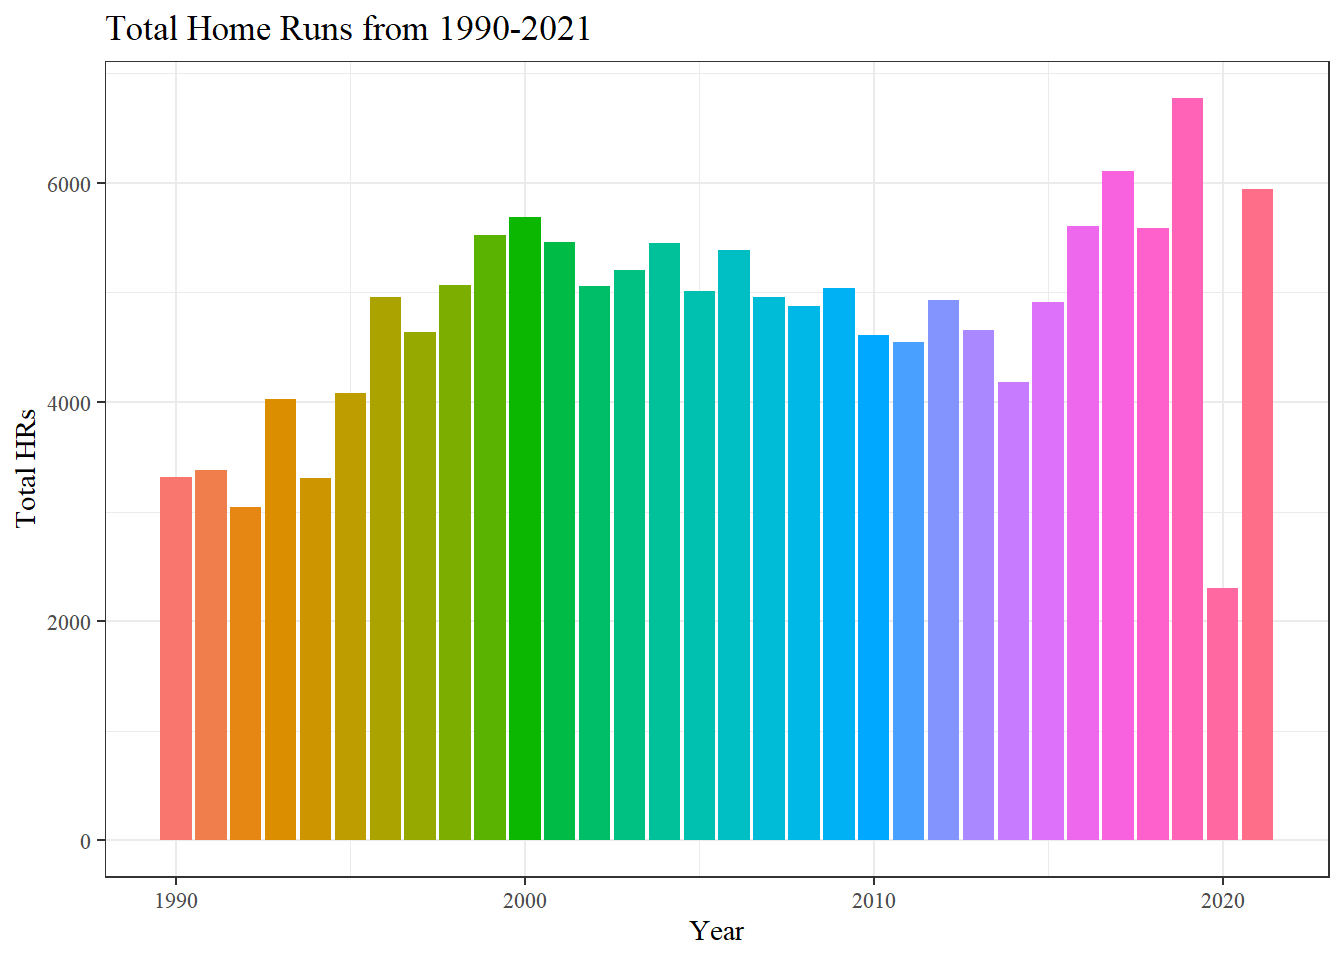
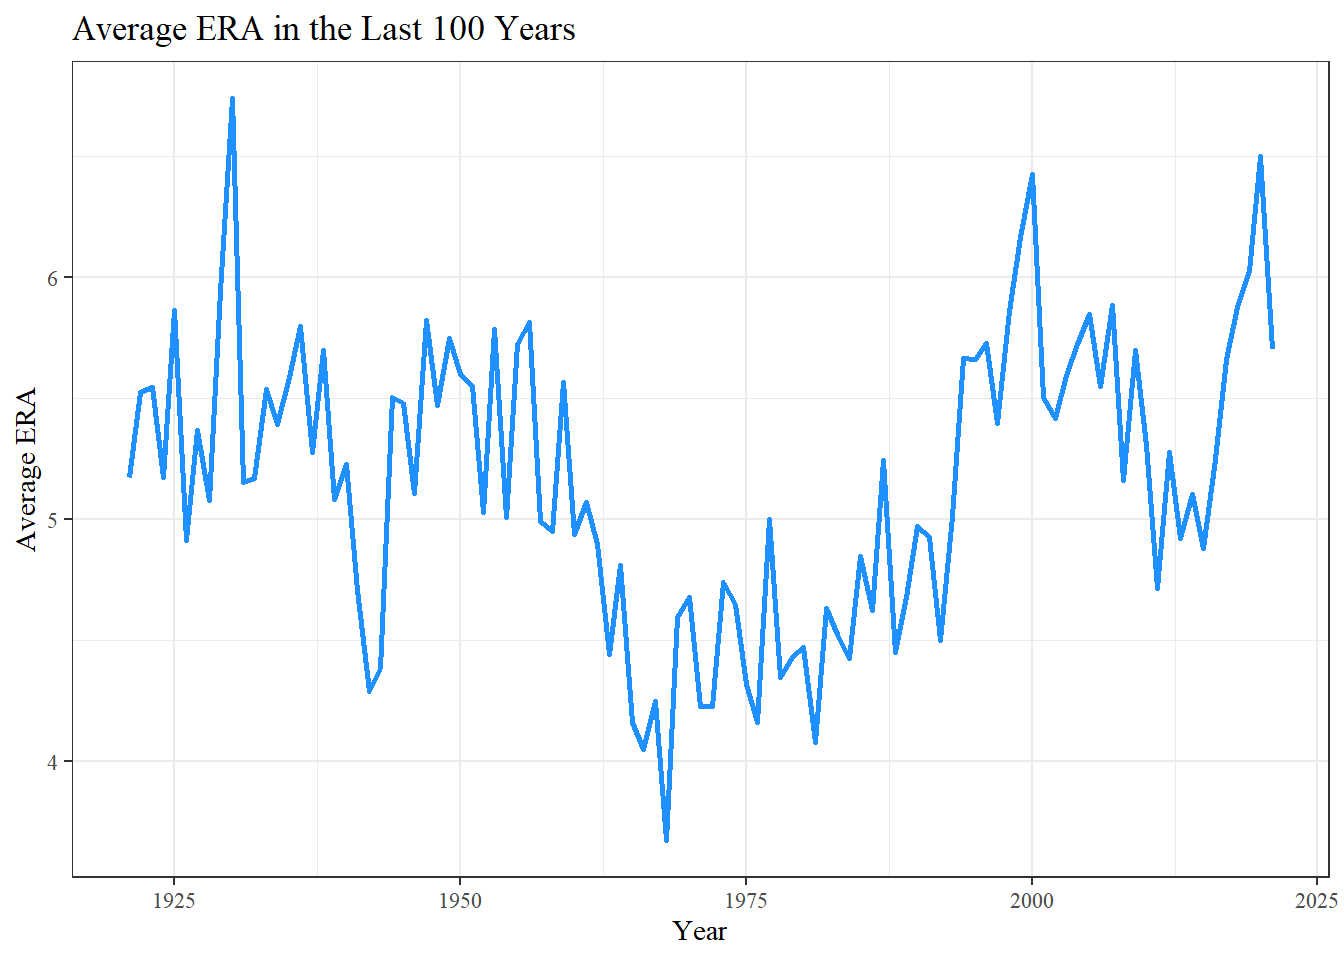
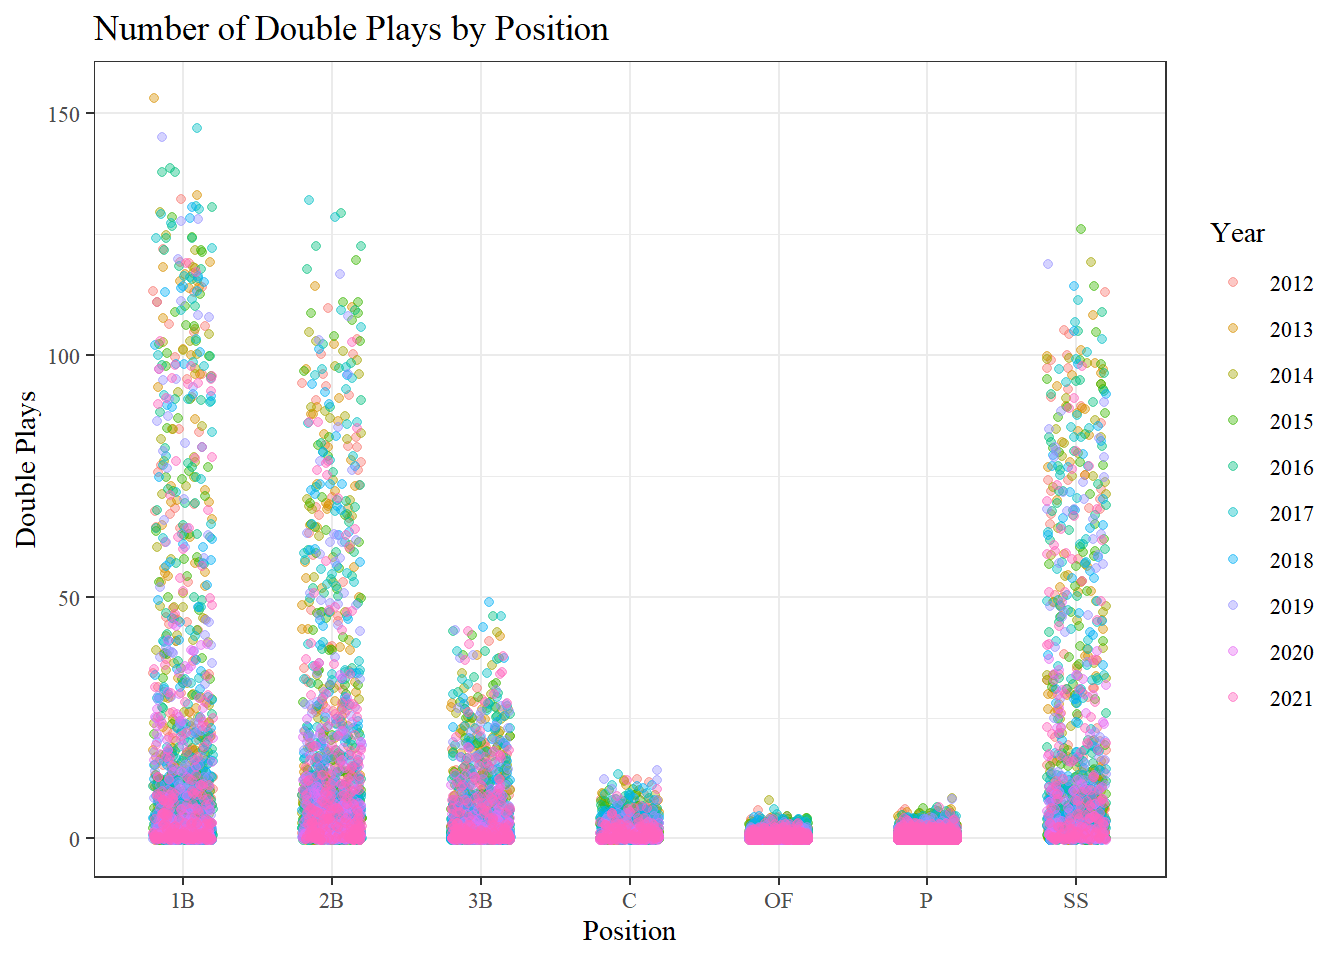
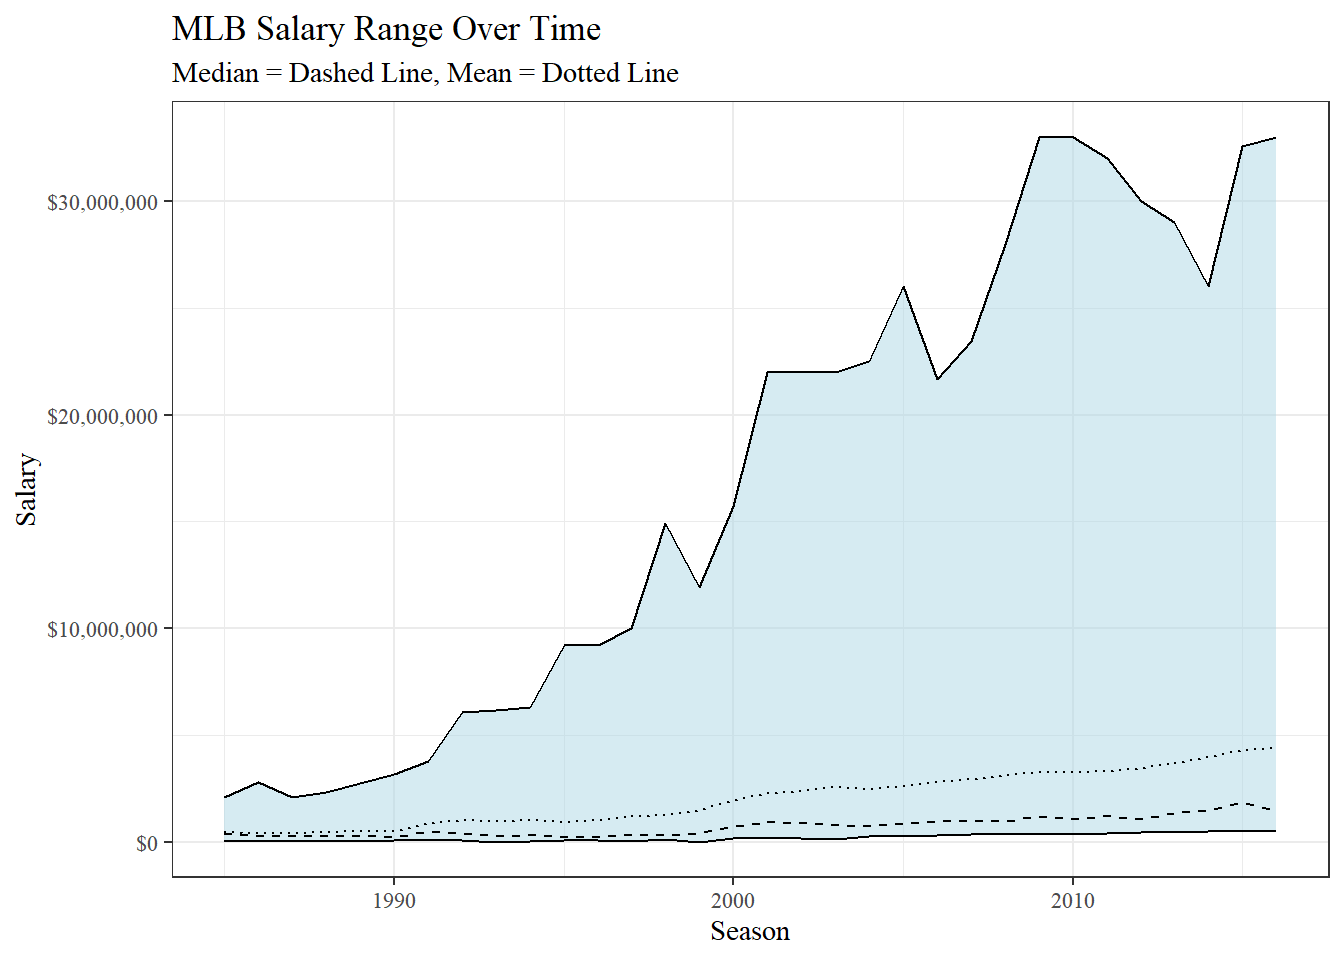
2.7 Visualizations
Here are a few visualizations to help show the data available in the Lahman package.
Salaries
Looking Ahead: Many of these tables contain minimal variables that are specific to one part of baseball (such as pitching or fielding). It would be helpful if we could join multiple tables together. We will talk more about creating plots in the Visualizations section.