2.2 Activity: Monday breakups
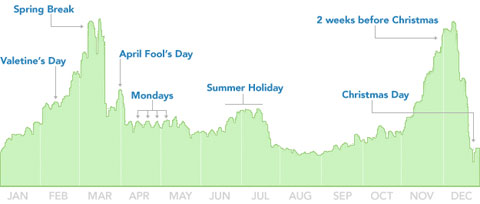
Figure 2.1: Plot showing breakups across a year.
Researcher David McCandless examined changes in peoples’ relationship status, in particular, breakups. As shown in the plot above, there were repeated peaks on Mondays.
Based on this initial examination of data, McCandless speculated that breakups are reported at a higher frequency on Mondays. To explore this further, McCandless collected a random sample of 50 breakups reported on Facebook in 2010. Of these sampled breakups, 13 occurred on a Monday.
In this activity, you will be exploring the following question:
Are breakups more likely to be reported on Monday?
| To access the activty |
|---|
Log in to your class in Desmos. Find the activty called, 2.2: Monday breakups |
| Resources |
|---|
| ✓ Instructor solutions |
| ⏯ Video walkthrough: Monday breakups |