Chapter 3 Where to Find Data
This is a longer and more detailed chapter following on Alternative Methods of Data Collection. Many of the data sources described here are also covered there, but in this chapter we’ll go into a bit more depth about the ins and outs of using these sources.
This list is not complete, it’s more of a sample of 4 really good and common data sources. If you can get comfortable collecting data from these it’ll be easier to begin exploring other sources, and soon you’ll be swimming in data.
In this chapter there’ll be a separate sub-section for each data source, where I’ll first describe the data in some depth before including a video walking you through navigating the website. I think showing rather than telling is an easier way to communicate where to look when getting started on the sites. The best way to learn about the data though is to go in an practice creating your own data.
Once you’ve created the data there’s the challenge of loading that data into R. As they say, that’s a challenge for another day or another chapter. In case that was unclear, the link embedded under the word “chapter” takes you to a chapter about reading data into R.
3.1 Before we begin
One of the most important things to understand in looking for data is the unit of observation and unit of analysis of our research question. There is lots of great data that just wont match with the unit of analysis you need. Let’s remind ourselves quickly what those terms mean.
Unit of analysis is what is the entity (people, groups, communities, states, phenomena) that your research question is concerned with while the unit of observation is the entity you collect or observe data for. Often times they will match and other times they’ll be slightly different. But being cognizant of the different units of observation that are available from different sources is critical to being able to develop new meaningful projects. We can do a study based on data that is collected at the state level, or for individuals, or for events (credit card transactions, for instance). Whether those units of observation are useful to answer our research question depends on the question we have.
Sometimes our unit of analysis is dictated by our research question, but often it’s dictated by the availability of data. One might not want to study voting habits at the county level, but unfortunately counties is the smallest unit of geography that voting data is regularly available for. That can alter research questions to make them focused on phenomena that occurs in counties. It’s not much fun asking research questions that you can’t hope to get data to answer, so often times researchers end up asking questions about units of observation where they know they can get the data.
Let’s start then by talking about a few different units of observation, so that we’re clear on the terms I might be using throughout this chapter.
- Events
- Individual
- Families
- Neighborhood - which are often measured as census tracts
- City
- County
- Metropolitan Area
- State
- Nation
3.2 General Social Survey
Probably the easiest level of analysis to understand is the individual. It’s impossible to divide individuals into smaller units, though they can be aggregated into larger groups (families, neighborhoods, cities, states, countries). If you’re interested in studying something about individuals, in particular their opinions or views, the General Social Survey) is a wonderful source.
It’s a nationally representative survey of adults that is conducted every other year after being first run in 1972. Many of the questions are repeated each year or over several iterations, allowing researchers to look at changes in opinions over decades or longer. And they ask about A LOT. They collect standard demographic information (race, age, sex) but ask really detailed queries about crime and violence, morality, science, spending priorities for the government, psychological well-being, religion, politics and just so much more. It’s an incredibly nosy survey.
As of writing this, there are 6110 questions that have been asked as part of the survey since 1972. Honestly, I can’t express how many different things they ask about. I mean really, look at how personal these questions get below in this brief excerpt I took from the website. Those aren’t questions I would feel comfortable asking on a first date, but the General Social Survey asks them for a representative sample of Americans.
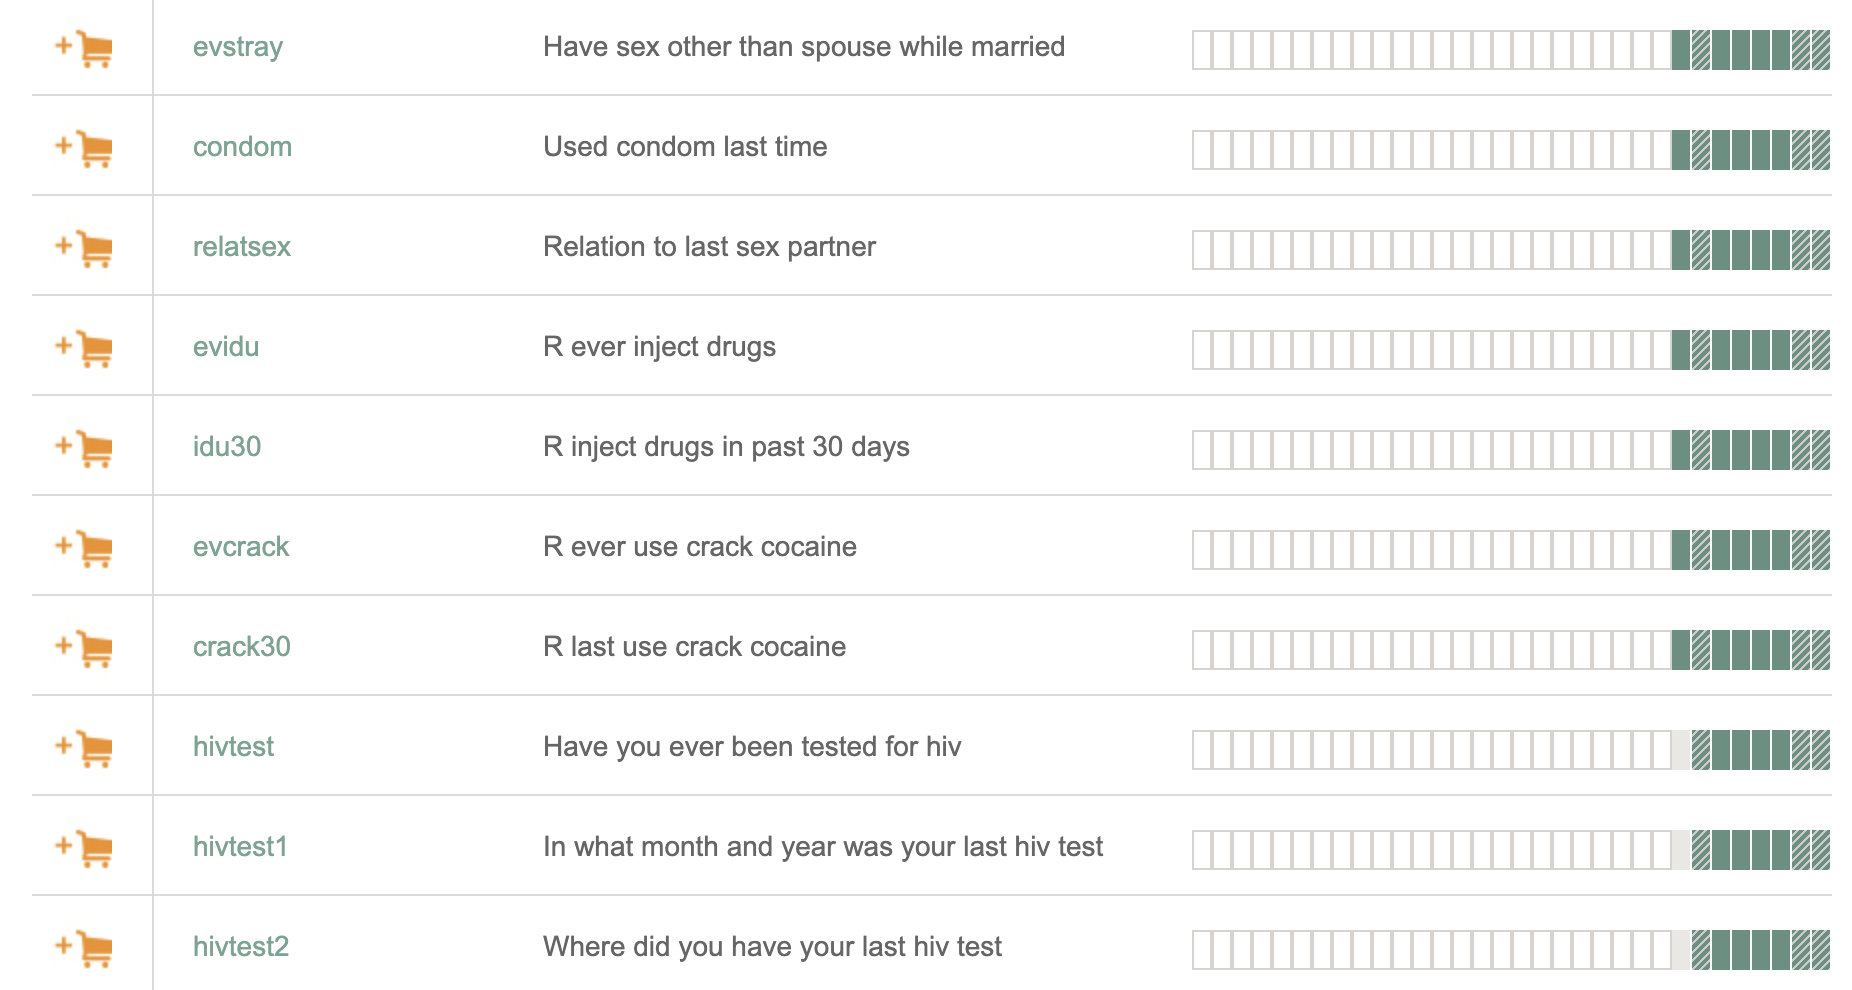
There are so many questions in the survey it can be seen as something of a “paper farm”. The research you do with this data probably isn’t going to be incredibly original or earth shattering, but it can get published.
Want to study whether people support spending more on space exploration? Use the General Social Survey.
Want to study what influences peoples views of immigrants? Use the General Social Survey.
Want to study changes in trust among Americans from 1972 to 2012? Use the General Social Survey.
There’s probably close to a paper written on every half-way interesting question in the survey. One way to develop something a bit more novel is to wait for some external change in society and see how that changes answers to the question. For instance, President Trump made space and Space Force a significant theme early in his term. Did that change who supported space exploration, particularly for evangelical Christians? Use the General Social Survey.
There are a set of questions on spending priorities that are typical targets of policy and political researchers, and these are asked every year. You could see how changes in the president impact partisan views on spending for highways and bridges, childcare, or education. I could imagine an interesting project tracking how responses to whether the county should spending more improving the conditions of Blacks has changed as a result of the Black Lives Movement once future iterations of the survey are published. There’s just a lot to be done using the data, if there’s a question that matches your interests.
As I said at the beginning, the GSS has data for individuals. Because it is a national survey, there aren’t enough observations to say anything about individuals at the state level. For instance, we can know from this data what share of individuals in the country think we should spend more on space exploration, but we wont know what share of people in Alabama feel that way. That’s a significant limitation on the data. You might want to study whether the amount of federal money that goes to a state influences how people view space exploration. To take on example, Texas is generally a conservative state that doesn’t like federal programs, but the fact there is a significant amount of space money going to Houston might change people’s opinions. But we can’t study that with the publicly available data, because we don’t know the respondent’s state. So really, the only unit of analysis available from the data is the individual, allowing us to compare one person to another. Luckily, other data allows us to utilize other units of analysis, but none will have the level of detail in personal questions that the GSS has.
3.3 Current Population Survey
Let’s start by comparing and contrasting the General Social Survey with another option for freely available data. Like the GSS, the Current Population Survey (CPS) is done for individuals. However, the CPS, sadly, asks far fewer questions and particularly fewer personal or opinion questions. We wont know from the CPS whether people have ever smoked marijuana or their views about immigrants or whether they think astrology is scientific. But, the good news is that for what the census does ask we can use it with many different units of analysis, allowing us to make estimates about everything from individuals to neighborhoods, cities, metropolitan statistical areas, states, and the nation.
The CPS is a monthly survey run by the Bureau of Labor Statistics that is primarily used to track the employment situation for the country, The survey provides the official estimates of the unemployed rate for the United States. However, the survey collected a lot more information, particularly as part of its “monthly supplements” where it asks some respondents more detailed questions about their living situation, voting, volunteering, or other questions.
The big benefit of the CPS is that we can make estimates at different units of observation using the data, but the largest drawback is a lack of detailed questions. That said, there’s still a lot of interesting work that can be done regarding individuals labor force participation, migration, civic engagement, and other questions.
3.4 American Community Survey/Census
The United States Census is conducted every 10 years, but the Census Bureau manages many other projects. In particular, the American Community Survey, which has partially replaced the traditional census, is conducted every year producing more timely information about the American population.
The necessity of the US Census is actually created by the Constitution, where Article I, Section 2 states: “Representatives and direct Taxes shall be apportioned among the several States… according to their respective Numbers… The actual Enumeration shall be made within three years after the first meeting of the Congress of the United States, and within every subsequent Term of ten Years”.[a][1] Section 2 of the 14th Amendment amended Article I, Section 2 to include that the “respective Numbers” of the “several States” will be determined by "counting the whole number of persons in each State, in part to clean up some racist issues with how the US Constitution determined who was a human being.
So the direct purpose of the US Census is to figure out how many people there are so that we can figure out how many representatives each state gets in Congress, etc. But the program has expanded over the years to encompass the collection of a great deal more information.
From the modern census we can get information on individuals education, income, family structure, migration, living conditions, and more. The actual Census that everyone fills out every 10 years only asks a small number of questions, but the Bureau has long used what’s called the “long form” to collect more in-depth information that might be of use to government departments, politicians and academics.
All of that data is collected and kept confidential, but we can still use the data with some limitations. The great news about using the Census is the size and completeness – in general it is representative of the entire United States. And for a given year, like 2019, you can get over 3 million responses; it would take a long time to get that many surveys if you were running a program. For point of reference, the GSS is generally given to 3,000 people each year its run (and has only had 61000 total responses since it began in 1972).
Census data is a great place to start on data collection, but it’s rarely a place to end. It’s the go-to source for information about community demographics. Want to know what counties diversified the most racially over the last decade, or whether suburban counties in your state are getting richer or poorer? The Census is the place to go. But often, the Census is more of a side dish than the main course on a research project.
It’s incredibly common to be used as one source of data in a study, but rarely will you be able to produce something that’s interesting and novel only using the Census. More often, you’ll need to connect it to another data source to generate a research question. Let me explain what I mean, by briefly describing a few research projects I’ve done.
I used census data to understand whether new state level laws regarding immigration were associated with immigrants moving away (if the law was restrictive) or staying in place (if the law was supportive). The census asks people whether they moved between states in the last year so it was a great source, but it was only useful because I could connect it to a database of state immigration laws form the Urban Institute.
Or, I did a study of the affect building a minor league baseball stadium had on nearby home prices using census data. But the census doesn’t record whether there is a minor league baseball stadium in the same neighborhood, I had to build that list first using Wikipedia, and then by connecting it to the census geographies. But the census was the perfect source to understand neighborhood home prices and demographics across the country.
We can get individual level data from the Census, with a significant caveat. The Integrated Public Use Microdata Series IPUMS lists each individual observation collected as part of the Census or American Community Survey. However, to project the confidentiality of individuals you wont be able to view that data with very many different geographies. The most common unit that data is reported for is something called the Public Use Microdata Area (PUMA). Pumas don’t match perfectly to cities or counties. They’re artificial boundaries that group together roughly 100,000 respondents. You can aggregate them upwards (imperfectly) to metropolitan areas or states, but you can’t use them for smaller units.
3.5 NHGIS
We’ll discuss one final main source of data in this chapter, the National Historical Geographic Information System (NHGIS). The NHGIS provides census data that has been aggregated to several different units of observation. It doesn’t provide individual data, but it does provide data at the level of neighborhoods, cities, counties, MSAs, states, and for the nation. That data is available from every instance of the US Census, so from 1790 to the present, though it should be noted that the boundaries for many of those geographies have changed over time, so everything won’t be directly comparable that far back. If you’re interested in the characteristics of neighborhoods or changes within cities, the NHGIS is a great resource.
Let me talk in a bit more depth about neighborhoods, since this is the only data discussed that is available at units smaller than cities. By neighborhoods, what I really mean is census tracts. Census tracts are sub-city units drawn up by the Census Bureau to approximate neighborhoods. They average 10,000 residents so individuals inside of them aren’t identifiable (confidentiality is important), but they’re drawn to respect borders on neighborhoods as much as possible.
What might that look like in New Orleans?
library(rgdal)
coords <- readOGR(dsn="~/Dropbox/Papers/Finished/NOLAbnb/Data/Neighborhood Area Boundary", layer="geo_export_8202dcf9-8da3-4097-a3c5-d33c5874489e")
## OGR data source with driver: ESRI Shapefile
## Source: "/Users/evanholm/Dropbox/Papers/Finished/NOLAbnb/Data/Neighborhood Area Boundary", layer: "geo_export_8202dcf9-8da3-4097-a3c5-d33c5874489e"
## with 72 features
## It has 4 fields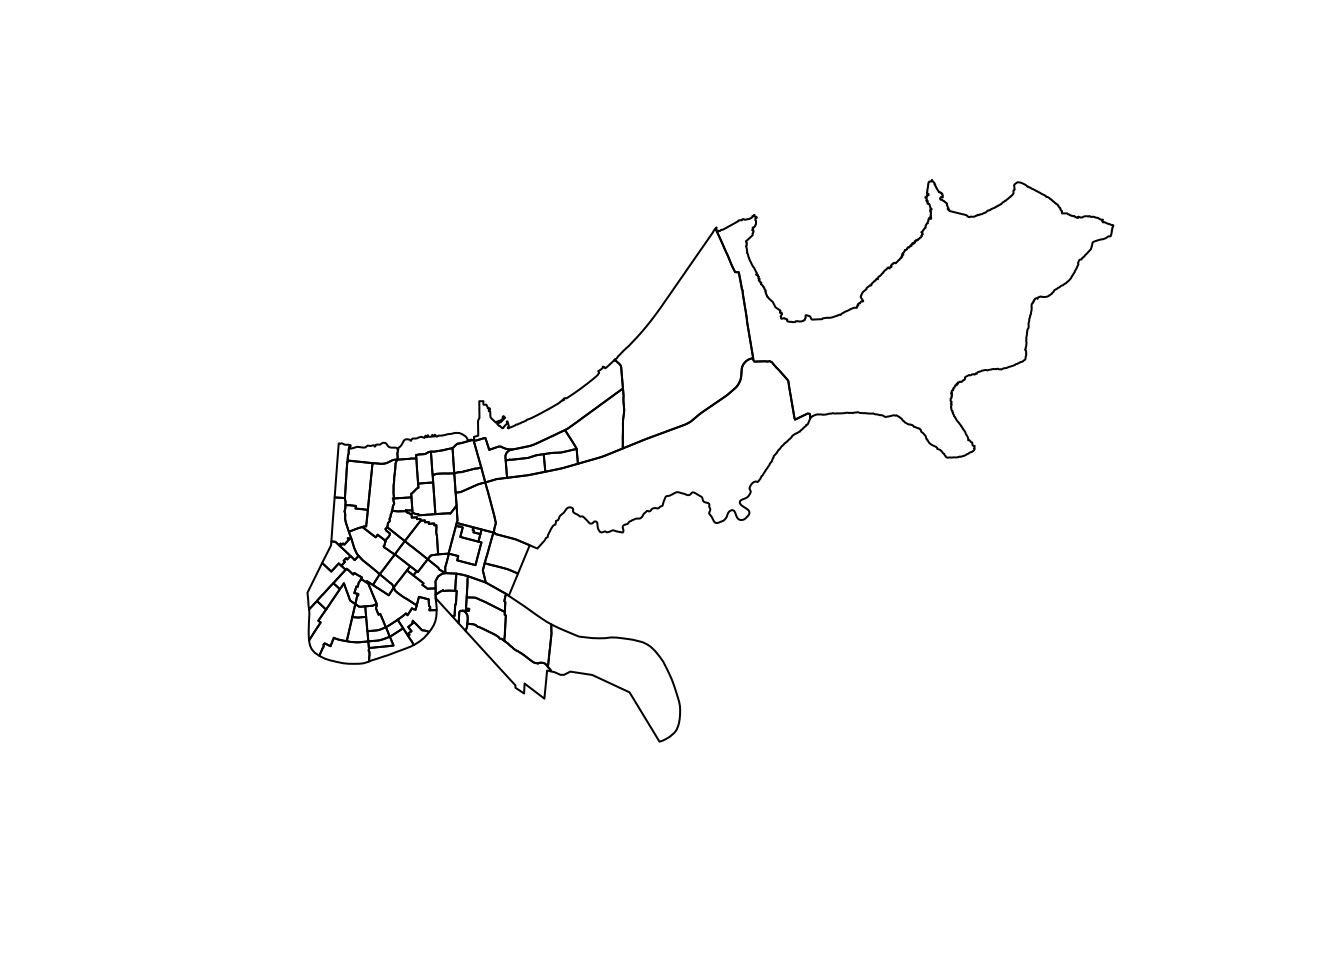
We’ll talk more about what I did above in a later section. Are those a perfect approximation of neighborhoods as people understand them in their lived experiences? Probably not perfectly, but it’s as close as we can get with the data that is available. If you’re interested in trends or changes happening within cities or states, the NHGIS is the best source to use at present.
I’ll introduce a few more narrow data sources below, but for now let’s summarize the 4 resources described above.
| Source | Units of Observation | Questions |
|---|---|---|
| GSS | Individual | Detailed and personal |
| CPS | Individual, Metro, State | Somewhat detailed, demographics |
| IPUMS USA | Individual, Metro, State | Demographics |
| NHGIS | Census Tract, Census Block, County, City, Metro, State | Demographics |
3.6 Too Many Other Sources
Those are a few common data sources, and they can be even more powerful when combined with all of the other data that is available online. Below I quickly list a few of my favorites. This list will hopefully grow with time.
Data directly from cities like New Orleans. You can find a similar website for most major cities.
Data about the locations of Airbnb’s in selected cities.
Data on evictions for different units of observations for the entire nation.
Data detailed data on elections.
Data on nonprofit locations.