1.1 Visualization
The first 5 rows of dat_recs can be visualized:
| y | x2 | x3 | x4 | x5 | x6 | x7 | x8 |
|---|---|---|---|---|---|---|---|
| 7.540 | 5 | 3 | 8 | 1 | 39 | 5 | 15 |
| 8.193 | 1 | 2 | 2 | 0 | 85 | 5 | 14 |
| 8.678 | 3 | 1 | 1 | 0 | 71 | 5 | 8 |
| 7.846 | 4 | 3 | 5 | 1 | 39 | 5 | 8 |
| 9.755 | 1 | 3 | 3 | 0 | 57 | 0 | 10 |
1.1.1 Box Plot
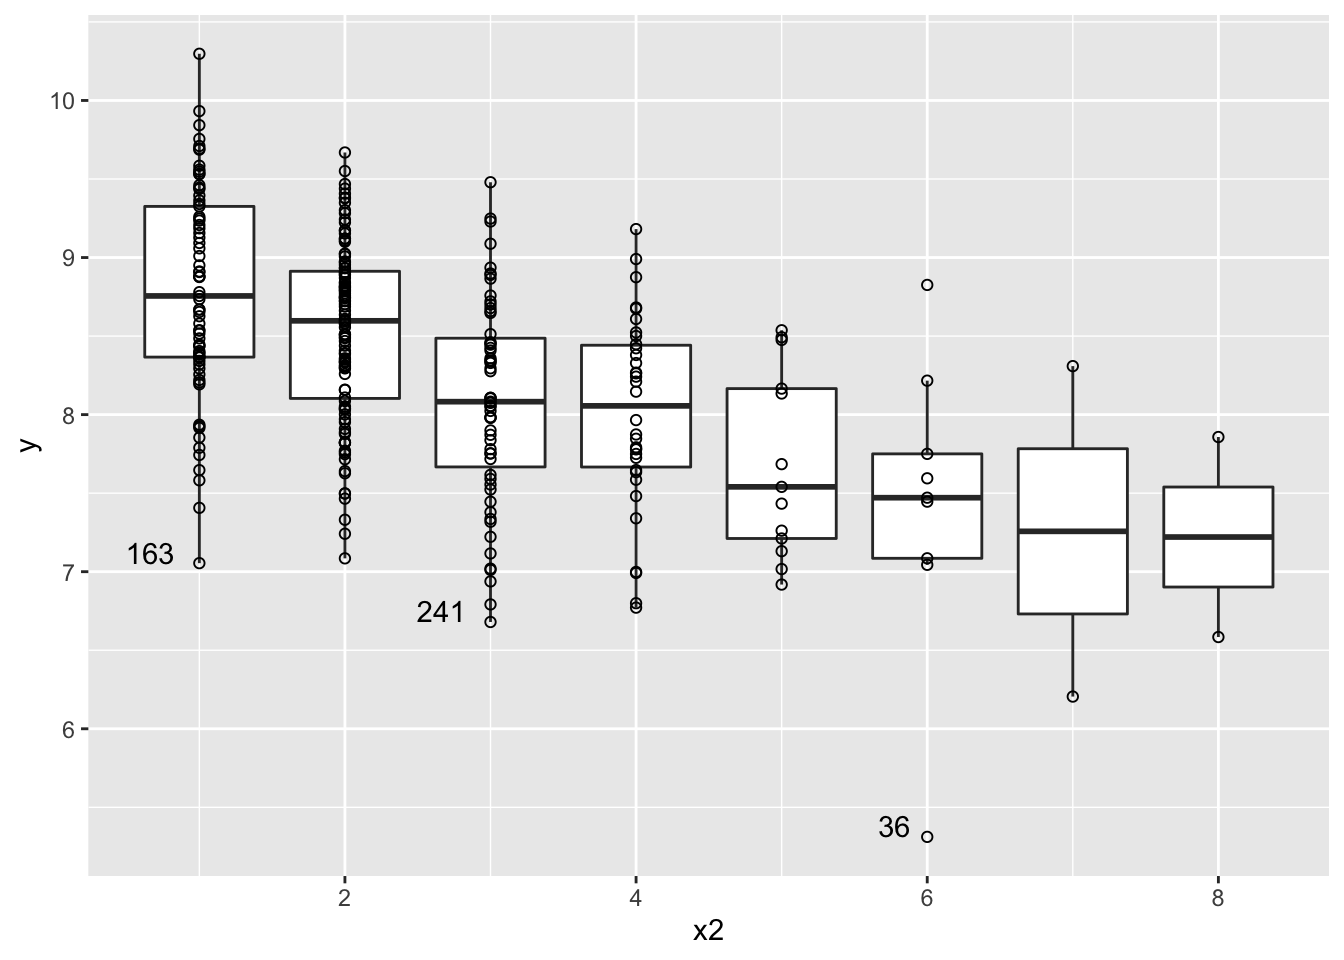
For each level of x2 a box indicating three quantiles (25%, 50%, 75%) of y is given. It shows that there is a tendency for y to decrease with x2 by looking at the median. The sizes of different boxes seem to vary with different values of x2. Besides, there are many observations when x2 is small. But it is assumed for now that the conditional variance is constant, which will be tested section 4. Three dat_recsa points with extreme values 36, 241 and 163 is discussed in sections 3 and 5.
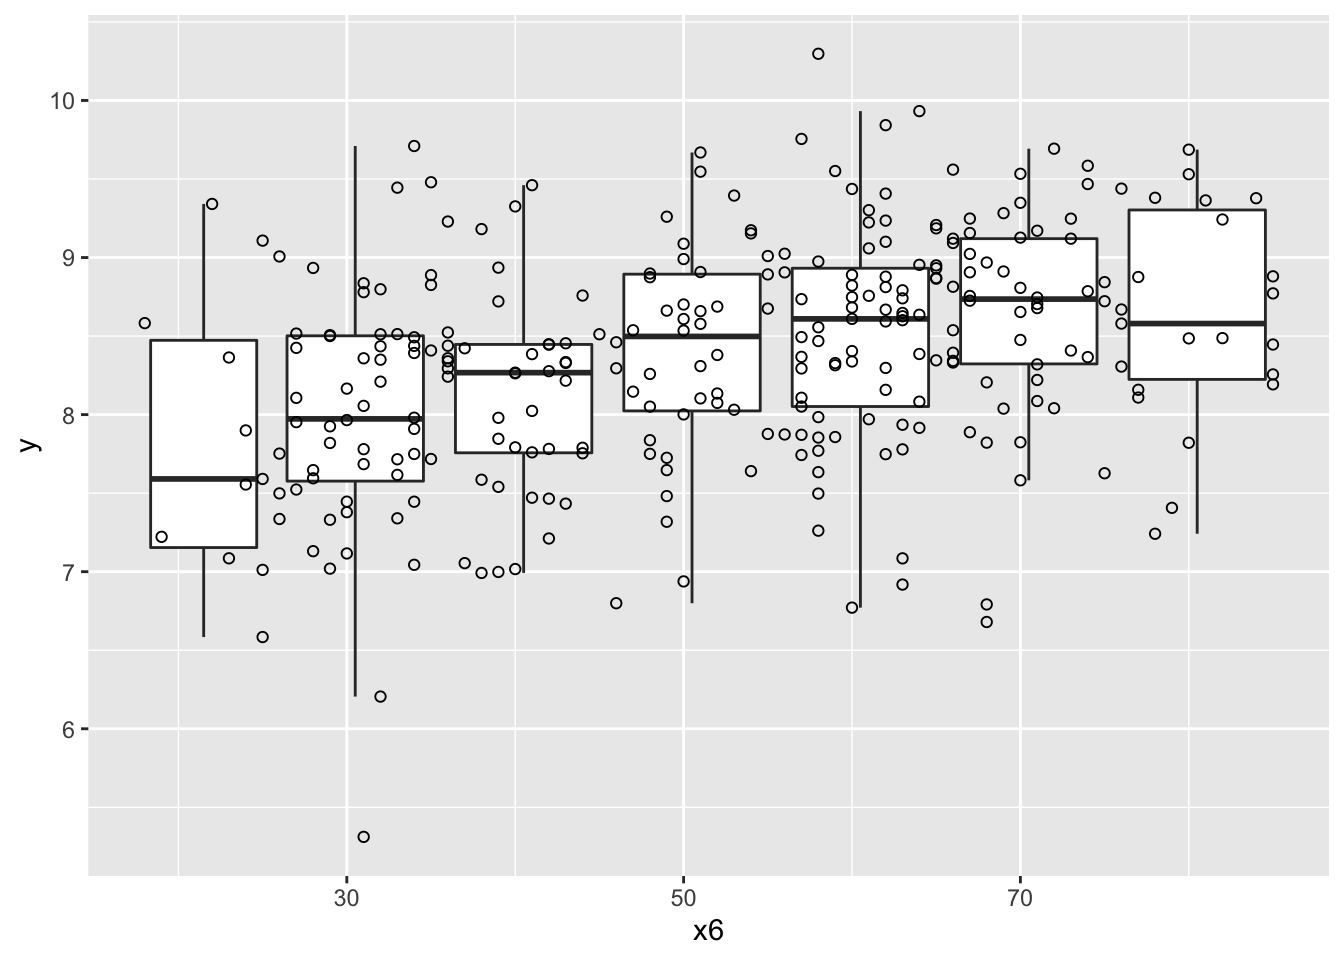
The box plot of y by x6 is given. It can be seen that the tendency is not strictly linear and the condition variance is not stable. So we will regress y on x2 first and use x6 as the second regressor in section 6.