1 Axioms of Probability Theory
1.1 Manipulation of Sets
Sets in R are represents as vectors.
For example, consider the following
Omega = 1:24
A = c(4, 5, 6, 16, 23, 24)
B = c(3, 5, 6, 7, 14, 17, 20, 23, 24)
The union of A and B
U = union(A, B)
sort(U)
[1] 3 4 5 6 7 14 16 17 20 23 24The intersection of A and B
U = intersect(A, B)
sort(U)
[1] 5 6 23 24The (set) difference of A minus B
U = setdiff(A, B)
sort(U)
[1] 4 16The (set) difference of B minus A
U = setdiff(B, A)
sort(U)
[1] 3 7 14 17 20The symmetric difference of A and B
U = union(setdiff(A, B), setdiff(B, A))
sort(U)
[1] 3 4 7 14 16 17 201.2 Venn and Euler diagrams
Venn diagrams are schematic visual representations of sets and their relationships. Euler diagrams are similar to Venn diagrams where only existing instersections are drawn.
require(eulerr)The sample space is, here, the set of integers between 1 and \(N\)
N = 100
Omega = 1:N
The following are the elements of Omega that are divisible by 2, 3, and 5, respectively
D2 = (Omega %% 2 == 0)
D3 = (Omega %% 3 == 0)
D5 = (Omega %% 5 == 0)

fit = euler(cbind(D2, D3, D5))

plot(fit, legend = TRUE, quantities = TRUE)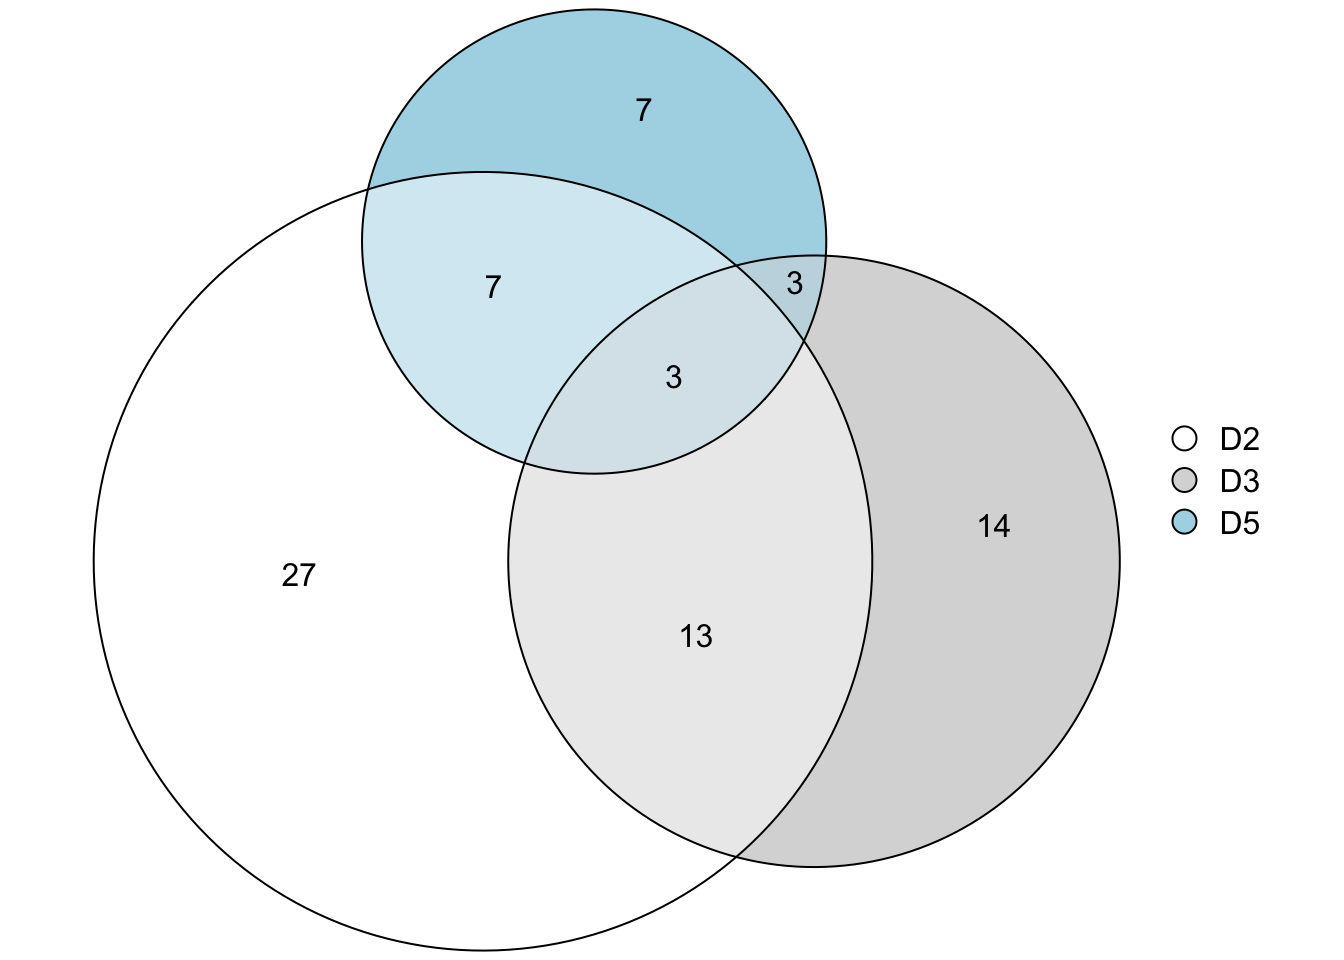
Note that the areas of the various sets and subsets (their intersection) are not in proportion to their size, but the size is indicated on the plot. Although it would be ideal if this were the case, it is not possible to draw such a diagram in general, at least not with discs. This is quantified as follows (see the package manual for details).
print(fit) original fitted residuals regionError
D2 27 27.057 -0.057 0.012
D3 14 14.094 -0.094 0.007
D5 7 7.193 -0.193 0.006
D2&D3 13 12.793 0.207 0.003
D2&D5 7 6.614 0.386 0.002
D3&D5 3 0.414 2.586 0.035
D2&D3&D5 3 3.567 -0.567 0.009
diagError: 0.035
stress: 0.006 However, we can use ellipses instead of discs to achieve a more faithful diagram. The package provides a way to do that.