3.8 Graphing Two Distributions
It is not simple to graph two distributions using R’s inbuilt plot() or hist() functions, but it requires only a small amendment to our ggplot code used earlier in the practical. We add fill = sex to the aes() function to say that ggplot should fill the bars according to gender, and add bins = 50 to the geom_histogram() function to increase the number of bins in the histogram.
#--- Plot birthweight by gender
bab9 %>% ggplot(aes(x = bweight, fill = sex)) + geom_histogram(bins = 50)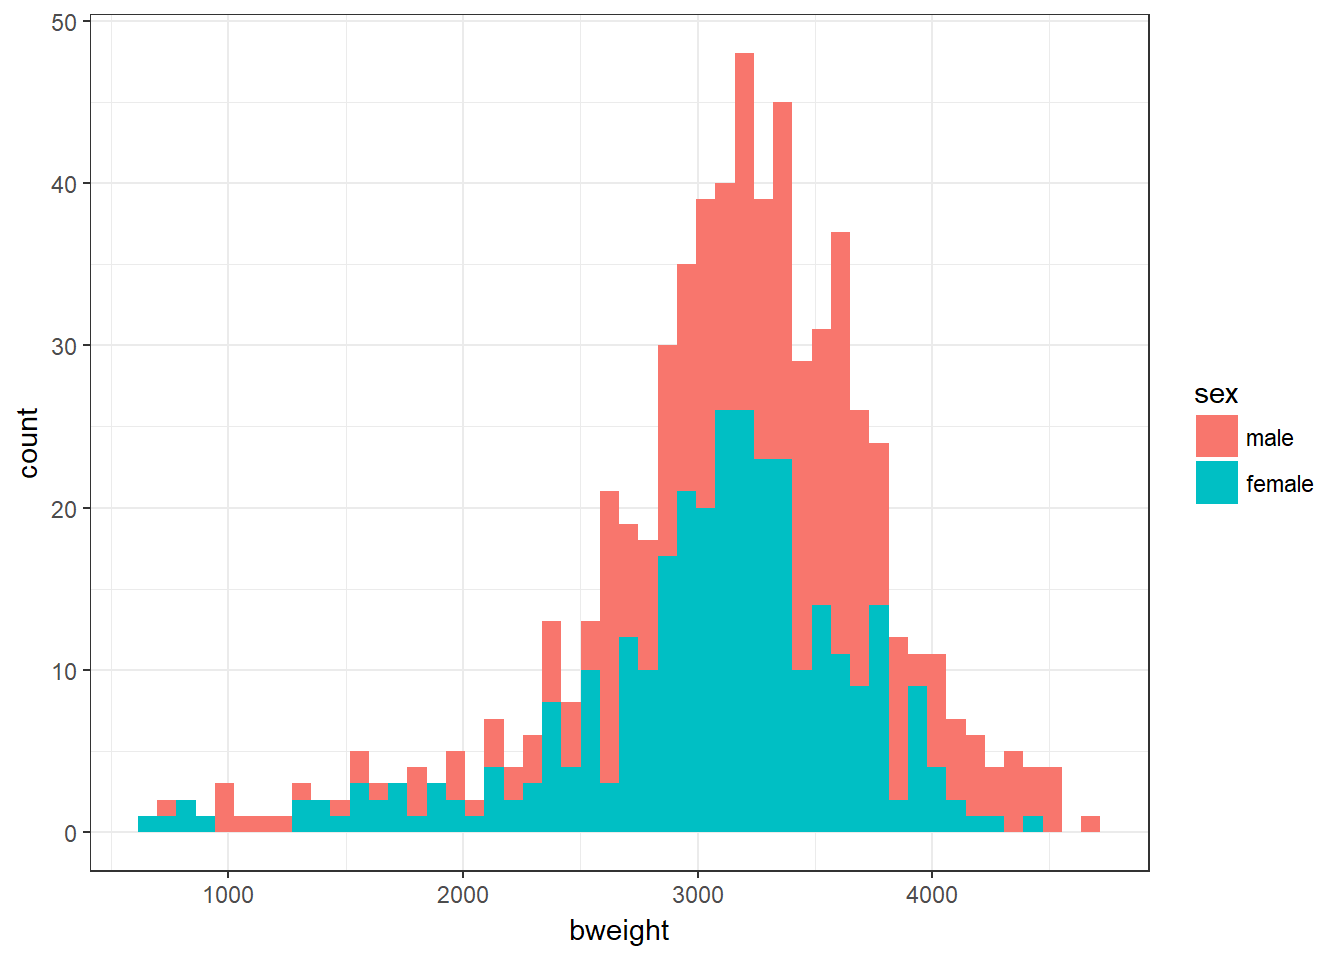
Exercise 9.2: Are the distributions roughly normal? Is the spread of values roughly similar in each group? Are the sample sizes still reasonably large?