Chapter 6 Non-probability sampling
Non-probability sampling includes all types of sample selection techniques where the probability of inclusion is not known in advance. Unlike the sampling designs presented so far, there is no control over the sample selection mechanism in non-probability sampling. Therefore, the usual approach to statistical inference in probability sampling, based on probability theory, cannot be used.
However, non-probability designs offer significant advantages, especially when results are needed quickly and at low cost. They are also justified by the lack of a sampling frame for probability sampling. When properly conducted by experienced staff, non-probability designs can produce results of acceptable quality.
Non-probability sampling is often used in business and finance, mainly because results are quickly needed and sampling frames are not available (especially for enterprises) or are difficult or too costly to access. For example, both the European Central Bank’s Survey on Access to Finance by Enterprises (SAFE) and Consumer Expectation Survey use quota sampling.
6.1 Quota sampling
Quota sampling consists of sampling units in such a way that a pre-defined list of population ‘quotas’ is met. For example, we may wish to have a 50/50 gender balance in the sample, as well as a certain balance across age groups and regions. The population ‘quotas’ used are usually taken from external population sources and are assumed to be reliable. A quota sample can therefore be seen as a kind of ‘snapshot’ of the population. In this sense, a quota sample is said to be ‘representative’ of the population.
Under quota sampling, the population mean \(\bar{Y}\) of a study variable \(y\) is estimated by:
\[ \hat{\bar{Y}}_Q = \displaystyle{\sum_{q=1}^Q \frac{N_q}{N} \bar{y}_q} \]
where:
- \(N_q\) is the size of the population in subgroup \(q\)
- \(N\) is the size of the whole population
- \(\bar{y}_q\) is the sample mean of variable \(y\) in subgroup \(q\): \(\bar{y}_q = \displaystyle{\frac{1}{n_q} \sum_{i \in s_q} y_{qi}}\)
We can rewrite the quota estimator as: \[\begin{equation*} \begin{array}{lll} \hat{\bar{Y}}_Q & = & \displaystyle{\sum_{q=1}^Q \frac{N_q}{N} \bar{y}_q} \\ & & \\ & = & \displaystyle{\sum_{q=1}^Q \frac{N_q}{N} \bar{Y}_q + \sum_{q=1}^Q \frac{N_q}{N} \bar{\epsilon}_q} \\ & = & \displaystyle{\bar{Y} + \sum_{q=1}^Q \frac{N_q}{N} \bar{\epsilon}_q} \end{array} \end{equation*}\]
where \(\bar{\epsilon}_q = \displaystyle{\frac{1}{n_q} \sum_{i \in s_q} \epsilon_{qi}}\) and \(\epsilon_{qi}=y_{qi}-\bar{Y}_q\)
Thus, the bias of the quota estimator is given by: \[\begin{equation*} \begin{array}{lll} B\left(\bar{Y}_Q\right) & = & E\left(\displaystyle{\sum_{q=1}^Q \frac{N_q}{N} \bar{\epsilon}_q}\right) \\ & & \\ & = & \displaystyle{\sum_{q=1}^Q \frac{N_q}{N}\frac{1}{n_q} \sum_{i \in U_q} P_{q,i} \left(y_{qi}-\bar{Y}_q\right)} \\ & & \\ & = & \displaystyle{\frac{N}{n}\sum_{q=1}^Q \frac{N_q}{N} Cov_q\left(y,P\right)} \end{array} \end{equation*}\]
This formula shows the quota estimator is biased when there is correlation between the inclusion probabilities \(P\) and the study variable \(y\). The quota estimator is unbiased when:
- The study variable \(y\) is constant within the subgroups
- The inclusion probability \(P\) is constant within the subgroups
The first point means that quota sampling is unbiased if the auxiliary characteristics used to define the quota are correlated with the study variables. However, as such a condition is never met in practice, the second point means that the sample units within each group must also be ‘random’ in order to avoid bias. The latter is also difficult to achieve and requires experienced staff to limit selection bias, i.e. bias introduced by human selection of individuals within each quota group.
With regard to variance estimation, two main approaches are possible:
- Design-based: we approximate quota sampling by stratified simple random sampling with proportional allocation across the groups
- Model-based: we assume the values \(y_{qi}\) of the study variable \(y\) in subgroup \(q\) are i.i.d outcomes from a random variable of mean \(\alpha_q\) and variance \(\sigma_q^2\)
Under the model-based approach, we have:
\[ V\left(\hat{\bar{Y}}_Q\right) = \displaystyle{\frac{1-f}{n} \sum_{q=1}^Q \frac{N_q}{N} \sigma_q^2} \]
This formula is interesting in the sense it shows that quota sampling can be regarded as stratified sampling with proportional allocation among the quota groups. This assumption holds if we assume quota selection were done properly that is, in a “random” way as if a computer were used.
Simulation exercises showed quota sampling may perform as well as probabilistic sampling when the sample size is low. Indeed, probabilistic sampling is known to be unbiased and the variance is inversely proportional to the size \(n\) of the sample. When \(n\) is low, the variance of any probabilistic sampling is not good, while quota sampling may happen to perform better provided it is carried out properly.
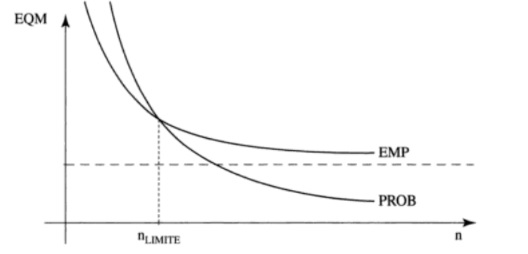
Figure 6.1: Mean Square Error - Comparison between probability/nonprobability sampling (Ardilly, 2006)
6.2 Other examples
As well as quota sampling, there are many other examples of non-probability sampling. Volunteer sampling, for example, is extremely cheap and provides results very quickly. On the other hand, its statistical properties are far from good because of the importance of self-selection bias, caused by the correlation between the probability of inclusion and the variable under study, and the risk that some segments of the population will not be covered by the survey (coverage bias). Voluntary sampling is therefore not recommended for important economic studies and should be limited to very small surveys (e.g. to test certain questions for a larger survey).
Snowball (or Network) sampling is another example of a non-probability design, which is quite relevant for targeting rare sub-populations (e.g. populations with certain diseases or languages). The idea is that each selected unit recommends other units to be contacted, and so on. In this way, the sample grows like a snowball.
Today, non-probability designs are widely used not only by commercial companies, whose aim is to produce statistics cheaply and at low cost, but also by official organisations such as central banks, which have been conducting important surveys to help them better assess and understand the impact of monetary policy. For example, the European Central Bank’s Consumer Expectations Survey11 collects high-frequency information on the perceptions and expectations of euro area consumers regarding the economy and their economic and financial behaviour. The CES sample selection uses a dual frame design, combining random digit dialing of telephone numbers with a non-probability selection of individuals from an access panel.
Access panels contain information on a very large number of people or companies who register and agree to take part in a fixed number of surveys each year12. These surveys are usually conducted online, although in rare cases they may be conducted by telephone. Access panels are now increasingly used as sampling frames for household and enterprise surveys, although they also suffer from potential coverage errors due to the omission of certain parts of the population from the list.