Chapter 3 Data visualisation
Author: Ron
library(tidyverse)
library(nycflights13)
3.1 3.2 First steps
3.2.4 Exercises
- Make a scatter plot of hwy vs cyl.
ggplot(data = mpg, mapping = aes(x= hwy, y=cyl))+
  geom_point()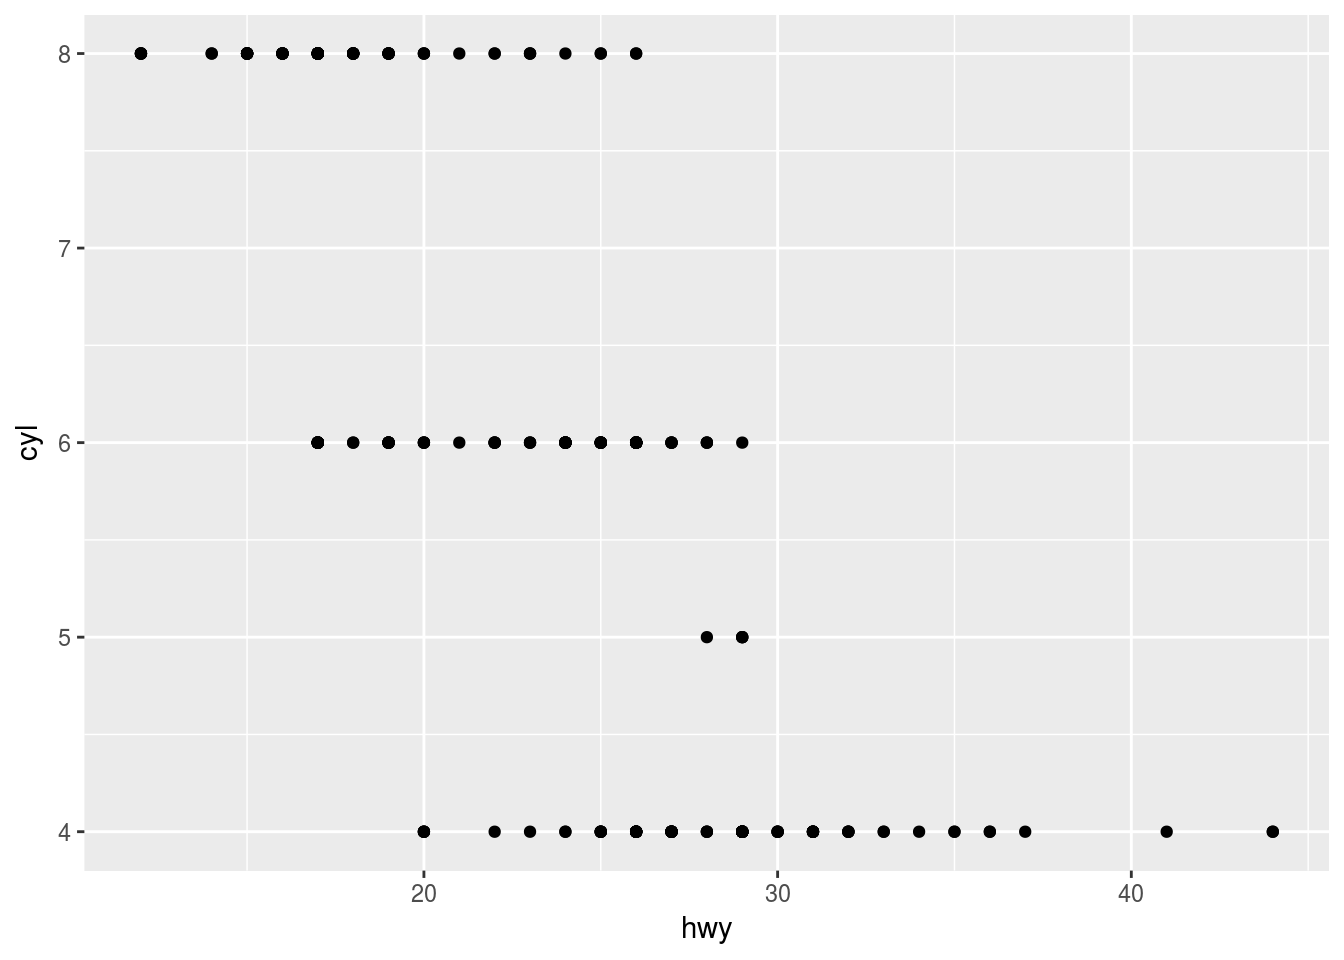
3.6 Geometric objects
3.6.1 Exercises
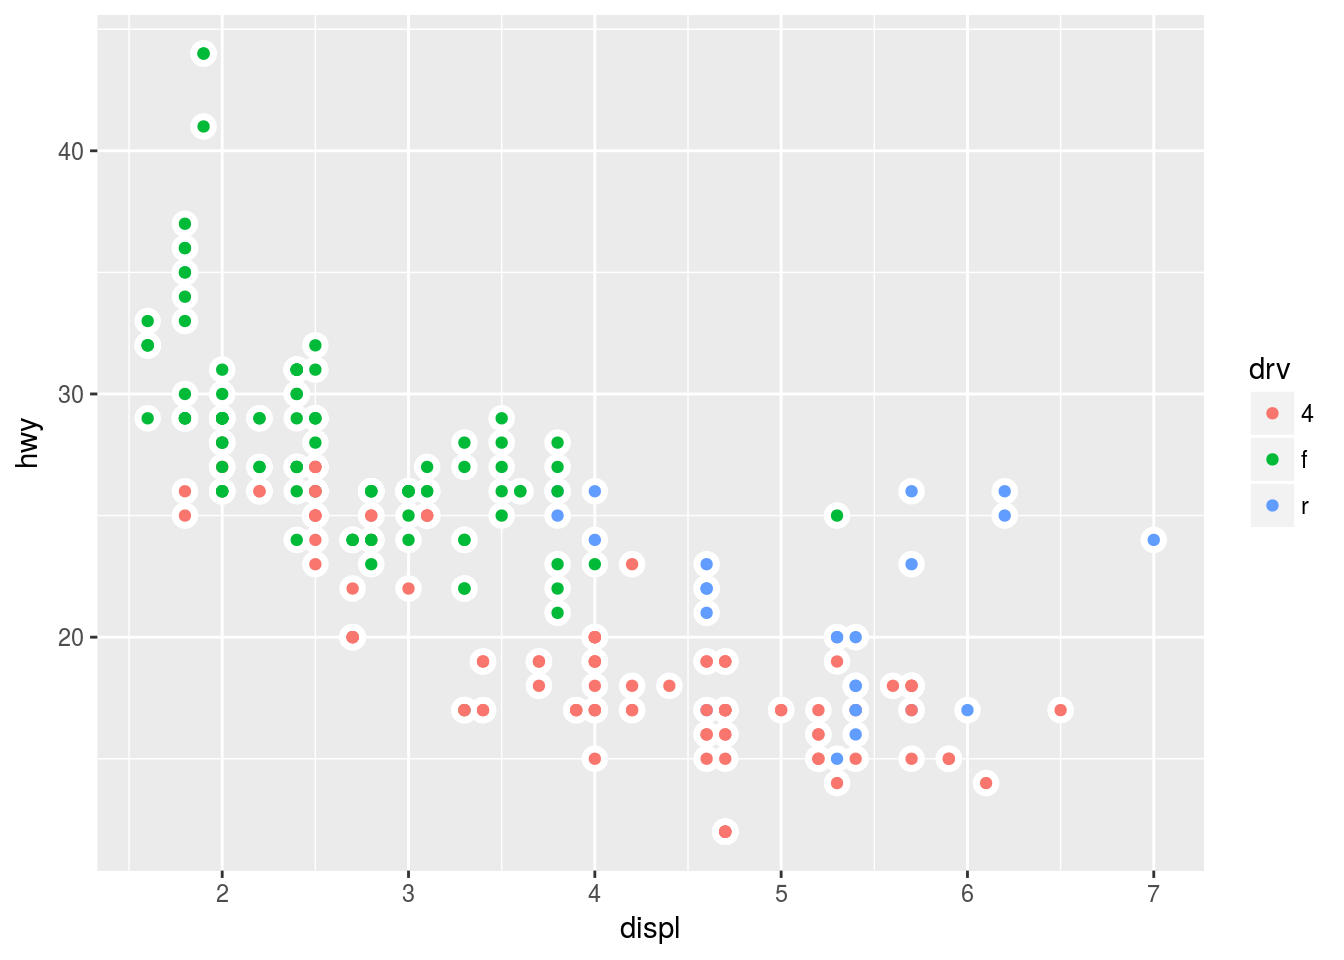
- Recreate the R code necessary to generate the following graphs.
ggplot(data = mpg, aes(x = displ, y = hwy)) +
  geom_point(color = "white", size = 4) +
  geom_point(aes(color = drv))