第 2 章 学科结构与发展
2.1 PROS
关于文献计量的数据库很多,比如PROS,Arxiv等等,对PROS和Arxiv数据集的分析,另外单独介绍。
2.2 Web of Science
我们选择Web of Science,原因是因为当前ESI学科是各高校关注的热点,而Web of Science数据库是ESI的上游数据库,挖掘的空间更大。

图 2.1: ESI与Web of Science的关系图.
Web of Science数据库的题录数据结构如下表:
2.3 数据集的构建
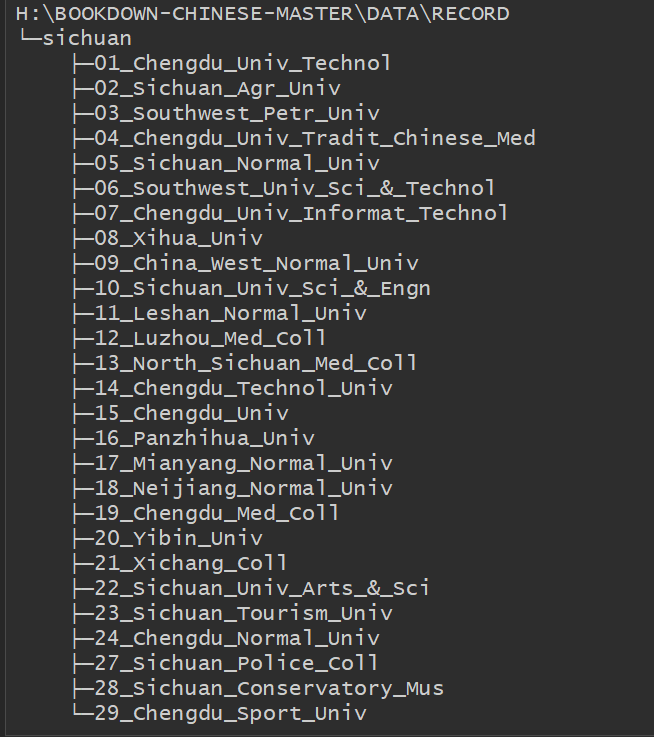
由于wos网站限制每次只能下载500条记录,因此每个学校的题录文件(一个文件夹)存放不止一个txt文件。具体文件结构如下:

除了题录数据,还包括辅助的数据集
| 编号 | 名称 | 简介 | 变量数量 | 共有变量 |
|---|---|---|---|---|
| 1 | web of science | wos题录 | 13 | University,ISSN |
| 2 | sichuan_shool_encn2.csv | 四川高校的名称 | 2 | University |
| 3 | esi_plus_cas_IF_set.rds | esi期刊学科分类 | 11 | ISSN |
| 中科院学科分类 | ||||
| 是否中国SCI期刊 | ||||
| 期刊影响因子等 | ||||
接下来,我们来读取规整文件
# Load Packages
library(tidyverse)
library(here)
library(fs)
library(knitr)
library(kableExtra)构建读取相应文件的子函数
read_plus <- function(flnm) {
read_tsv(flnm, quote = "", col_names = TRUE) %>%
#or
#read_delim(flnm, delim="\t" , quote = "", col_names = TRUE) %>%
select(AU, AF, SO, DE, C1, RP, FU, CR, TC, SN, PY, UT) %>%
mutate(University = flnm %>% # 加入了学校名
str_split("/", simplify = TRUE) %>%
.[, length(.) - 1] %>% # 倒数第二列
str_sub(start = 4)
)
}"G:/Guide_DS_R/63R4IS/data/Record/sichuan/01_Chengdu_Univ_Technol/1-500.txt" %>%
str_split("/", simplify = F) %>%
map_chr(.,
~.x[length(.x) - 1]
)## [1] "01_Chengdu_Univ_Technol"依次迭代读取
tbl <- here("data", "Record", "sichuan") %>%
dir_ls(regexp = "*.txt", recursive = TRUE) %>%
map_dfr(~read_plus(.))
tbl测试下呢
tbl %>% count(University)读取四川高校的名称
sichuan_univ_name <- read_csv(here("data", "map_list", "sichuan_shool_encn2.csv") )
sichuan_univ_name合并到tbl, 形成 sichuan_set
sichuan_set <- tbl %>%
left_join(sichuan_univ_name, by = "University")这里是esi期刊列表数据集, esi_plus_cas_set = esiJCR + CAS + chineseJCR (即,每个期刊的esi学科分类,中科院学科分类,是否是中国JCR期刊),目的是方便今后分析
esi_plus_cas_IF_set <- read_rds(here("data", "esiJournalsList", "esi_plus_cas_IF_set.rds"))将 esi_plus_cas_IF_set 合并到 sichuan_set, 形成 complete_set
complete_set <- left_join(sichuan_set, esi_plus_cas_IF_set, by = c("SN" = "ISSN") ) %>%
select(University, University_cn, everything()) %>%
rename(ISSN = SN) %>%
mutate(SO = str_to_title(SO))2.4 数据集的导入
最终,我们围绕四川省各高校,选择Web of Science数据库中的10个维度(上图中红色圈出的部分),然后映射并融合了ESI学科分类、中科院期刊分类、期刊等级以及影响因子等,构建了包含24个维度的完整数据集。
#complete_set <- read_rds("data/dataset/complete_set.rds")
glimpse(complete_set)## Rows: 19,341
## Columns: 24
## $ University <chr> "Chengdu_Univ_Technol", "Chen~
## $ University_cn <chr> "成都理工大学", "成都理工大学~
## $ AU <chr> "Duan, YP; Shang, RS; Zhong, ~
## $ AF <chr> "Duan, Yiping; Shang, Ruishu;~
## $ SO <chr> "International Journal Of Hyd~
## $ DE <chr> "Dry reforming of methane; Hy~
## $ C1 <chr> "[Duan, Yiping; Shang, Ruishu~
## $ RP <chr> "Huang, LH (reprint author), ~
## $ FU <chr> "National Natural Science Fou~
## $ CR <lgl> NA, NA, NA, NA, NA, NA, NA, N~
## $ TC <dbl> 0, 0, 0, 0, 0, 0, 0, 1, 0, 0,~
## $ ISSN <chr> "0360-3199", "1367-9120", "09~
## $ PY <dbl> 2016, 2016, 2016, 2016, 2016,~
## $ UT <chr> "WOS:000389786500012", "WOS:0~
## $ Full_title <chr> "INTERNATIONAL JOURNAL OF HYD~
## $ Category_ESI <chr> "ENGINEERING", "GEOSCIENCES",~
## $ Category_ESI_cn <chr> "工程学", "地球科学", "计算机~
## $ Category_CAS <chr> "工程技术", "地学", "工程技术~
## $ Degree_CAS <int> 2, 3, 2, 4, 4, 4, 3, 3, 3, 4,~
## $ Title <chr> NA, NA, NA, NA, NA, NA, "石油~
## $ is_chinese <dbl> 0, 0, 0, 0, 0, 0, 1, 1, 1, 1,~
## $ Cites <dbl> 75123, 12551, 22735, 696, 890~
## $ ImpactFactor <dbl> 4.229, 2.866, 3.241, 0.314, 2~
## $ Eigenfactor <dbl> 0.08137, 0.02432, 0.04892, 0.~2.5 各高校对比
建立数据集有很大的好处,比如我们可以很方便的对比四川各高校的科研情况
complete_set %>% count(University_cn) %>% arrange(desc(n))被引情况呢
complete_set %>% count(University_cn, wt = TC) %>% arrange(desc(n))从未被引用的数量和占比(太讨厌了吧)
complete_set %>% group_by(University_cn) %>%
summarise(num = n(),
not_cited = sum(TC == 0),
prop = not_cited/num) %>%
arrange(desc(prop))2.6 分析单个学校
看看我们川师的情况吧
sicnu_set <- complete_set %>% filter(University == "Sichuan_Normal_Univ")
sicnu_set %>% summarise(count = n()) sicnu_set %>%
filter(str_detect(C1, "Sichuan Normal Univ,\\s+([^,]*),")) %>%
summarise(count = n()) 为什么少了2各呢?大家想想吧
2.7 第一作者筛查
sicnu_set %>%
filter(str_detect(C1, "^\\[([^]]+)\\]\\s+Sichuan Normal Univ,\\s+([^,]*),")) %>%
summarise(count = n()) 2.8 通讯作者筛查
sicnu_set %>%
filter(str_detect(RP, "Sichuan Normal Univ")) %>%
summarise(count = n()) 2.9 可视化之小试牛刀
川师逐年论文发表情况
sicnu_set %>% ggplot() +
geom_bar(aes(x = PY))
2.10 可视化之初显身手
some_univ <- c("四川师范大学", "成都理工大学", "西南科技大学",
"成信大", "西南石油大学", "四川农业大学",
"四川理工学院", "西华师范大学","西华大学")
some_cate <- c("物理学", "化学", "数学", "工程学", "计算机科学", "材料科学")library(showtext)
showtext_auto()
complete_set %>%
group_by(University_cn, Category_ESI_cn, PY) %>%
summarise(sumpaper = n()) %>%
filter(University_cn %in% some_univ,
Category_ESI_cn %in% some_cate,
PY >= 2010
) %>%
ggplot(aes(x = PY, y = sumpaper, group = University_cn, colour = factor(University_cn)) ) +
geom_point() +
geom_line() +
facet_wrap(vars(Category_ESI_cn), scales = "free") +
labs(x = NULL, y = NULL, colour = "") +
ggtitle("我省部分省属高校近几年各学科论文情况", subtitle = '(数据来源 Web of Science)') +
guides(fill = guide_legend( nrow = 1, byrow = TRUE)) +
theme(
#plot.title = element_text(size = 16),
#plot.subtitle=element_text(size=14, hjust=0.01, face="italic"),
legend.box = "horizontal",
legend.position = "bottom",
legend.direction = "horizontal"#,
#text=element_text(size=14)
)
complete_set %>%
filter(!is.na(Category_ESI_cn)) %>%
group_by(University_cn, Category_ESI_cn) %>%
summarise(sumpaper = n()) %>%
filter(University_cn %in% some_univ) %>%
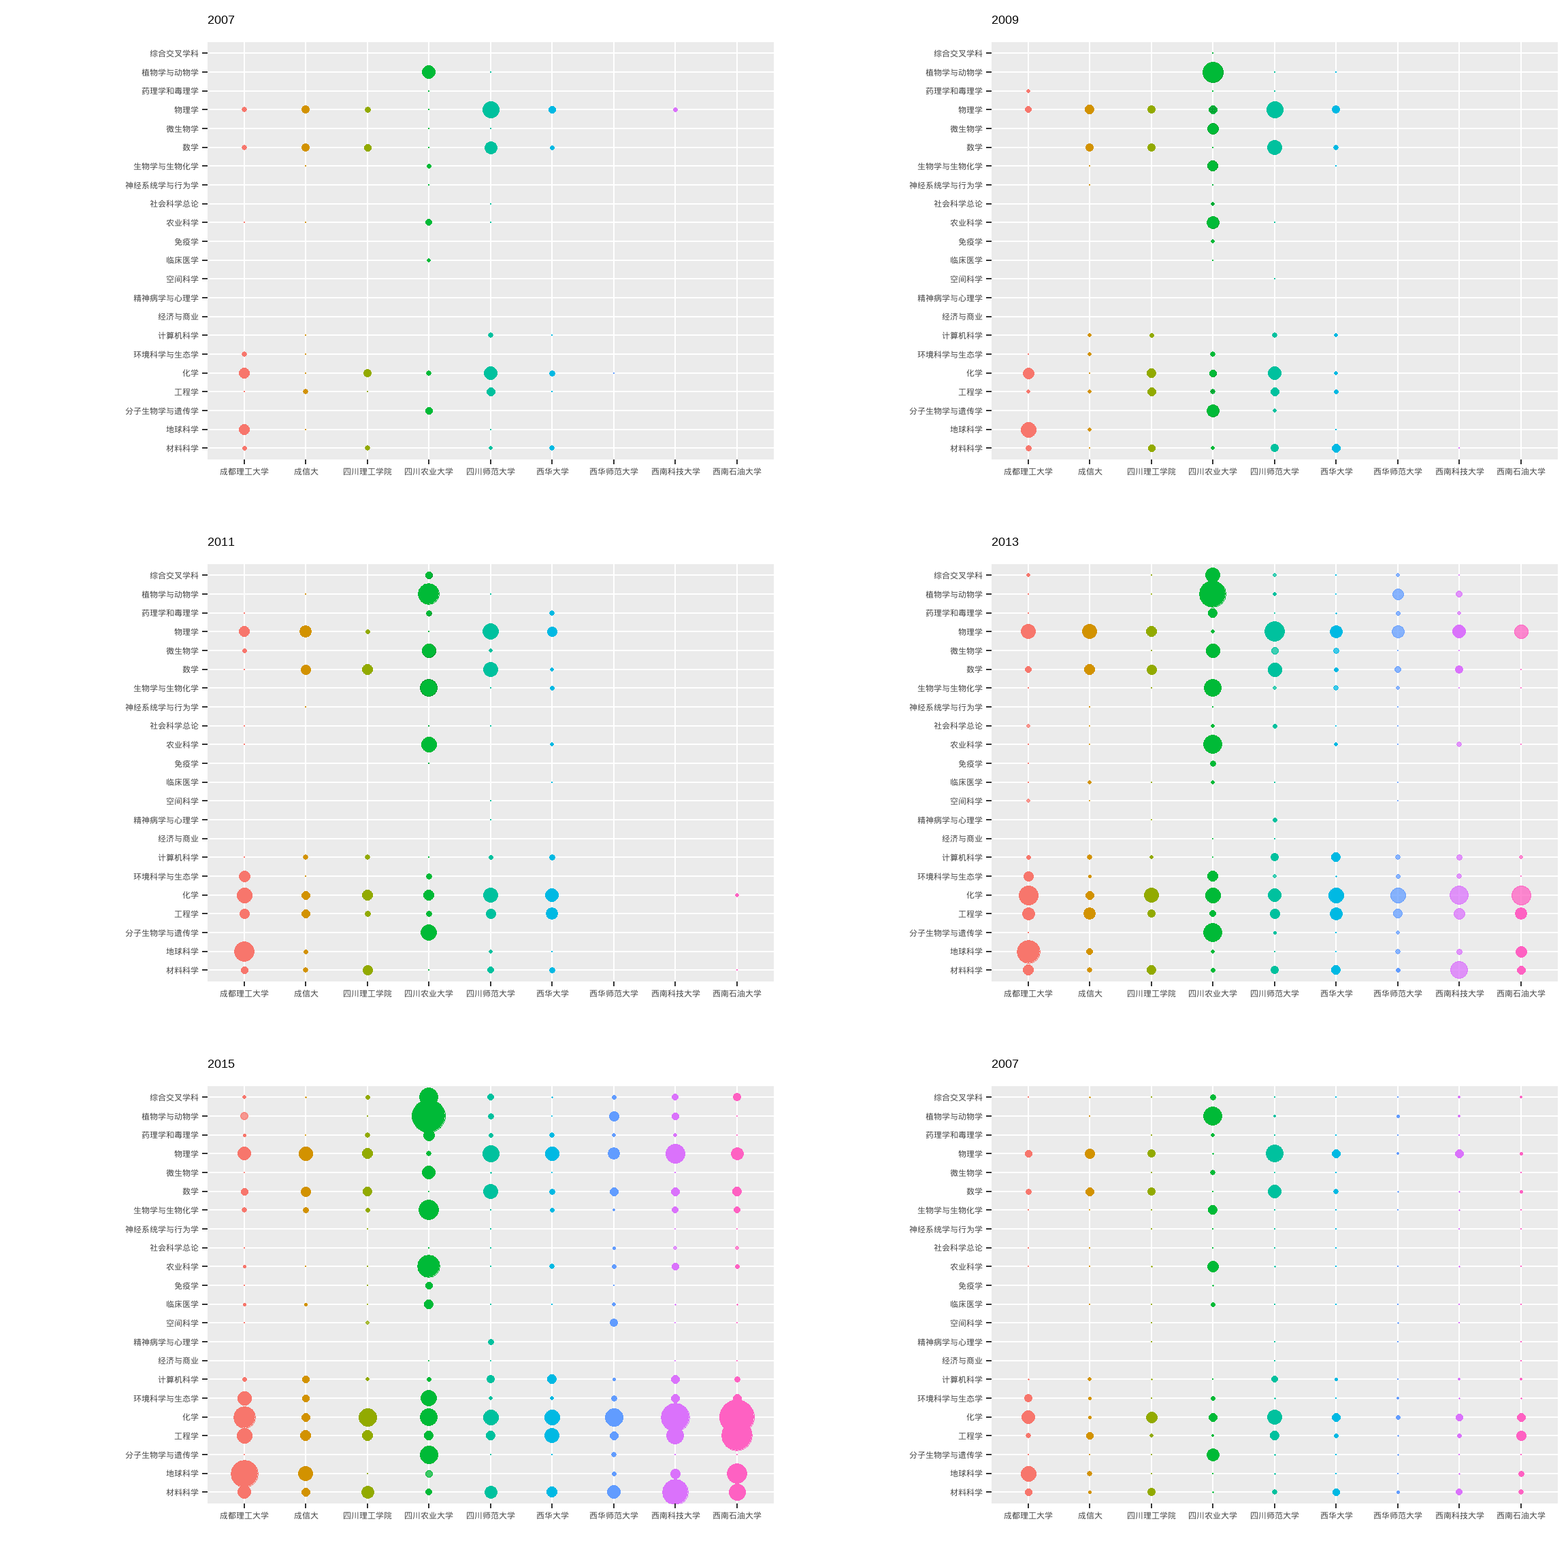
ggplot(aes(x = University_cn, y = Category_ESI_cn, colour = University_cn, fill = University_cn, size = sumpaper)) +
geom_point(shape = 21 ) +
scale_size(range = c(0,20)) +
xlab("") + ylab("") +
ggtitle("我省部分省属高校近几年各学科论文情况", subtitle = '(数据来源 Web of Science)') +
theme(legend.position = "none")
2.11 可视化之渐入佳境
library(scales)
library(ggiraph)
library(ggiraphExtra)
df_radar <- complete_set %>%
filter(!is.na(Category_ESI_cn)) %>%
count(University_cn, Category_ESI_cn) %>%
spread(Category_ESI_cn, n, fill = 0) %>%
mutate_at(vars(-University_cn), funs(rescale)) %>%
filter(University_cn %in% some_univ)
ggRadar(data = df_radar,
mapping = aes(colour = University_cn),
size = 2,
legend.position = "none",
rescale = TRUE) +
facet_wrap(vars(University_cn) )
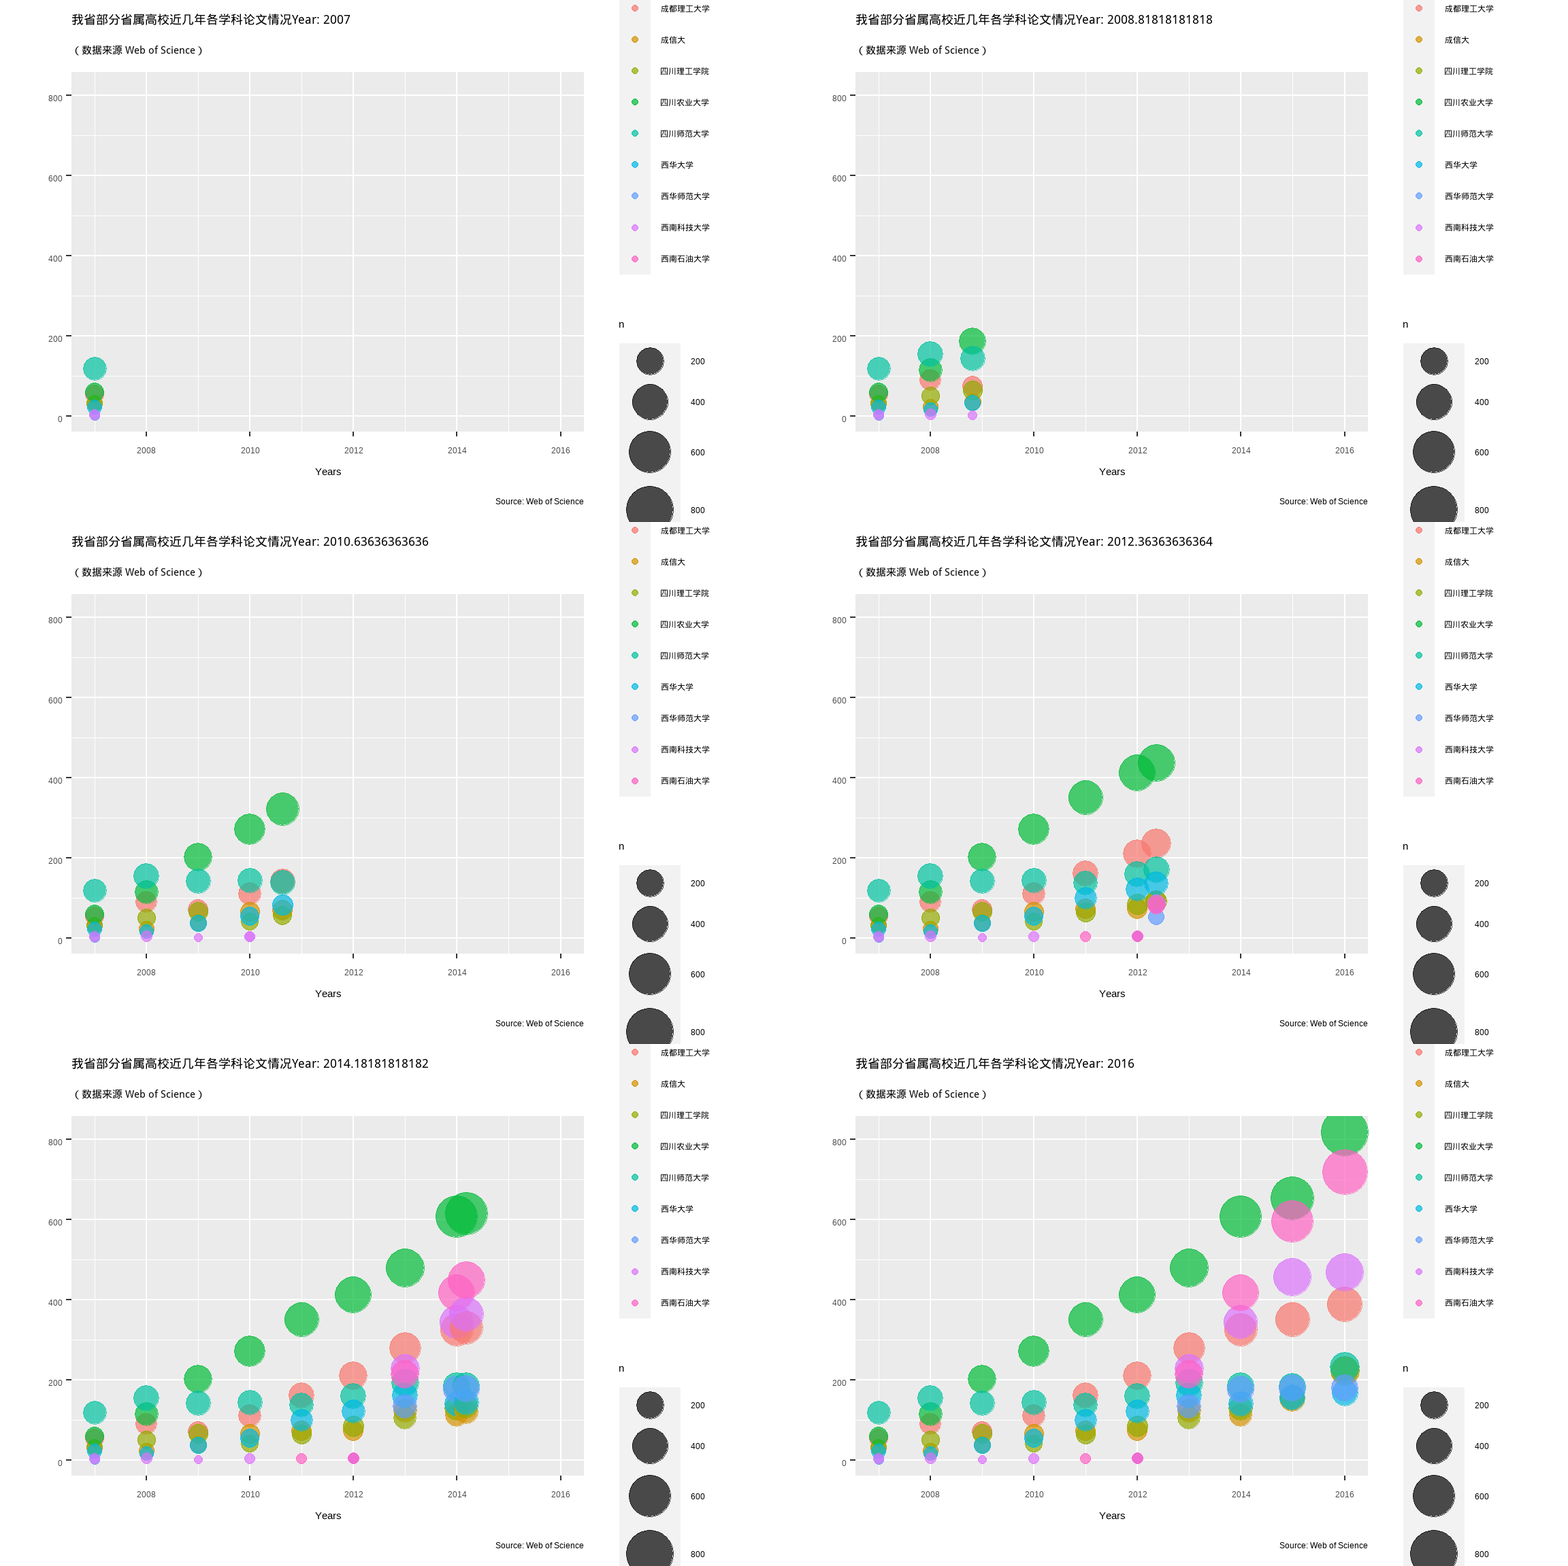
来点动画吧,(gganimate升级后,该代码无法工作)

现在我们可以使用新的 gganimate宏包了
library(gganimate)
ttb <- complete_set %>%
filter(University_cn %in% some_univ, !is.na(Category_ESI_cn)) %>%
count(University_cn, PY, Category_ESI_cn) #%>%看看这个动画
ttb %>%
ggplot(aes(x = University_cn, y = Category_ESI_cn, colour = University_cn, fill = University_cn, size = n)) +
geom_point(shape = 21 ) +
scale_size(range = c(0,10)) +
# Here comes the gganimate code
labs(title = "{closest_state}") +
transition_states(PY, state_length = 2, transition_length = 1) +
enter_fade() +
exit_shrink() +
ease_aes('linear') +
xlab("") + ylab("") +
theme(legend.position = "none")
又来一个
tsb <- complete_set %>%
count(University_cn, PY) %>%
filter(University_cn %in% some_univ)
tsb %>%
ggplot(aes(PY, n, size = n, colour = University_cn)) +
#geom_point(alpha = 0.7, show.legend = FALSE) +
geom_point(alpha = 0.7, show.legend = TRUE) +
scale_size(range = c(2, 12)) +
# Here comes the gganimate specific bits
labs(title = "我省部分省属高校近几年各学科论文情况Year: {frame_time}",
subtitle = '(数据来源 Web of Science)',
y = "", x = "Years",
caption = "Source: Web of Science",
colour = "学校") +
transition_time(PY) +
shadow_mark(past = TRUE) + #equivalent to cumulative= TRUE in the old package
ease_aes('linear')
再来一个
library(RColorBrewer)
library("viridis")
mycols <- brewer.pal(9,"Oranges")[2:8]
theme_set(theme_bw())
shapenumber %>%
filter(!is.na(Category_CAS)) %>%
ggplot(aes(y = Category_CAS, x = Degree_CAS, fill = value)) +
geom_tile(color = "white") +
scale_fill_gradientn(colours = mycols) +
geom_text( aes(label = round(value,2)),
size = 6
) +
labs(x = NULL, y = NULL) +
ggtitle("四川师范大学近几年各学科论文发表情况", subtitle = '(数据来源 Web of Science)') +
guides(fill = guide_legend(
title = "数量"
#reverse = TRUE
)
) +
theme(
plot.title = element_text(size = 18),
plot.subtitle = element_text(size = 14, hjust = 0.01, face = "italic"),
legend.title = element_text(size = 14),
legend.position = "top",
legend.justification = c(1,0),
legend.margin = margin(0, 0, 0, 0),
axis.text.x = element_text(margin = margin(0.4, unit = "cm")),
text = element_text(family = "fzxbsj",size = 20)
#plot.margin = unit(c(0, 0, 0, 0), "cm") #top, right, bottom, left
) +
scale_x_discrete(expand = c(0,0),
labels = c("degree1" = "一区", "degree2" = "二区",
"degree3" = "三区", "degree4" = "四区")
) +
scale_y_discrete(expand = c(0,0)) 
2.12 更多
还可以做各种统计和可视化,在后面的章节一一展示吧