3.4 High and low water
3.4.1 Using tide tables
Tides are caused by the moon pulling on the water in the earth’s oceans. Around the UK, the tide varies from it’s highest (high water) to it’s lowest (low water) over about 6 hours. The range of the tide varies by location and over time. The largest tides are called ‘spring tides’, the smallest ‘neap tides’. It takes about a week for the tide to cycle from springs to neaps.
The tide at ports is of significant interest to mariners and data exists on the height of tide going back many years. For example, data at https://www.bodc.ac.uk gives records of the tide at Newlyn in Cornwall going back to 1915. These data enables very accurate forecasts to be made of the times of high and low water at locations known as ‘standard ports’, which are given in tide tables.
Tide tables are easy to use, but often report times in Greenwich Mean Time (GMT). During summer, when British Summer Time (BST) is in operation, an hour needs to be added to give the correct time. Some tide tables are given with the corrections for BST already applied - so always check if you’re using an unfamiliar tide table!
Tide tables are available from many sources. I find that the most useful are:
- The National Tide and Sea Level Facility: Accurate data for all major UK ports for the next 28 days.
- Easytide: UKHO site giving predictions 7 days ahead for practically anywhere in the world.
- Visit My Harbour: An impressive array of free tide tables for the whole of the current year.
- Imray Tides Planner phone app - provides yearly data for a few pounds
Tide tables can, of course, be purchased in printed form. They also appear in nautical almanacs that are republished each year. I find it useful to obtain a copy of Reeds Small Craft Almanac each year so that I’m not reliant on an internet connection when I’m doing tidal planning.
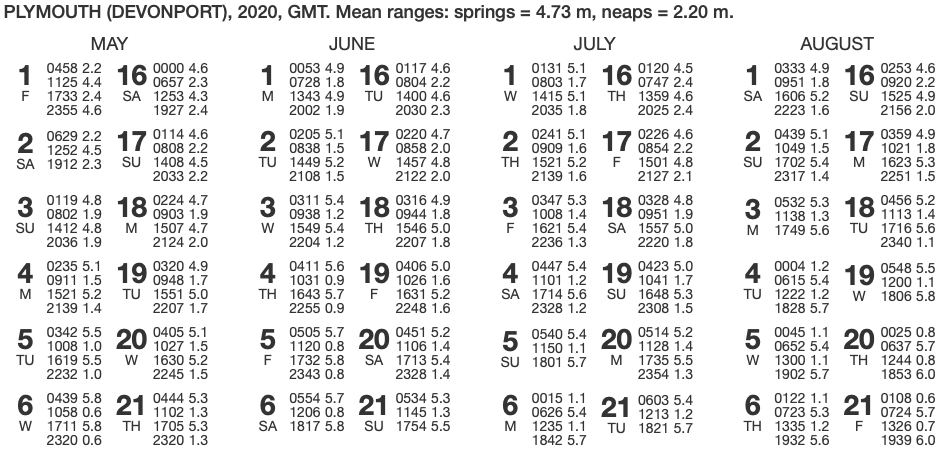
Find times of high and low water during the day at Plymouth on June 4th 2020.
Consult the tide table for Plymouth above. Note that times are given in GMT. Find the entry for June 4.
Big values of tidal height (5.6 m, 5.7 m) must refer to high water (HW). Low values (0.9, 0.9) refer to low water. So, during the day, the times are:
10:31 GMT   0.9 m   Low water
16:43 GMT   5.7 m   High water
(we’re ignoring the early morning high tide and the late night low tide)
Being June, British Summer Time (BST) is in operation. To convert to BST, we must add one hour to the times given:
11:31 BST   0.9 m   Low water
17:43 BST   5.7 m   High water
3.4.2 Find local high and low water times
We saw in the last section how to use a tide table.
Such detailed data is not available everywhere that we would wish to paddle. To overcome this problem, reference books quote tidal constants for other locations. These are either added or subtracted to times of high and low water at standard ports to give local high and low water times. For example, this extract from a paddling guidebook tells us when HW and LW will occur at a location in the Isles of Scilly.
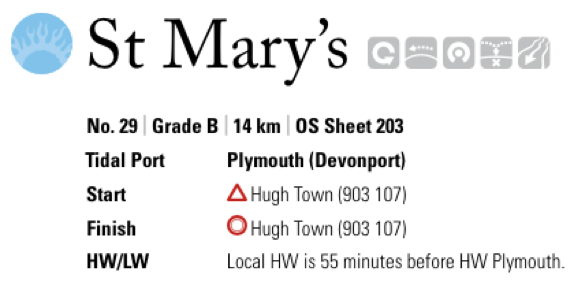
Find times of high and low water at St. Mary’s during the day on June 1st 2020.
Using the tide table, we can find the times of high and low water at Plymouth - ignoring the high water in early morning, and the low water late at night and remembering to add an hour for British Summer Time:
08:28 BST High water Plymouth
14:43 BST Low water Plymouth
We are told that HW and LW occur 55 minutes earlier than they do at Plymouth. Subtracting 55 minutes from the Plymouth times gives:
07:33 BST   HW ST MARYS
13:48 BST   LW ST MARYS
3.4.3 Effects of tides on planning
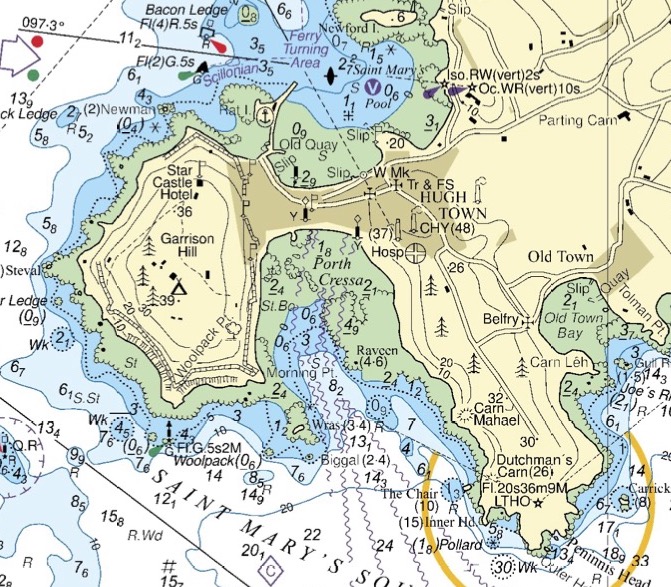
The degree to which the rise and fall of the tide affect our paddling plans depends on where we’re going paddling. Where coastlines are steep cliffs and the water is deep, the effect may be small. When coastlines are less steep and the water is shallow, large areas of the sea bed can be exposed at low water. This can make for long carries across beaches to get to the water. In some cases (e.g. paddling in estuaries), the options we have to paddle may be very different at high water and low water. The best approach to this is to consult a nautical chart - areas that dry at low tide are shown in green.
Often, we find that tidal streams, flows of water caused by the tide, are equally important for paddlers to consider as times of high and low water.