t = read.table('data/hic_gene_count')
t = t[t$V5>10,]
row.names(t) = paste0(t$V1,':',t$V2,'-',t$V3,'-',t$V4)
t$id = row.names(t)
tt = read.table('data/nhic_gene_count')
tt = tt[tt$V5>20,]
row.names(tt) = paste0(tt$V1,':',tt$V2,'-',tt$V3,'-',tt$V4)
tt$id = row.names(tt)
DEG2 = read.table('DEG2',row.names = 1,header = T)
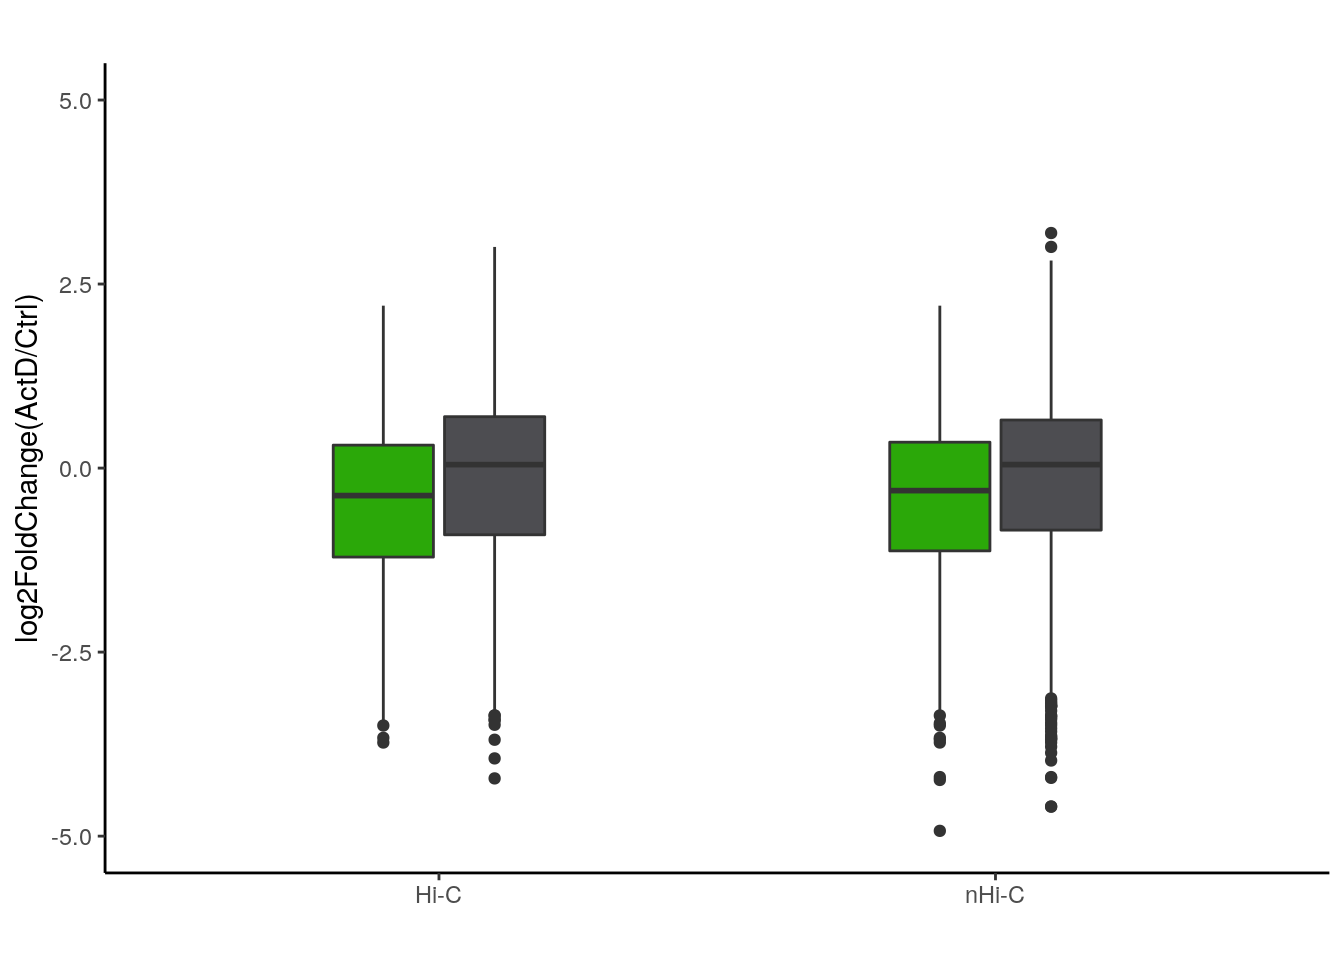
df = data.frame(log2FC = c(DEG2[unique(t$V4),2],DEG2[sample(1:12963,1205),2],DEG2[unique(tt$V4),2],DEG2[sample(1:12963,1782),2]),group = c(rep('Hi-C',1205), rep('Hic ActD',1205),rep('nhic',1782),rep('nhic_actd',1782)),dose = c(rep('Hi-C',1205*2),rep('nHi-C',1782*2)))
library(ggplot2)
bp <- ggplot(df, aes(x=dose, y=log2FC, fill=group)) +
geom_boxplot(width=0.4)+
scale_fill_manual(values=c("#2BA809", "#4D4D51","#2BA809", "#4D4D51"))+
labs(title="",x="", y = "log2FoldChange(ActD/Ctrl)")+ylim(-5,5)
bp + theme_classic()+theme(legend.position = 'none')