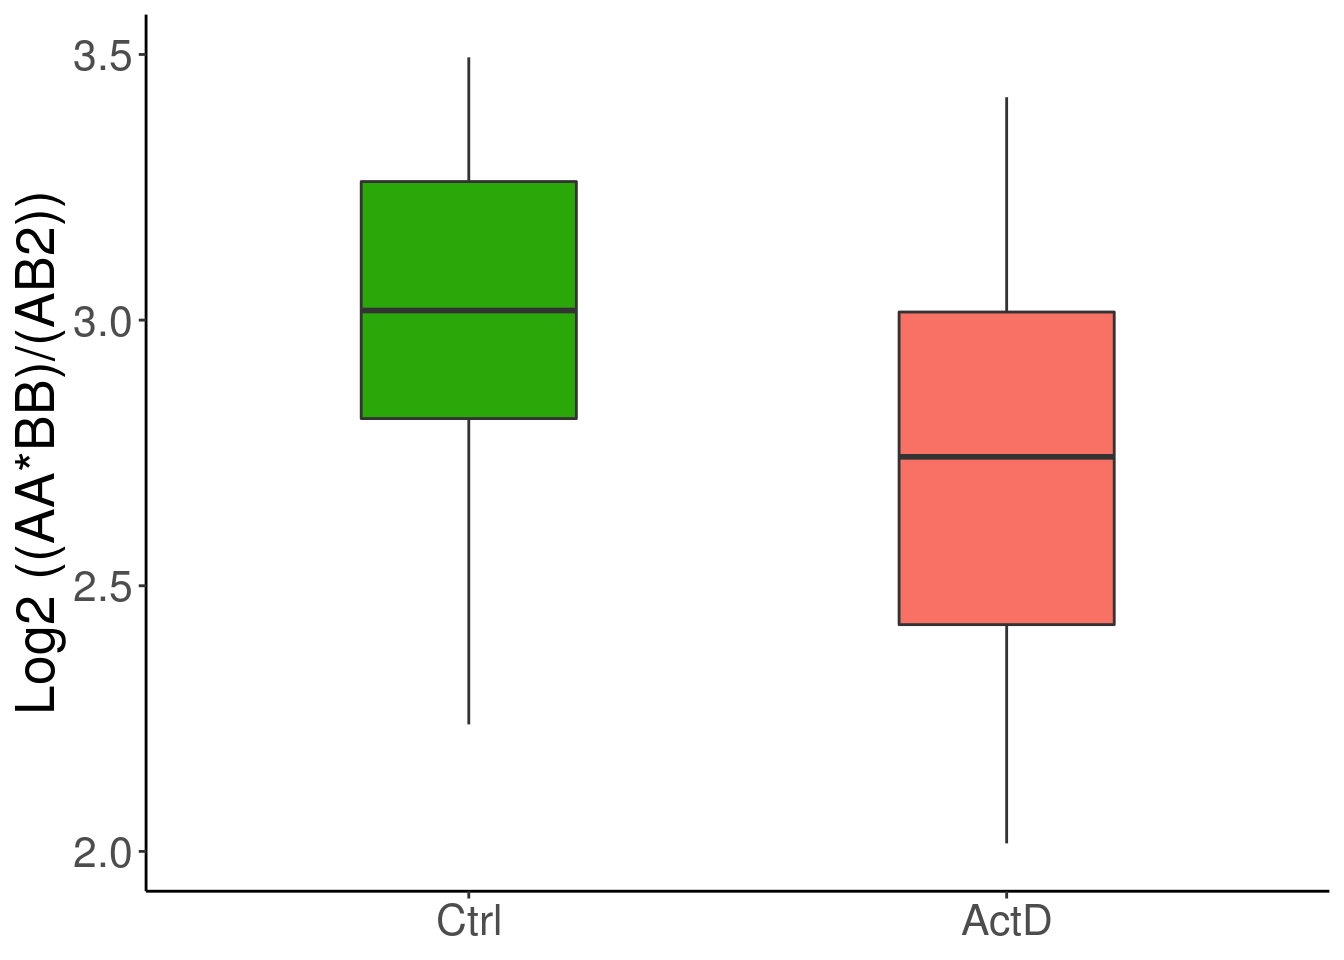
4.2 Fig 3D
df = read.table('data/compartment_score',header = T)
df$variable = factor(df$variable,levels = c('Ctrl','ActD'))
library(ggplot2)
ggplot(df, aes(variable, value))+
  geom_boxplot(width = 0.4,  notchwidth = .6, outlier.shape = NA,aes(fill=variable)) +
  labs(x=NULL,y="Log2 ((AA*BB)/(AB2))") +
  theme_classic() +
  theme(text = element_text(size = 20),legend.position = "none") +ylim(2,3.5)+
  scale_fill_manual(values=c("#2BA809", "#F97164"))
## Warning: Removed 8 rows containing non-finite values (stat_boxplot).