nad = read.table('data/hNAD_B_gene_num')
inad = read.table('data/other_B_gene_num')
nad = nad[,4]/(nad[,3]-nad[,2])*1000000
inad = inad[,4]/(inad[,3]-inad[,2])*1000000
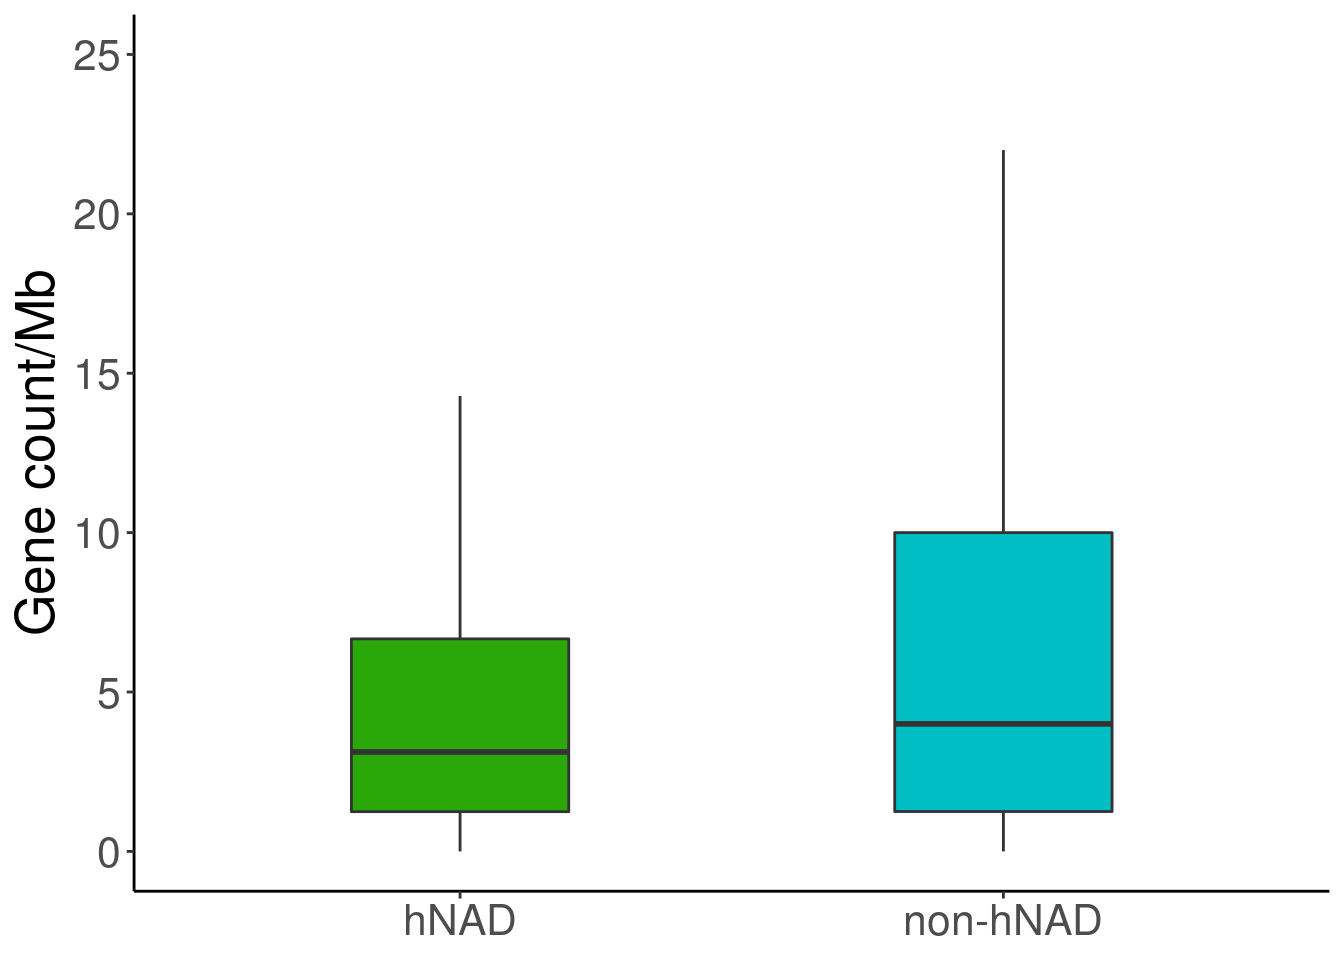
df = data.frame(variable=c(rep('hNAD',length(nad)),rep('non-hNAD',length(inad))),value=c(nad,inad))
ggplot(df, aes(variable, value))+
geom_boxplot(width = 0.4, notchwidth = 1, outlier.shape = NA,aes(fill=variable)) +
labs(x=NULL,y="Gene count/Mb") +
theme_classic() +
theme(text = element_text(size = 20),legend.position = "none") +
scale_fill_manual(values=c( "#2BA809","#00BFC4"))+ylim(0,25)