hela_rDNA_hotspot = read.table('data/nhic')
hela_rDNA_hotspot.ActD = read.table('data/nhic_actd')
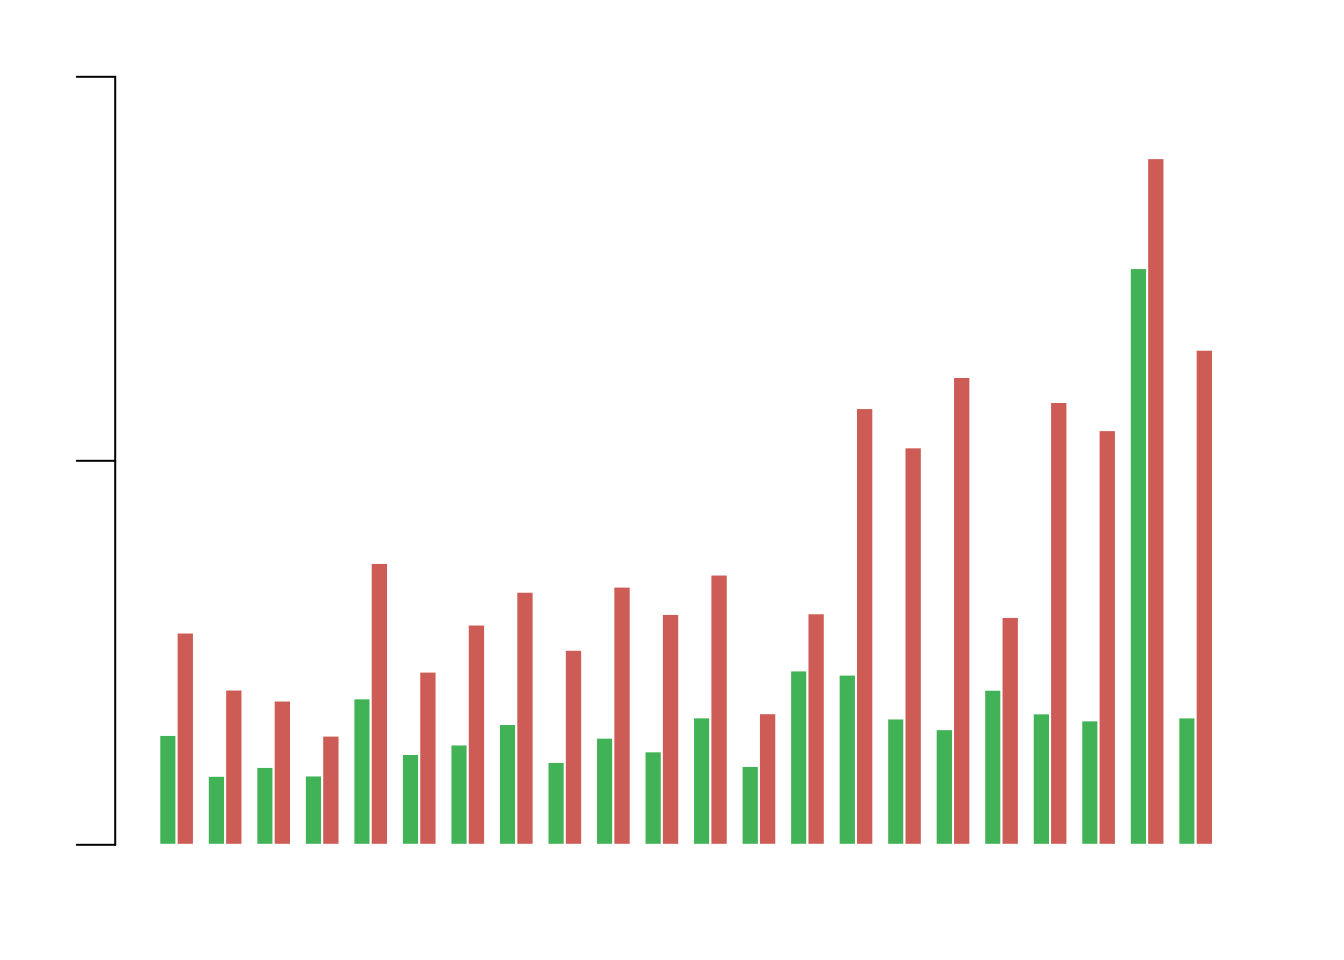
hotspot.matrix = matrix(rep(0,46),nrow = 2,ncol = 23)
chr_info = read.table('chr_info')
for(chrom_index in c(1:22)){
chrom_name = paste0('chr',chrom_index)
chrom.hotspot.table = hela_rDNA_hotspot[hela_rDNA_hotspot$V1==chrom_name,]
chrom.hotspot.ActD.table = hela_rDNA_hotspot.ActD[hela_rDNA_hotspot.ActD$V1==chrom_name,]
hotspot.matrix[1,chrom_index] = sum(chrom.hotspot.table[,3] - chrom.hotspot.table[,2]) / chr_info[chr_info$V1==chrom_name,2]
hotspot.matrix[2,chrom_index] = sum(chrom.hotspot.ActD.table[,3] - chrom.hotspot.ActD.table[,2]) / chr_info[chr_info$V1==chrom_name,2]
}
par(mar=c(3,3,2,1),family="Arial",font=1)
barplot(hotspot.matrix,beside = T,col=c("#42B256","#CC5C55"),border = F,space = c(0,0.8),width = 5,xaxt="n",yaxt="n",ylim=c(0,0.001))
axis(side = 2,at=seq(0,0.001,0.0005),labels = F,cex.axis=2,lwd=1,tck=-0.05)