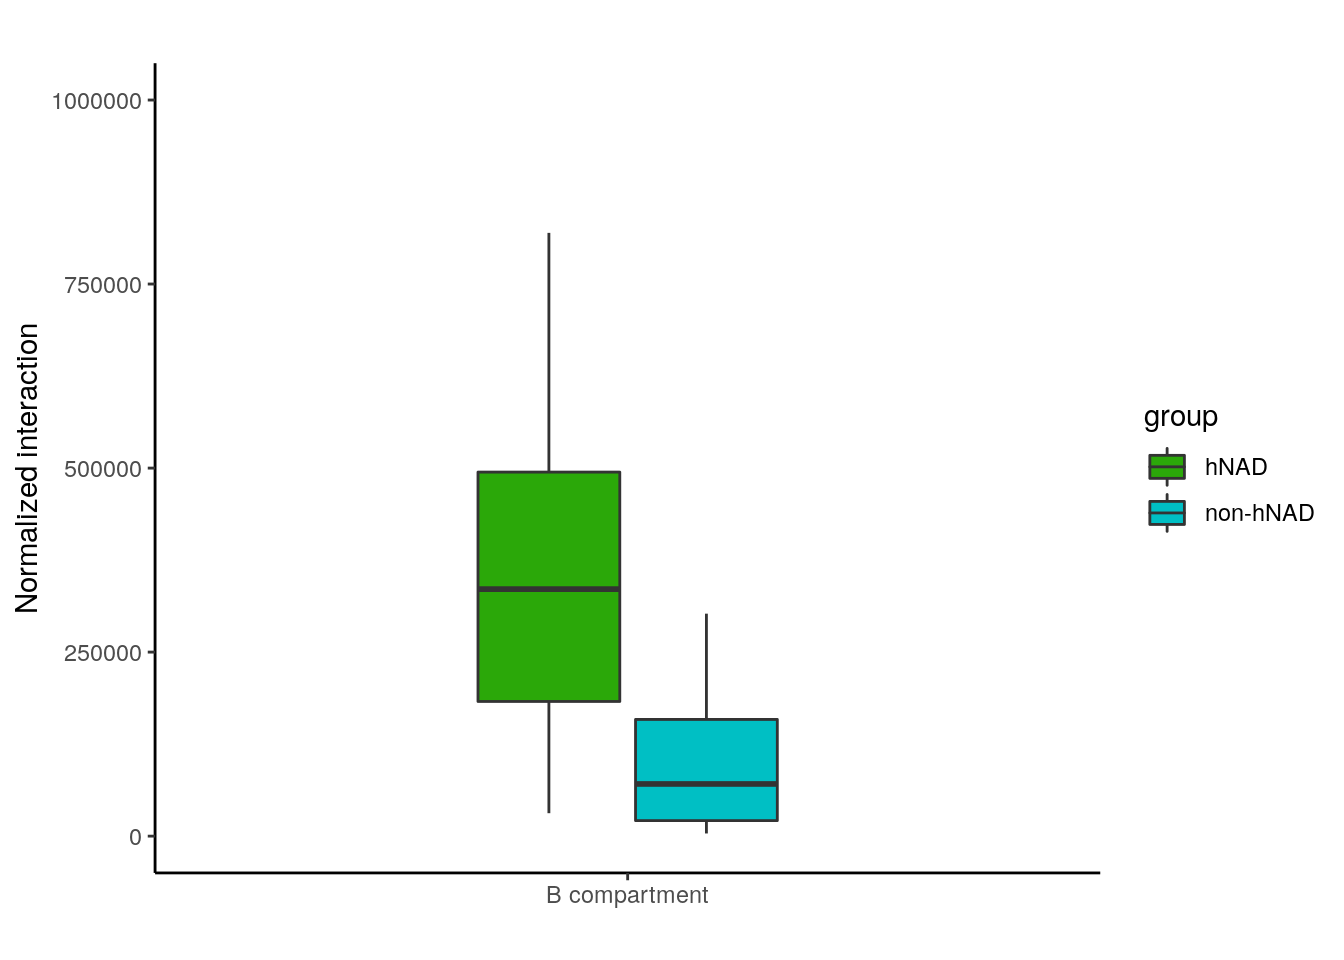
bb = read.table('data/nonhNAD_participated_BB_interaction')
bb = bb[bb$V1!=bb$V4,]
hnadb = read.table('data/hNAD_participated_BB_interaction')
hnadb = hnadb[hnadb$V1!=hnadb$V4,]
chr_inter = data.frame(chr=paste0('chr',c(2:22)),hNAD=0,non_hNAD=0)
for(i in 2:22){
  t = sum(bb[bb$V1==paste0('chr',i),7])
  chr_inter[chr_inter$chr==paste0('chr',i),3] = t
  tt = sum(hnadb[hnadb$V1==paste0('chr',i),7])
  chr_inter[chr_inter$chr==paste0('chr',i),2] = tt
}
df = data.frame(inter = c(chr_inter$hNAD,chr_inter$non_hNAD),group = c(rep('hNAD',21),
                                                                rep('non-hNAD',21)),
                dose = 'B compartment')
suppressMessages(library(ggplot2))
bp <- ggplot(df, aes(x=dose, y=inter, fill=group)) +
  geom_boxplot(width=0.4)+
  scale_fill_manual(values=c( "#2BA809","#00BFC4"))+
  labs(title="",x="", y = "Normalized interaction")+ylim(0,1000000)
bp + theme_classic()
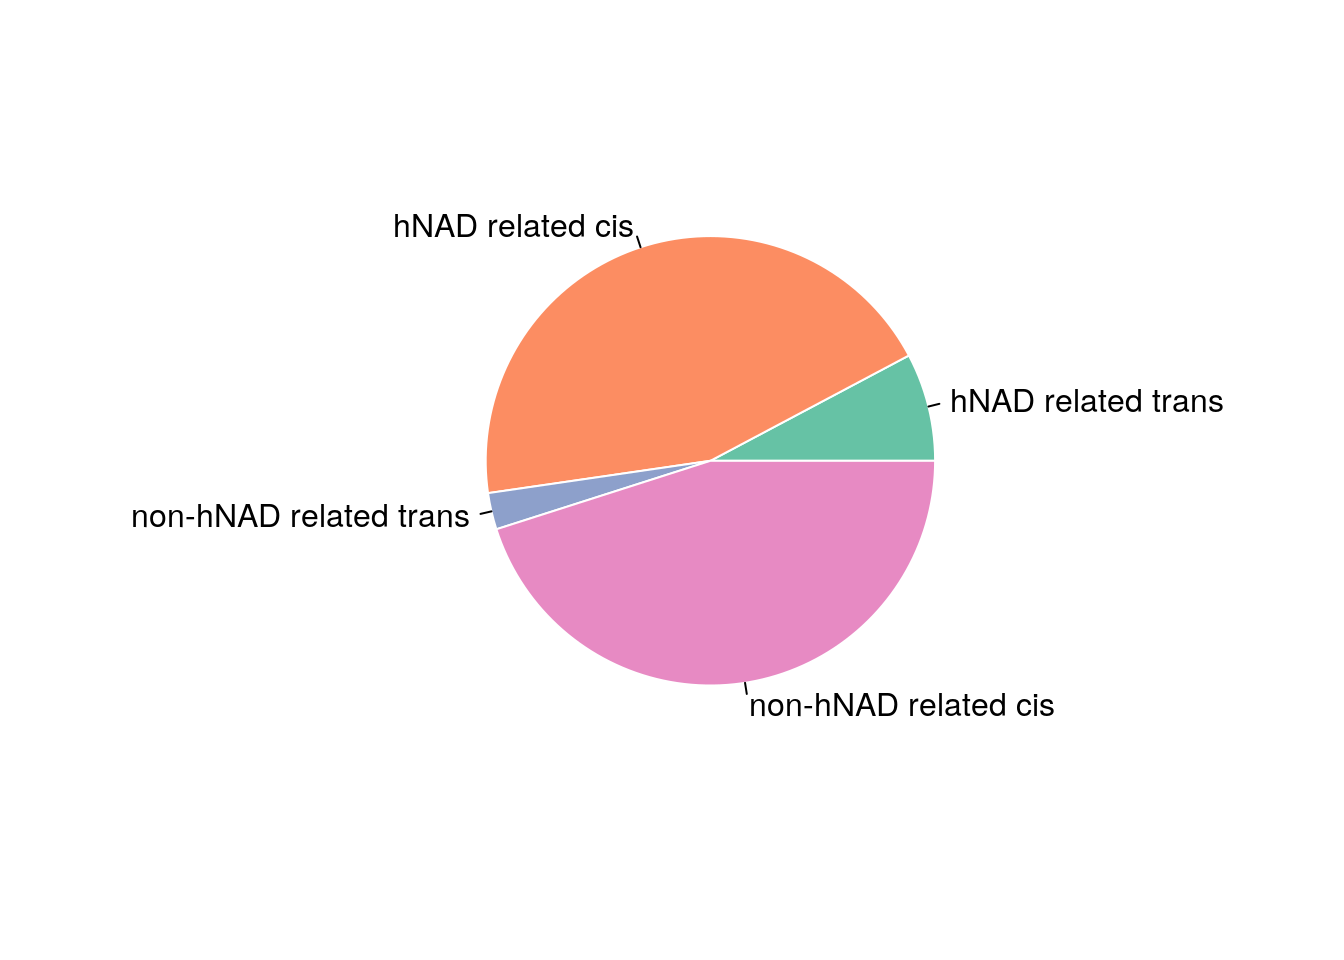
bb = read.table('data/BB_interaction')
hnadb = read.table('data/hNAD_participated_BB_interaction')
Prop = c(sum(hnadb[hnadb$V1!=hnadb$V4,7]),sum(hnadb[hnadb$V1==hnadb$V4,7]),
         sum(bb[bb$V1!=bb$V4,7])-sum(hnadb[hnadb$V1!=hnadb$V4,7]),
         sum(bb[bb$V1==bb$V4,7])-sum(hnadb[hnadb$V1==hnadb$V4,7]))/sum(bb$V7)
library(RColorBrewer)
myPalette <- brewer.pal(6, "Set2")
pie(Prop , labels = c('hNAD related trans','hNAD related cis','non-hNAD related trans','non-hNAD related cis'), border="white", col=myPalette )