Chapter 5 Exploration - H1
# Créer la BD finale pour les analyses de l'hypothèse 1 #

### Charger les bibliothèques ###

library(ape)
library(car)
library(data.table)
library(dplyr)
library(gclus)
library(ggplot2)
library(ggpmisc)
library(ggpubr)
library(gridExtra)
library(janitor)
library(lme4)
library(lmodel2)
library(lubridate)
library(naniar)
library(pals)
library(performance)
library(readxl)
library(robustlmm)
library(SciViews)
library(splines)
library(tidyverse)
library(vegan)
library(visreg)
options(ggrepel.max.overlaps = Inf)

#setwd("C:/Users/Sarah/Desktop/Maitrise/Données/")

#### Importer les données ####

data0 = readRDS("C:/Users/Sarah/Desktop/Maitrise/Données/Data/data_hyp1_final.rds")
str(data)
## 'data.frame': 237 obs. of 55 variables:
## $ Age : num 2 2 3 4 4 4 4 4 4 5 ...
## $ Secteur : Factor w/ 4 levels "Gaspesie","Mauricie",..: 4 4 3 3 4 4 1 4 3 2 ...
## $ ID_Animal : Factor w/ 102 levels "G201901","G201902",..: 102 94 69 50 72 76 12 88 69 18 ...
## $ Annee : Factor w/ 8 levels "2016","2017",..: 8 7 7 3 3 3 5 7 8 1 ...
## $ Mois : Factor w/ 3 levels "2","3","4": 1 2 1 1 2 2 2 2 2 1 ...
## $ Jour : Factor w/ 31 levels "1","10","11",..: 17 15 21 15 14 15 18 13 12 17 ...
## $ Annee_Capture : Factor w/ 2 levels "NON","OUI": 1 1 2 2 2 2 2 2 1 2 ...
## $ Weight_Summer : num NA NA 94.6 89.8 114.8 ...
## $ Date_Summer : chr "Non suivie" "Non suivie" "2021-07-14" "2017-07-24" ...
## $ Total_Length_Summer : num NA NA 139 135 158 142 136 135 NA 137 ...
## $ Neck_Circum_Summer : num NA NA 39 39 43 44.3 38 43 NA 41 ...
## $ Chestgirth_Summer : num NA NA 68 64 73 58 64 68 NA 67 ...
## $ Body_Condition_Summer : Factor w/ 5 levels "BONNE","EXCELLENTE",..: 5 5 1 1 1 4 4 4 5 2 ...
## $ Weight_Precwinter : num NA NA NA NA NA ...
## $ Date_Precwinter : Date, format: NA NA ...
## $ Total_Length_Precwinter : num NA NA NA NA NA NA NA NA 153 NA ...
## $ Neck_Circum_Precwinter : num NA NA NA NA NA NA NA NA 41 NA ...
## $ Chestgirth_Precwinter : num NA NA NA NA NA NA NA NA 77 NA ...
## $ Body_Condition_Precwinter : Factor w/ 6 levels "BONNE","EXCELLENTE",..: 6 6 6 6 6 6 6 6 4 6 ...
## $ Weight_Winter : num 42.8 45.1 120.8 139.2 158.8 ...
## $ Date_Winter : Date, format: "2023-02-24" "2022-03-22" ...
## $ Total_Length_Winter : num 104 118 153 147 170 161 150 145 138 153 ...
## $ Neck_Circum_Winter : num 31 31 41 42 47.5 47.5 47 40 46 40 ...
## $ Chestgirth_Winter : num 53 53 77 79 92 86 79 70 68 69 ...
## $ Body_Condition_Winter : Factor w/ 4 levels "BONNE","EXCELLENTE",..: 4 3 4 1 2 2 4 4 4 1 ...
## $ Presence_of_Youngs : Factor w/ 2 levels "NON","OUI": 1 1 1 1 2 1 1 1 1 1 ...
## $ Age_of_Youngs : Factor w/ 4 levels "2 YEARS OLD",..: 3 3 3 3 2 3 3 3 3 3 ...
## $ Number_of_Youngs : num 0 0 0 0 3 0 0 0 0 0 ...
## $ Weightx_Young_f : num NaN NaN NaN NaN NA NaN NaN NaN NaN NaN ...
## $ Weightx_Young_m : num NaN NaN NaN NaN 3.43 ...
## $ Weightx_Young : num NaN NaN NaN NaN 3.43 ...
## $ Status_Preceeding_Winter : Factor w/ 4 levels "ALONE","CUB",..: 3 3 3 3 3 3 3 3 1 3 ...
## $ Id_Young : chr "NaN" "NaN" "NaN" "NaN" ...
## $ Day_Cumul : num 55 81 59 53 80 81 85 79 61 55 ...
## $ Year_Precwinter : Factor w/ 7 levels "2016","2017",..: NA NA NA NA NA NA NA NA 7 NA ...
## $ Year_Winter : Factor w/ 8 levels "2016","2017",..: 8 7 7 3 3 3 5 7 8 1 ...
## $ Weight_Precwinter_KG : num NA NA NA NA NA ...
## $ Weight_Winter_KG : num 19.4 20.5 54.8 63.1 72 ...
## $ Weightx_Young_f_KG : num NaN NaN NaN NaN NA NaN NaN NaN NaN NaN ...
## $ Weightx_Young_m_KG : num NaN NaN NaN NaN 1.56 ...
## $ Weightx_Young_KG : num NaN NaN NaN NaN 1.56 ...
## $ Pres_Cubs : Factor w/ 2 levels "AVEC","SANS": 2 2 2 2 1 2 2 2 2 2 ...
## $ Reprod : Factor w/ 2 levels "0","1": 1 1 1 1 2 1 1 1 1 1 ...
## $ Weight_Winter_Corr_KG : num 16.8 21.4 52.7 60.2 73.6 ...
## $ Chestgirth_Winter_Corr : num 50.3 54 74.9 76.1 93.6 ...
## $ Neck_Circum_Winter_Corr : num 30.7 31.1 40.8 41.7 48 ...
## $ diff_to_10 : num 18.9 18.9 NA NA NA ...
## $ Total_Length_Winter_Age : num 123 137 NA NA NA ...
## $ Weightx_Young_Corr_KG : num NA NA NA NA 1.45 ...
## $ Weight_Young_KG_Sum : num NA NA NA NA 4.36 ...
## $ PCA1_Score : num -8.57 -7.33 -1.36 -1.17 2.69 ...
## $ Weight_Winter_Corr_KG_IMP : num 16.8 21.4 52.7 60.2 73.6 ...
## $ Total_Length_Winter_IMP : num 104 118 153 147 170 161 150 145 138 153 ...
## $ Neck_Circum_Winter_Corr_IMP: num 30.7 31.1 40.8 41.7 48 ...
## $ Chestgirth_Winter_Corr_IMP : num 50.3 54 74.9 76.1 93.6 ...## [1] "Age" "Secteur"
## [3] "ID_Animal" "Annee"
## [5] "Mois" "Jour"
## [7] "Annee_Capture" "Weight_Summer"
## [9] "Date_Summer" "Total_Length_Summer"
## [11] "Neck_Circum_Summer" "Chestgirth_Summer"
## [13] "Body_Condition_Summer" "Weight_Precwinter"
## [15] "Date_Precwinter" "Total_Length_Precwinter"
## [17] "Neck_Circum_Precwinter" "Chestgirth_Precwinter"
## [19] "Body_Condition_Precwinter" "Weight_Winter"
## [21] "Date_Winter" "Total_Length_Winter"
## [23] "Neck_Circum_Winter" "Chestgirth_Winter"
## [25] "Body_Condition_Winter" "Presence_of_Youngs"
## [27] "Age_of_Youngs" "Number_of_Youngs"
## [29] "Weightx_Young_f" "Weightx_Young_m"
## [31] "Weightx_Young" "Status_Preceeding_Winter"
## [33] "Id_Young" "Day_Cumul"
## [35] "Year_Precwinter" "Year_Winter"
## [37] "Weight_Precwinter_KG" "Weight_Winter_KG"
## [39] "Weightx_Young_f_KG" "Weightx_Young_m_KG"
## [41] "Weightx_Young_KG" "Pres_Cubs"
## [43] "Reprod" "Weight_Winter_Corr_KG"
## [45] "Chestgirth_Winter_Corr" "Neck_Circum_Winter_Corr"
## [47] "diff_to_10" "Total_Length_Winter_Age"
## [49] "Weightx_Young_Corr_KG" "Weight_Young_KG_Sum"
## [51] "PCA1_Score" "Weight_Winter_Corr_KG_IMP"
## [53] "Total_Length_Winter_IMP" "Neck_Circum_Winter_Corr_IMP"
## [55] "Chestgirth_Winter_Corr_IMP"# Variables indépendantes (x)
# PCA1_Score: Indice de condition corporelle (ICC)
# Variables dépendantes (y)
# Age_of_Youngs: Yearling, Cub ou None (none = échec reproduction, cub = succès, yearling = NA)
# Number_of_Youngs: Nombre de jeunes
# Weightx_Young_Corr_KG: Masse moyenne des jeunes
# Den_Weight_an_1_KG_Corr_Cub1-4: Masse par ourson
# Ratio_Survie: Ratio de survie des cubs vers yearling
# Variables aléatoires
# ID_Animal: Identifiant de l'animal
# Year_Winter: Année de la prise de données en tanière (pas hyp1)
# Secteur: Secteur d'étude (pas hyp1)
# Covariable potentielle
# Age: Âge en années. Gardé au cas où.
# Faire un fichier avec juste ces variables
data = data0 %>%
dplyr::select("ID_Animal", "Secteur", "Year_Winter", "PCA1_Score", "Age", "Age_of_Youngs", "Number_of_Youngs", "Weightx_Young_Corr_KG", "Den_Weight_an_1_KG_Corr_Cub1", "Den_Weight_an_1_KG_Corr_Cub2", "Den_Weight_an_1_KG_Corr_Cub3", "Den_Weight_an_1_KG_Corr_Cub4", "Ratio_Survie") %>%
mutate(Age_of_Youngs = fct_relevel(Age_of_Youngs, "NONE", "CUB", "YEARLING", "2 YEARS OLD")) # relevel
str(data) # ok## 'data.frame': 237 obs. of 13 variables:
## $ ID_Animal : Factor w/ 102 levels "G201901","G201902",..: 1 2 3 4 5 6 7 8 9 10 ...
## $ Secteur : Factor w/ 4 levels "Gaspesie","Mauricie",..: 1 1 1 1 1 1 1 1 1 1 ...
## $ Year_Winter : Factor w/ 8 levels "2016","2017",..: 5 5 5 5 5 5 5 5 5 5 ...
## $ PCA1_Score : num 0.817 0.143 -0.898 0.176 -2.195 ...
## $ Age : num 6 7 5 8 15 5 7 6 14 5 ...
## $ Age_of_Youngs : Factor w/ 4 levels "NONE","CUB","YEARLING",..: 3 2 2 3 3 2 1 2 2 2 ...
## $ Number_of_Youngs : num 2 2 3 2 3 2 0 2 3 3 ...
## $ Weightx_Young_Corr_KG : num NA 2.09 1.55 NA NA ...
## $ Den_Weight_an_1_KG_Corr_Cub1: num NA 2.14 1.61 NA NA ...
## $ Den_Weight_an_1_KG_Corr_Cub2: num NA 2.05 1.43 NA NA ...
## $ Den_Weight_an_1_KG_Corr_Cub3: num NA NA 1.61 NA NA ...
## $ Den_Weight_an_1_KG_Corr_Cub4: num NA NA NA NA NA NA NA NA NA NA ...
## $ Ratio_Survie : num NA NA NA NA NA NA NA NA NA NA ...# Charger data_cubs pour avoir la masse des oursons
data_cubs = readRDS("C:/Users/Sarah/Desktop/Maitrise/Données/Data/data_hyp1_final.rds")
# Masse individuelle des oursons
# masse_ind = as.data.frame(c(data$Den_Weight_an_1_KG_Corr_Cub1, data$Den_Weight_an_1_KG_Corr_Cub2, data$Den_Weight_an_1_KG_Corr_Cub3, data$Den_Weight_an_1_KG_Corr_Cub4))
# colnames(masse_ind)[1] = "masse"
# masse_ind = filter(masse_ind, !is.na(masse))
# #saveRDS(masse_ind, "Data/masse_ind.rds")5.1 Regard général
## [1] 102# Par secteur et année
data %>%
group_by(Secteur, Year_Winter) %>%
summarise(n = n()) %>%
pivot_wider(names_from = Year_Winter,
values_from = n,
values_fill = 0)## `summarise()` has grouped output by 'Secteur'. You can
## override using the `.groups` argument.## # A tibble: 4 × 9
## # Groups: Secteur [4]
## Secteur `2020` `2016` `2017` `2018` `2019` `2021` `2022` `2023`
## <fct> <int> <int> <int> <int> <int> <int> <int> <int>
## 1 Gaspesie 13 0 0 0 0 0 0 0
## 2 Mauricie 19 13 11 16 13 0 0 0
## 3 Outaouais 18 0 0 5 8 9 9 6
## 4 SLSJ 14 0 5 8 16 11 25 18# Problème des oursons
data_cubs = readRDS("C:/Users/Sarah/Desktop/Maitrise/Données/Data/data_cubs.rds")
# Différence entre le plus lourd et le plus léger d'une portée
diff_masse_cubs = data_cubs %>%
filter(Number_of_Youngs_an_1 > 1 & !is.na(Den_Weight_an_1_KG_Corr)) %>% # Juste les portées plus de 1 avec données
group_by(ID_Mere, Annee) %>%
mutate(Masse_Min = min(Den_Weight_an_1_KG_Corr),
Masse_Max = max(Den_Weight_an_1_KG_Corr),
Masse_Moy = mean(Den_Weight_an_1_KG_Corr),
Diff_Masse = Masse_Max - Masse_Min ) %>%
select("ID_Mere", "Annee", "Number_of_Youngs_an_1", "Masse_Min", "Masse_Max", "Masse_Moy", "Diff_Masse") %>%
distinct()
# Graphique
ggplot(diff_masse_cubs, aes(x = Diff_Masse)) + geom_density() +
geom_vline(aes(xintercept = mean(Diff_Masse)),
linetype = "dashed", size = 0.6, color = "#FC4E07")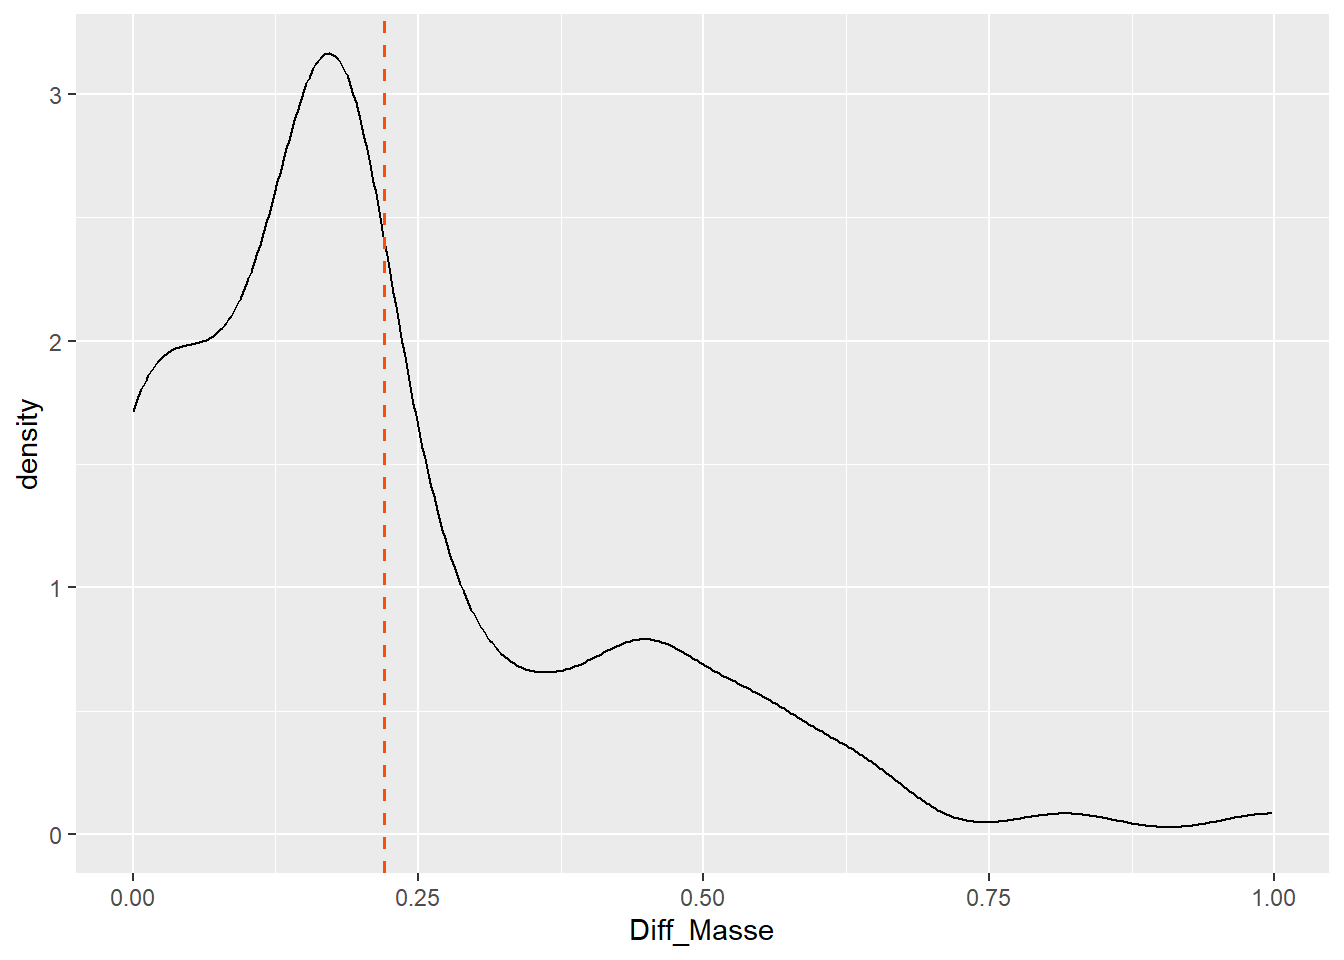
# Différence masse F et M des oursons
data_cubs %>%
  filter(!is.na(Den_Weight_an_1_KG_Corr)) %>%
  ggplot(aes(Sex, Den_Weight_an_1_KG_Corr, col = Sex)) +
  geom_jitter() +
  geom_boxplot(varwidth=T, alpha = 0.75) +
  labs(title="Masse des oursons selon leur sexe",
       x="Sexe",
       y="Masse (kg)") +
  theme(legend.position="none") # Sans légende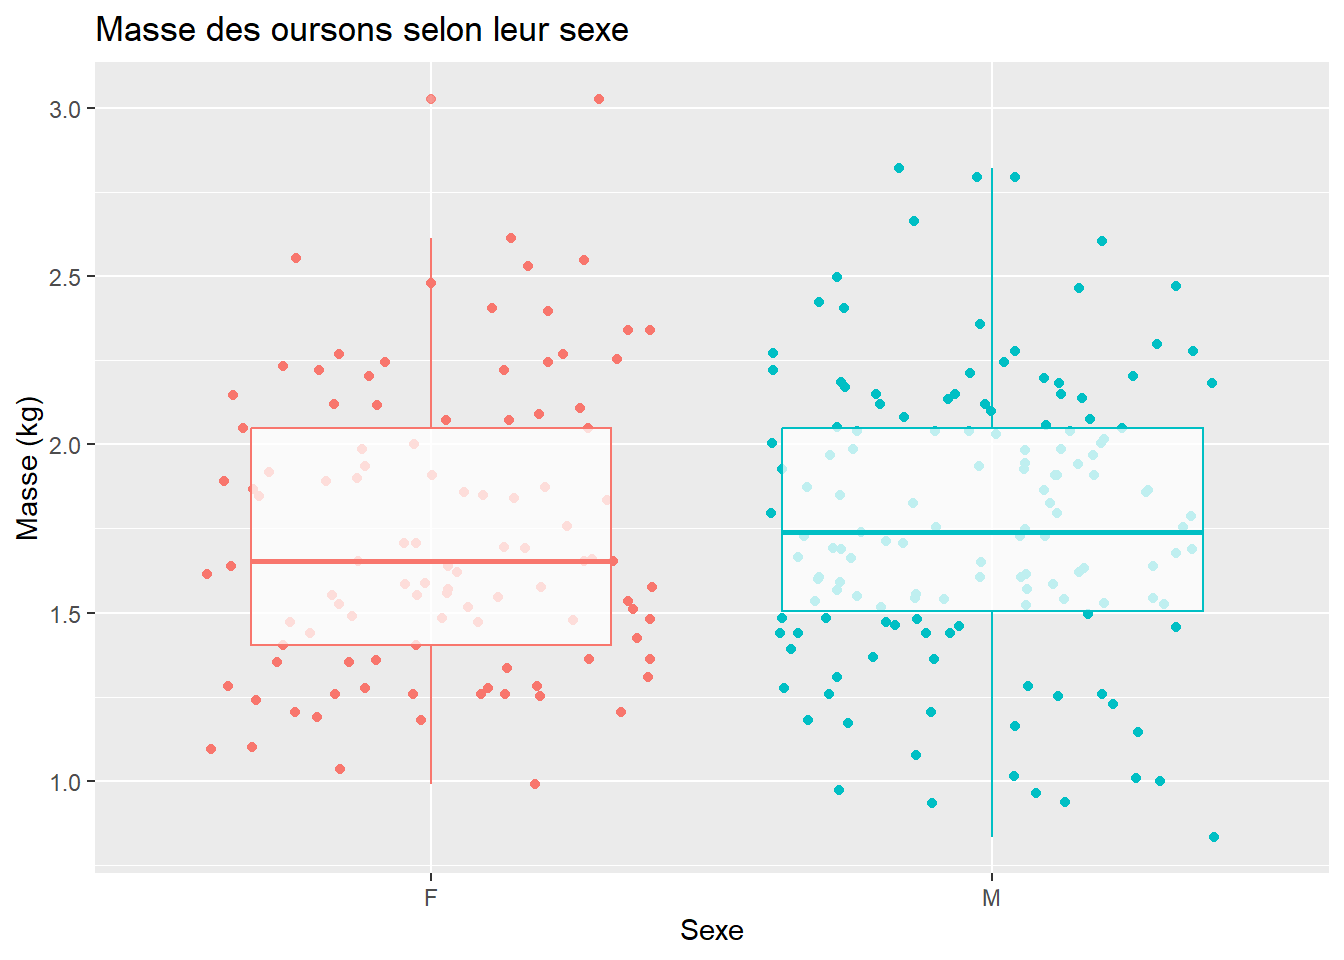
5.2 Étape 6
6.1 - Données aberrantes en X et Y
#### 6.1 - Données aberrantes en x et y ####
# On doit regarder s’il y a des données aberrantes dans les X ou le Y.

### Les X ###

## Âge
ggplot(data, aes(x = Age)) +
  geom_boxplot(fill = "#9bc1bc") +
  labs(title = "Distribution de l'âge") +
  theme_classic()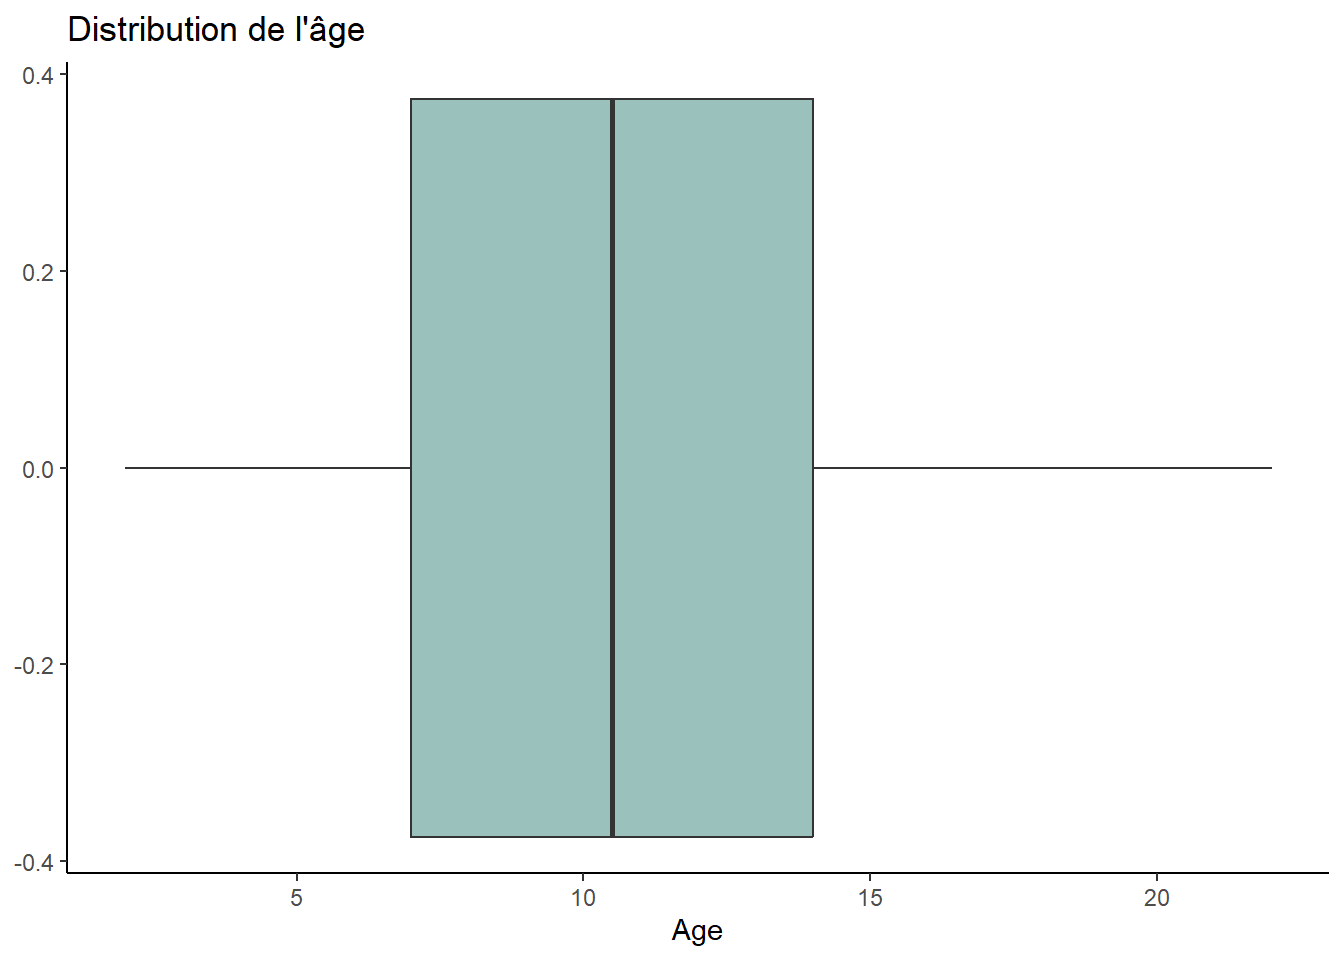
# Pas de valeur extrême

## ICC
ggplot(data, aes(x = PCA1_Score)) +
  geom_boxplot(fill = "#9bc1bc") +
  labs(title = "Distribution de l'ICC") +
  theme_classic()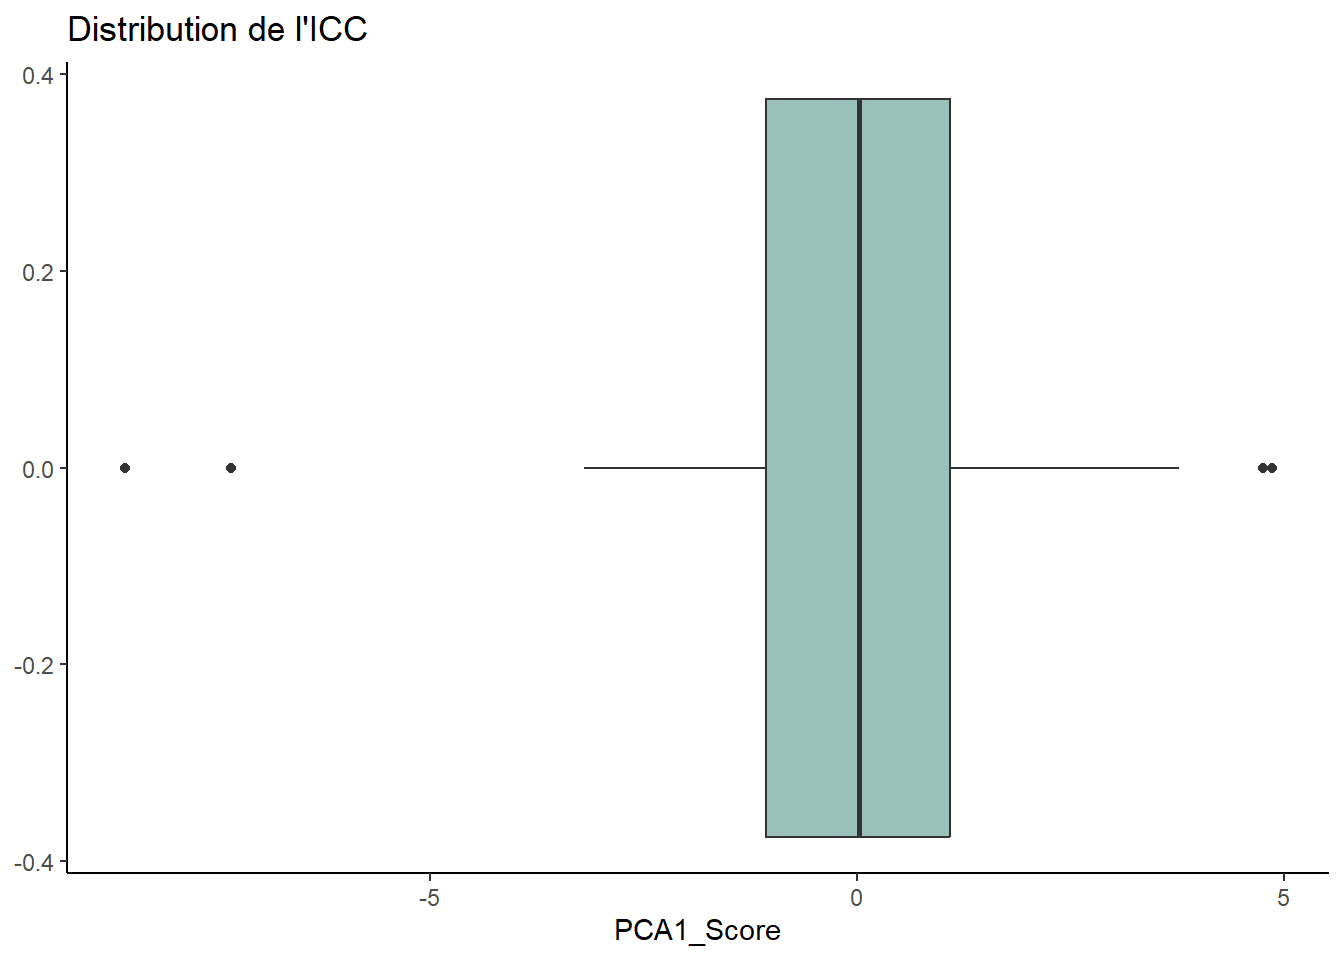
# Deux valeurs très faibles. Il y en a aussi deux avec des scores un peu plus élevés.

data %>% arrange(PCA1_Score) %>% head()
## ID_Animal Secteur Year_Winter PCA1_Score Age Age_of_Youngs Number_of_Youngs
## 1 S2022142 SLSJ 2023 -8.571076 2 NONE 0
## 2 S2021118 SLSJ 2022 -7.326528 2 NONE 0
## 3 M201511 Mauricie 2016 -3.188241 5 NONE 0
## 4 M201511 Mauricie 2018 -3.094908 7 YEARLING 1
## 5 M201983 Mauricie 2020 -3.029979 5 NONE 0
## 6 O201948 Outaouais 2020 -3.020531 7 YEARLING 3
## Weightx_Young_Corr_KG Den_Weight_an_1_KG_Corr_Cub1
## 1 NA NA
## 2 NA NA
## 3 NA NA
## 4 NA NA
## 5 NA NA
## 6 NA NA
## Den_Weight_an_1_KG_Corr_Cub2 Den_Weight_an_1_KG_Corr_Cub3
## 1 NA NA
## 2 NA NA
## 3 NA NA
## 4 NA NA
## 5 NA NA
## 6 NA NA
## Den_Weight_an_1_KG_Corr_Cub4 Ratio_Survie
## 1 NA NA
## 2 NA NA
## 3 NA NA
## 4 NA NA
## 5 NA NA
## 6 NA NA# Ce sont les deux jeunes de deux ans. À voir si on les garde dans les analyses.
data %>% arrange(desc(PCA1_Score)) %>% head()## ID_Animal Secteur Year_Winter PCA1_Score Age Age_of_Youngs Number_of_Youngs
## 1 M201981 Mauricie 2020 4.855429 13 CUB 3
## 2 S201871 SLSJ 2020 4.751423 13 CUB 2
## 3 O201705 Outaouais 2023 3.770271 21 NONE 0
## 4 O201823 Outaouais 2019 3.665178 15 CUB 2
## 5 S201617 SLSJ 2020 3.500166 8 CUB 3
## 6 O201957 Outaouais 2022 3.422240 13 CUB 2
## Weightx_Young_Corr_KG Den_Weight_an_1_KG_Corr_Cub1
## 1 1.987166 2.047646
## 2 2.305833 2.147074
## 3 NA NA
## 4 1.708501 1.935299
## 5 1.721516 1.706396
## 6 2.388896 2.479616
## Den_Weight_an_1_KG_Corr_Cub2 Den_Weight_an_1_KG_Corr_Cub3
## 1 2.047646 1.866207
## 2 2.464592 NA
## 3 NA NA
## 4 1.481702 NA
## 5 1.661036 1.797115
## 6 2.298177 NA
## Den_Weight_an_1_KG_Corr_Cub4 Ratio_Survie
## 1 NA NA
## 2 NA 1
## 3 NA NA
## 4 NA 1
## 5 NA 0
## 6 NA NA# Le top 2
### Les Y ###
## Masse moyenne des jeunes
ggplot(data, aes(x = Weightx_Young_Corr_KG)) +
geom_boxplot(fill = "#9bc1bc") +
labs(title = "Distribution de la masse des jeunes") +
theme_classic()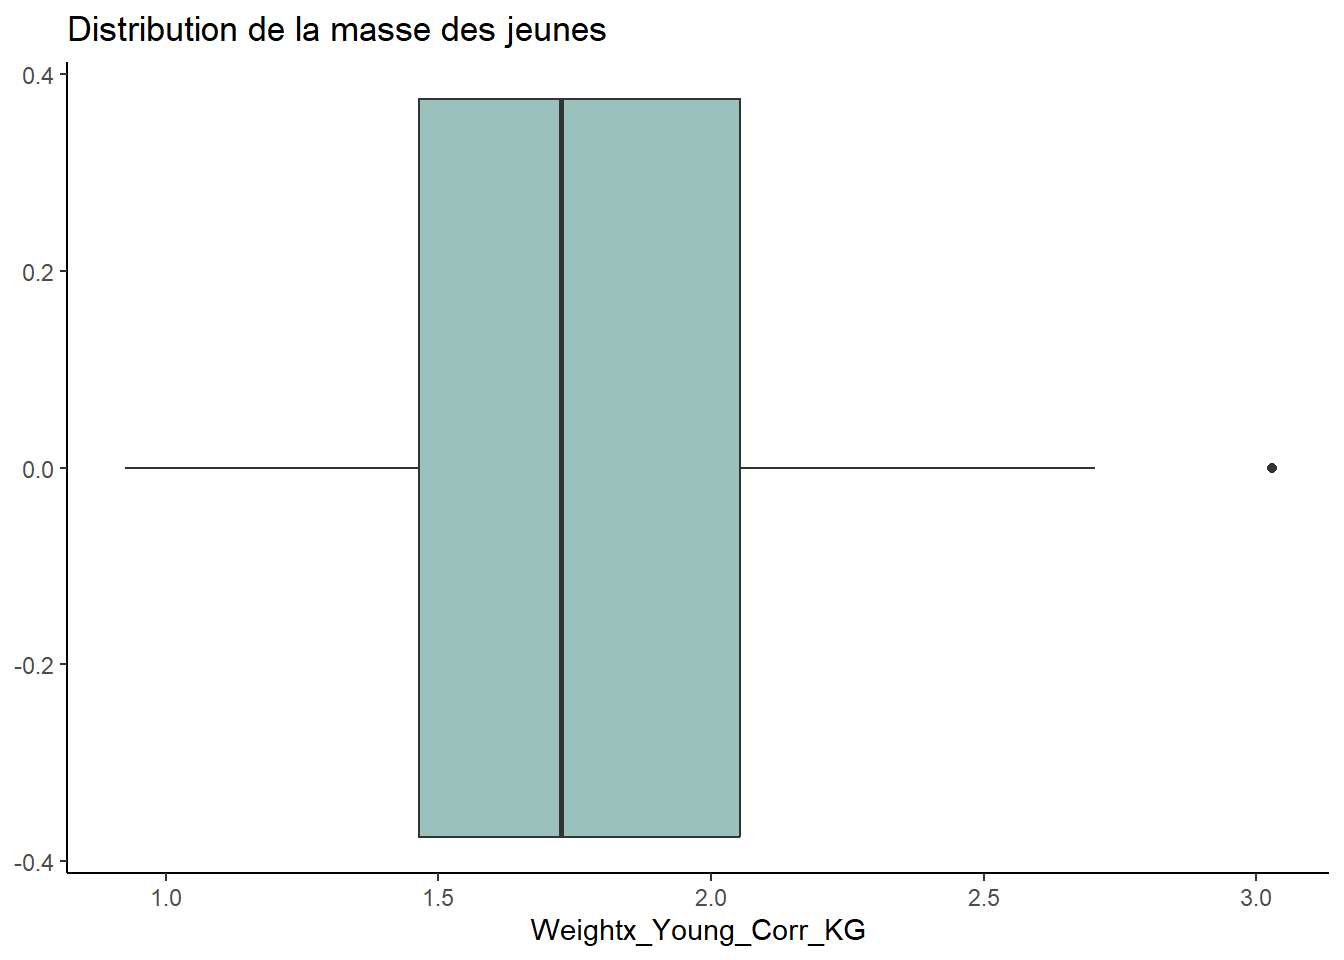
##   ID_Animal   Secteur Year_Winter PCA1_Score Age Age_of_Youngs Number_of_Youngs
## 1   M201986  Mauricie        2020  0.6017666   6           CUB                1
## 2   O201707 Outaouais        2019 -0.5357149  14           CUB                2
## 3   O201715 Outaouais        2020  0.5494042   6           CUB                1
## 4   O202196 Outaouais        2022  1.1693732   7           CUB                1
## 5   M201518  Mauricie        2018 -0.5402693  11           CUB                2
## 6   M201871  Mauricie        2020  1.5697358   8           CUB                3
##   Weightx_Young_Corr_KG Den_Weight_an_1_KG_Corr_Cub1
## 1              3.028286                     3.028286
## 2              2.704309                     2.795029
## 3              2.548708                     2.548708
## 4              2.531435                     2.531435
## 5              2.514306                     2.605026
## 6              2.492631                     2.795029
##   Den_Weight_an_1_KG_Corr_Cub2 Den_Weight_an_1_KG_Corr_Cub3
## 1                           NA                           NA
## 2                     2.613590                           NA
## 3                           NA                           NA
## 4                           NA                           NA
## 5                     2.423587                           NA
## 6                     2.341432                     2.341432
##   Den_Weight_an_1_KG_Corr_Cub4 Ratio_Survie
## 1                           NA           NA
## 2                           NA            1
## 3                           NA            1
## 4                           NA           NA
## 5                           NA            1
## 6                           NA           NA
# M201986 a un cub de masse 3.0kg, le prochain les prochains étant de 2.7 et 2.5.
# Masse individuelle
data_cubs %>%
ggplot(aes(x = Den_Weight_an_1_KG_Corr)) +
geom_boxplot(fill = "#9bc1bc") +
labs(title = "Distribution de la masse individuelle des jeunes") +
theme_classic()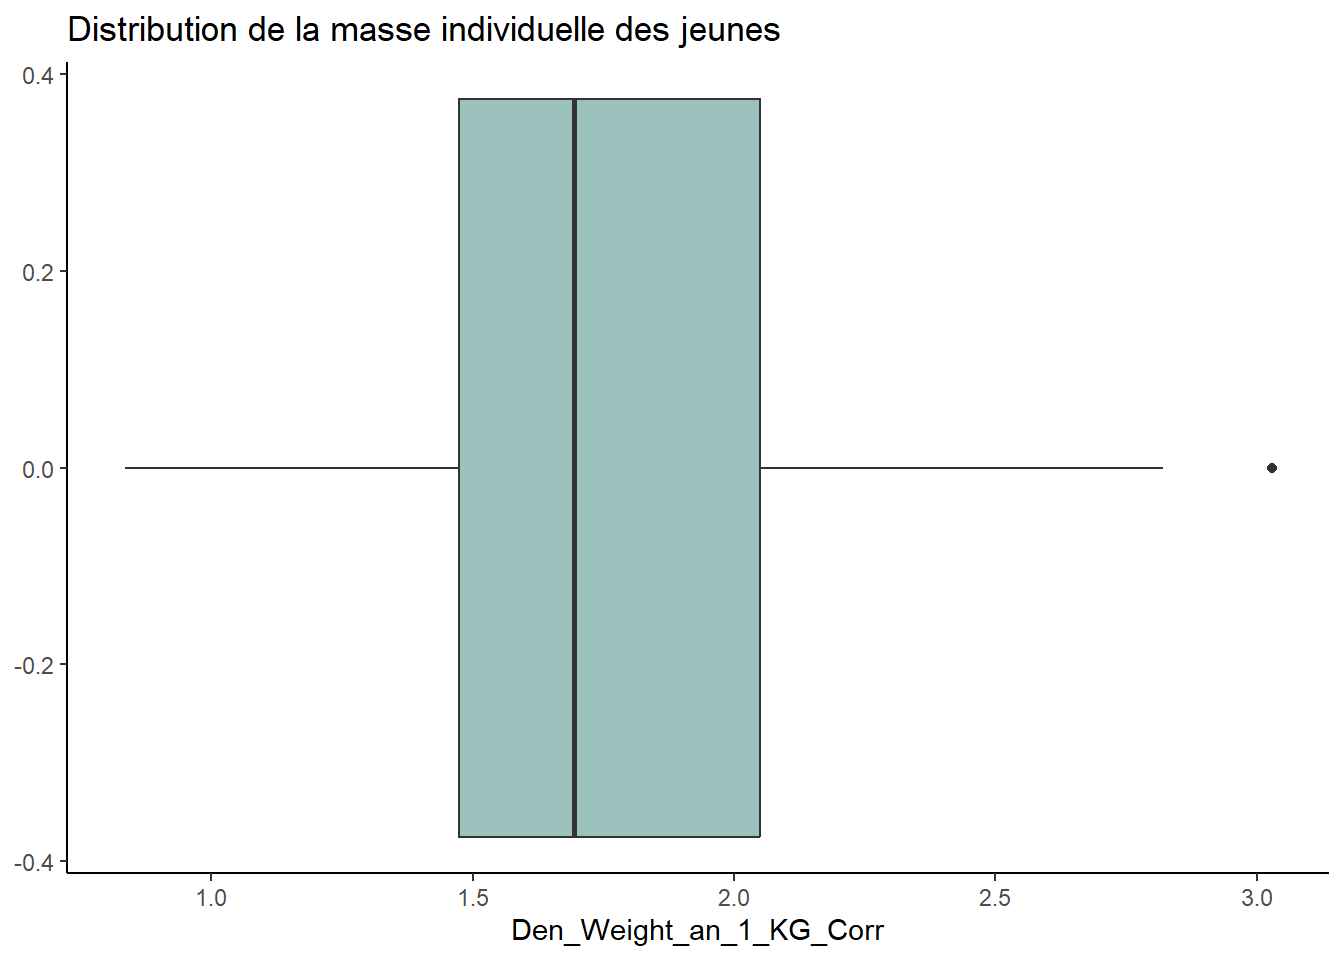
6.2 - Homogénéité de la variance des Y
6.3 - Normalité des Y
#### 6.3 - Normalité des Y ####

## Masse des jeunes
ggplot(data, aes(x = Weightx_Young_Corr_KG)) +
  geom_histogram(aes(y = ..density..),
                 binwidth=0.1, colour="black", fill="#9bc1bc") +
  labs(title = "Distribution de la masse moyenne des jeunes") +
  geom_density(lwd = 0.5, fill = "grey", alpha = 0.4) +
  theme_classic()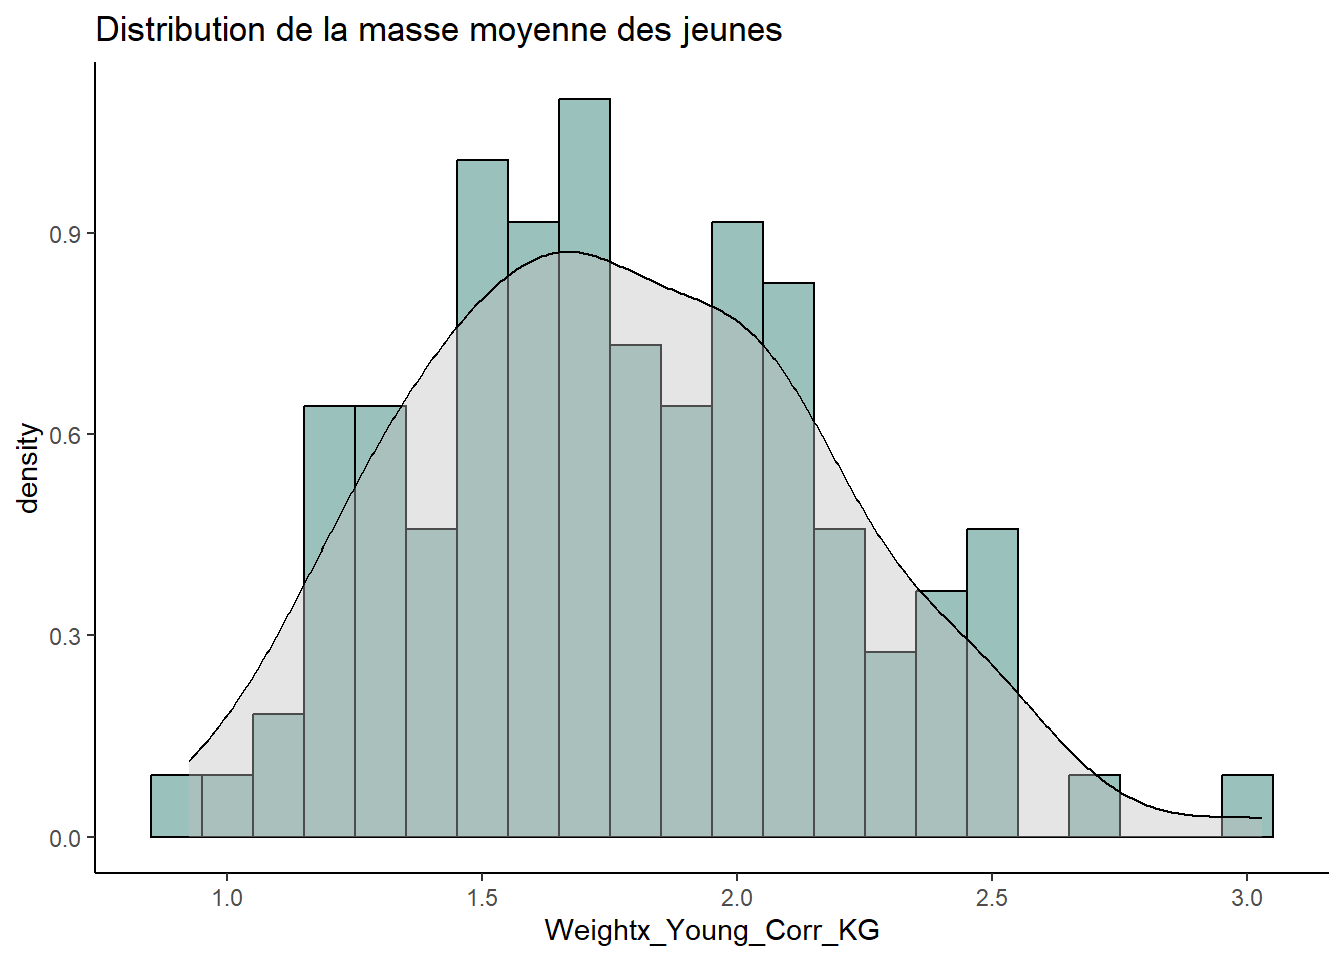
# Distribution semble normale. Il y en a un  plus lourd que les autres (le même que tantôt.)

# Masse individuelle des jeunes
ggplot(data_cubs, aes(x = Den_Weight_an_1_KG_Corr)) +
  geom_histogram(aes(y = ..density..),
                 binwidth=0.1, colour="black", fill="#9bc1bc") +
  labs(title = "Distribution de la masse individuelle des jeunes") +
  geom_density(lwd = 0.5, fill = "grey", alpha = 0.4) +
  theme_classic()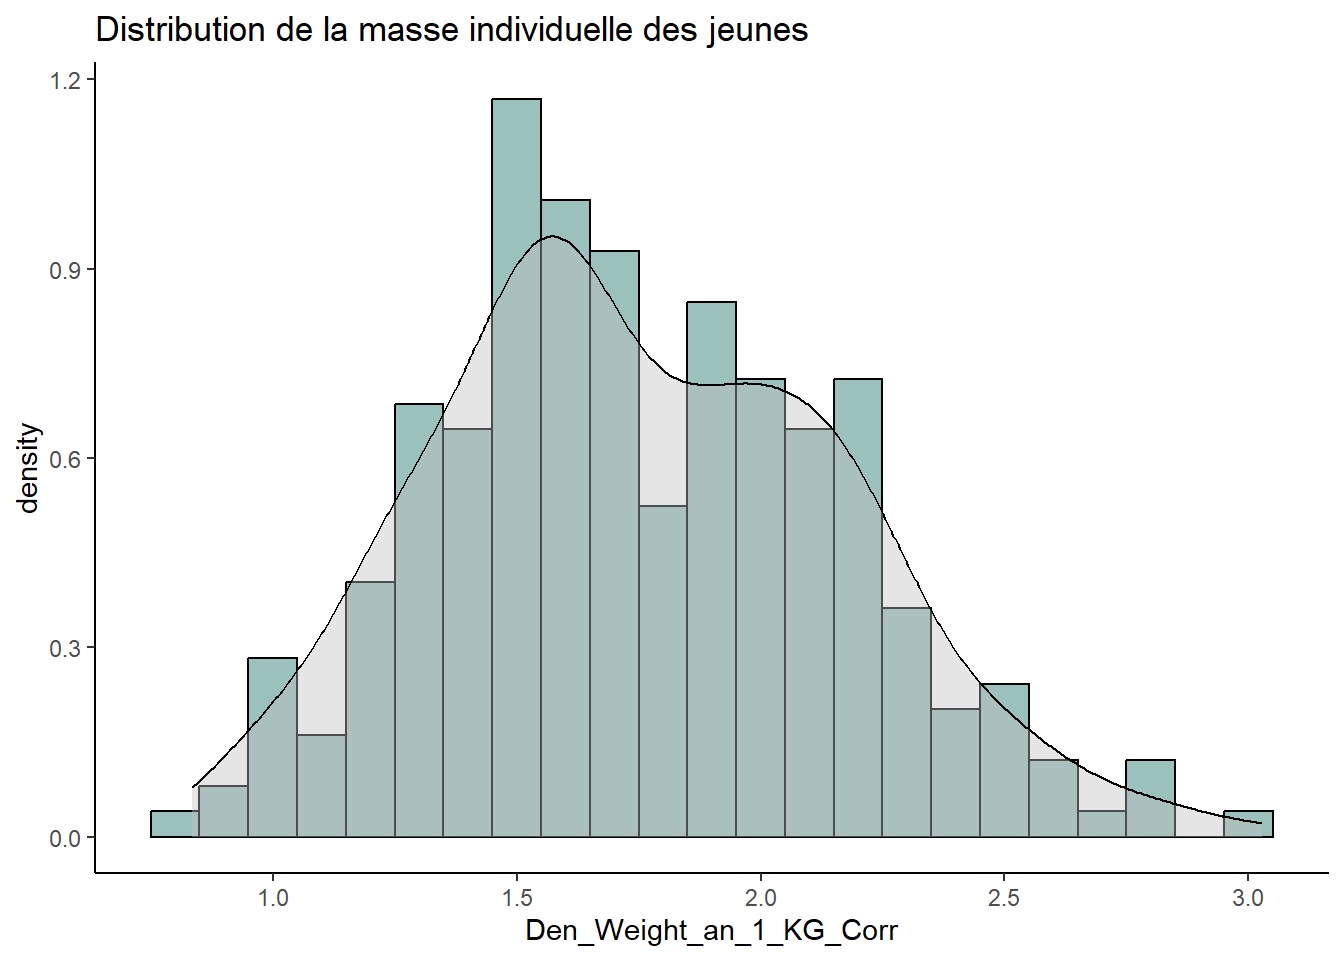
6.4 - Problèmes de 0 dans les Y
#### 6.4 - Problèmes de 0 dans les Y ####

# Nombre de cubs
data %>%
  filter(Age_of_Youngs != "YEARLING") %>%
  ggplot(aes(x = Number_of_Youngs)) +
  geom_bar(fill = "#9bc1bc") +
  labs(title = "Distribution du nombre d'oursons") +
  theme_classic()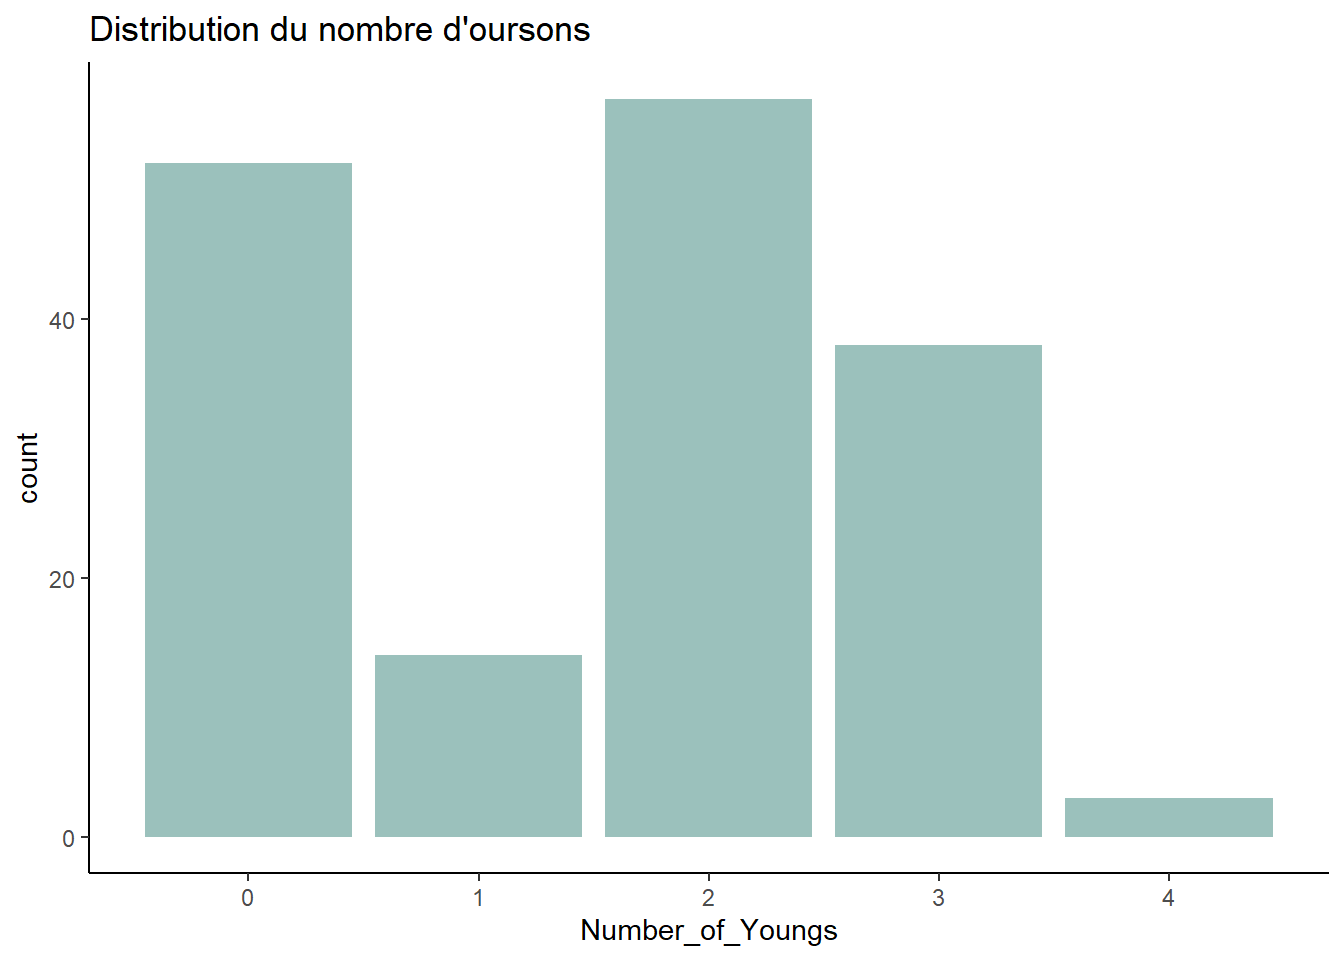
# Nb cubs qui survivent
# data %>%
#   ggplot(aes(x = Nb_Cubs_Survivants)) +
#   geom_bar(fill = "#9bc1bc") +
#   labs(title = "Distribution du nb d'oursons qui survivent") +
#   theme_classic()
6.5 - Colinéarité des X
#### 6.5 - Colinéarité des X ####

# La seule relation possible pourrait être entre l'ICC et l'âge, que je ne sais pas si je vais vraiment utiliser.

data %>%
  ggplot(aes(x=Age, y=PCA1_Score)) +
   geom_point() +
   geom_smooth(method="lm", se=T) +
  labs(title="ICC selon l'âge") +
  stat_poly_eq() +
  theme_classic()
## `geom_smooth()` using formula = 'y ~ x'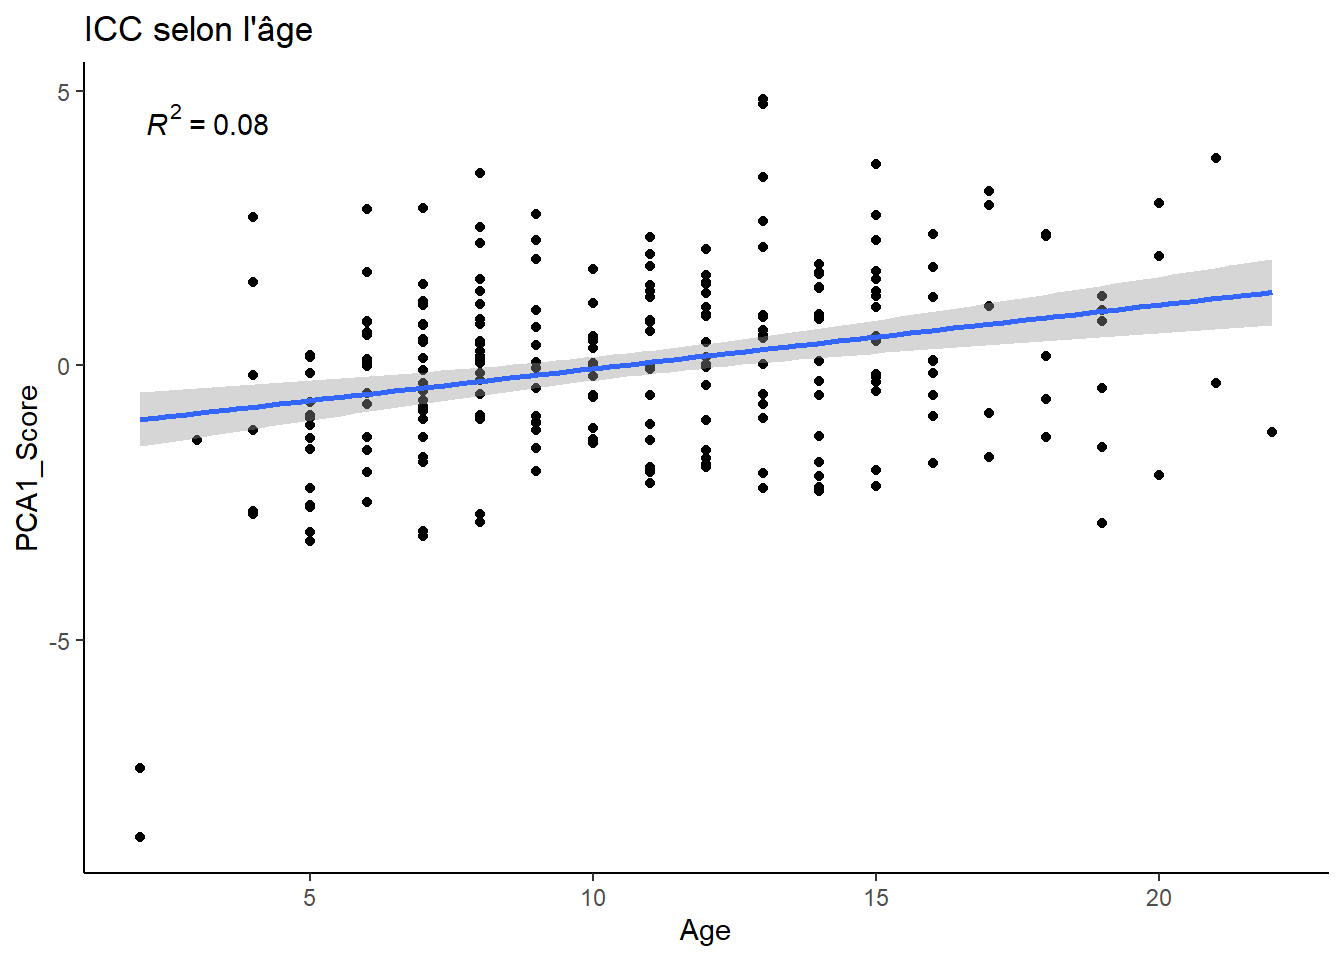
6.6 - Relations entre les X et Y
#### 6.6 - Relations entre les X et Y ####

  # selon icc
  # Age_of_Youngs: Yearling, Cub ou None X
  # Number_of_Youngs: Nombre de jeunes
  # Weightx_Young_Corr_KG: Masse moyenne des jeunes
  # Ratio_Survie: Ratio de survie des cubs vers yearling


# Age of youngs
  data %>%
    filter(Age_of_Youngs == "NONE" | Age_of_Youngs == "CUB") %>%
    ggplot(aes(PCA1_Score)) +
    geom_density(aes(fill=factor(Age_of_Youngs)), alpha=0.8) +
    labs(title="Succès de reproduction de la femelle selon son score",
         x="Score PC1",
         fill="Succès de reproduction") +
  theme_classic()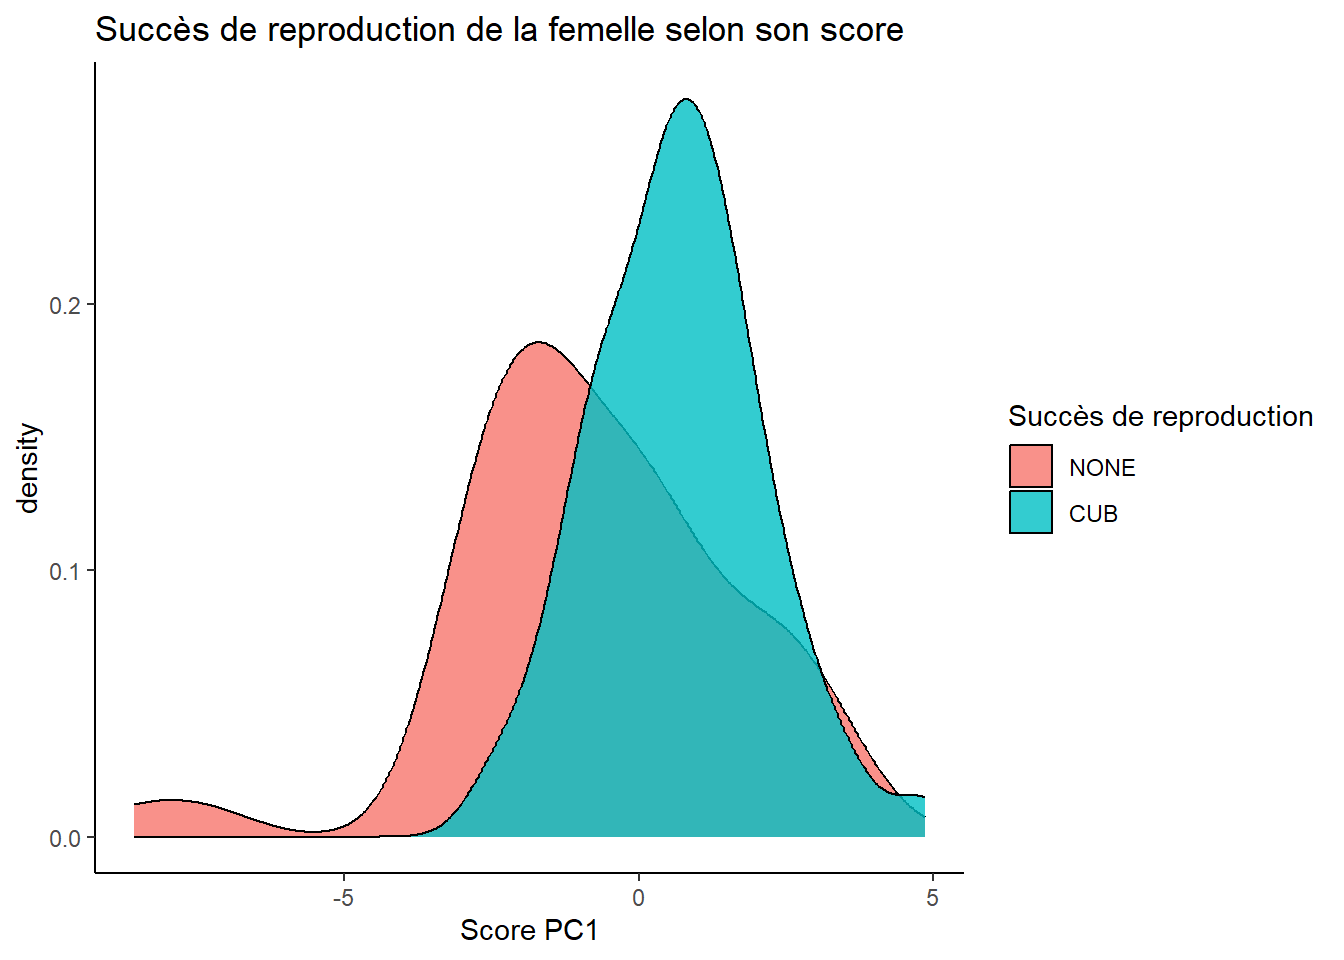
  # Nombre d'oursons
  data %>%
    filter(Age_of_Youngs == "CUB") %>%
    filter(Number_of_Youngs < 4) %>% # On les enlève car sinon on voit rien
    ggplot(aes(PCA1_Score)) +
    geom_density(aes(fill=factor(Number_of_Youngs)), alpha=0.8) +
    labs(title="Nombre d'oursons de la femelle selon son score",
         x="Score PC1",
         fill="Nombre de jeunes") +
    theme_classic()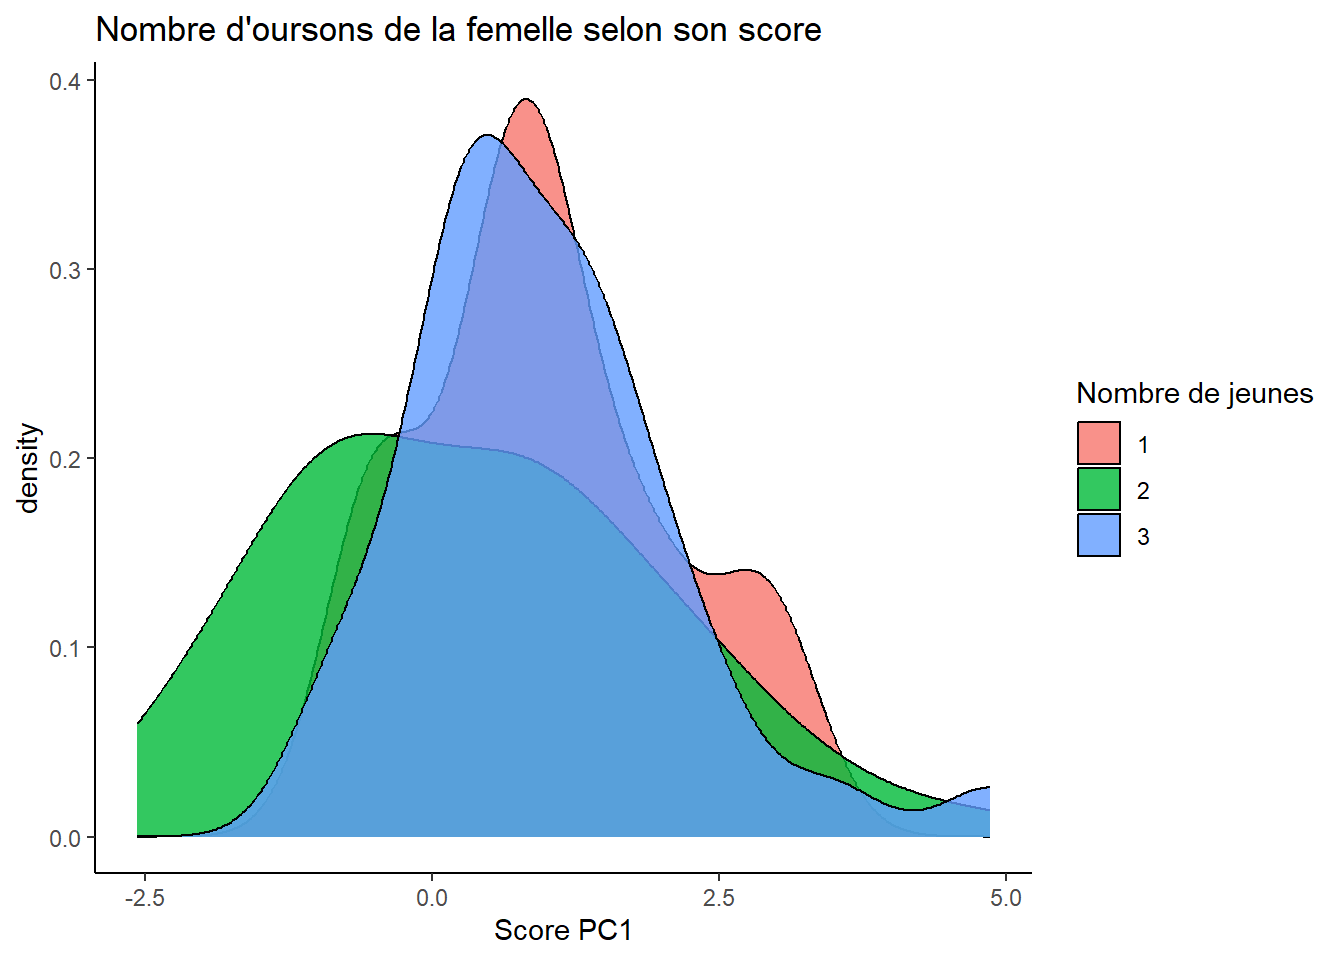
  # Masse moyenne des oursons
  data %>%
    filter(Age_of_Youngs=="CUB") %>%
    ggplot(aes(x=PCA1_Score, y=Weightx_Young_Corr_KG)) + geom_point() +
    geom_smooth(method="lm", se=T) +
    labs(y="Masse moyenne des oursons(kg)",
         x="Score PCA1 de la mère",
         title="Masse moyenne des jeunes selon l'CC de la mère") +
    stat_poly_eq() +
    theme_classic()
## `geom_smooth()` using formula = 'y ~ x'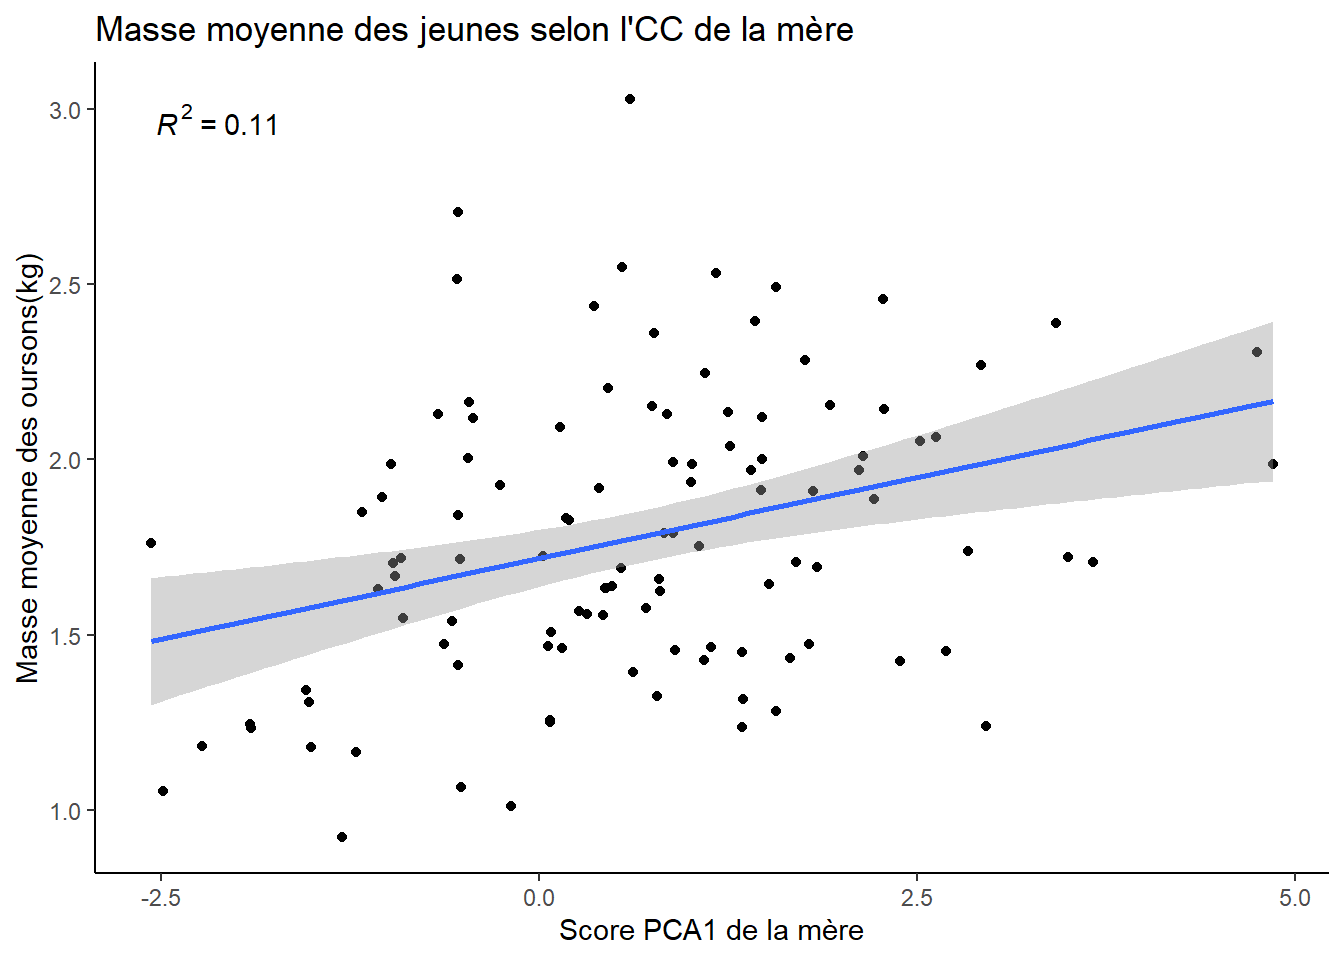
  # Survie

  # Juste ratio
  data %>%
    filter(Age_of_Youngs=="CUB") %>%
    ggplot(aes(x=PCA1_Score, y=Ratio_Survie)) + geom_point() +
    labs(y="Ratio de la survie",
         x="Score PCA1 de la mère",
         title="Proportion des jeunes qui survivent selon l'ICC de la mère") +
    theme_classic()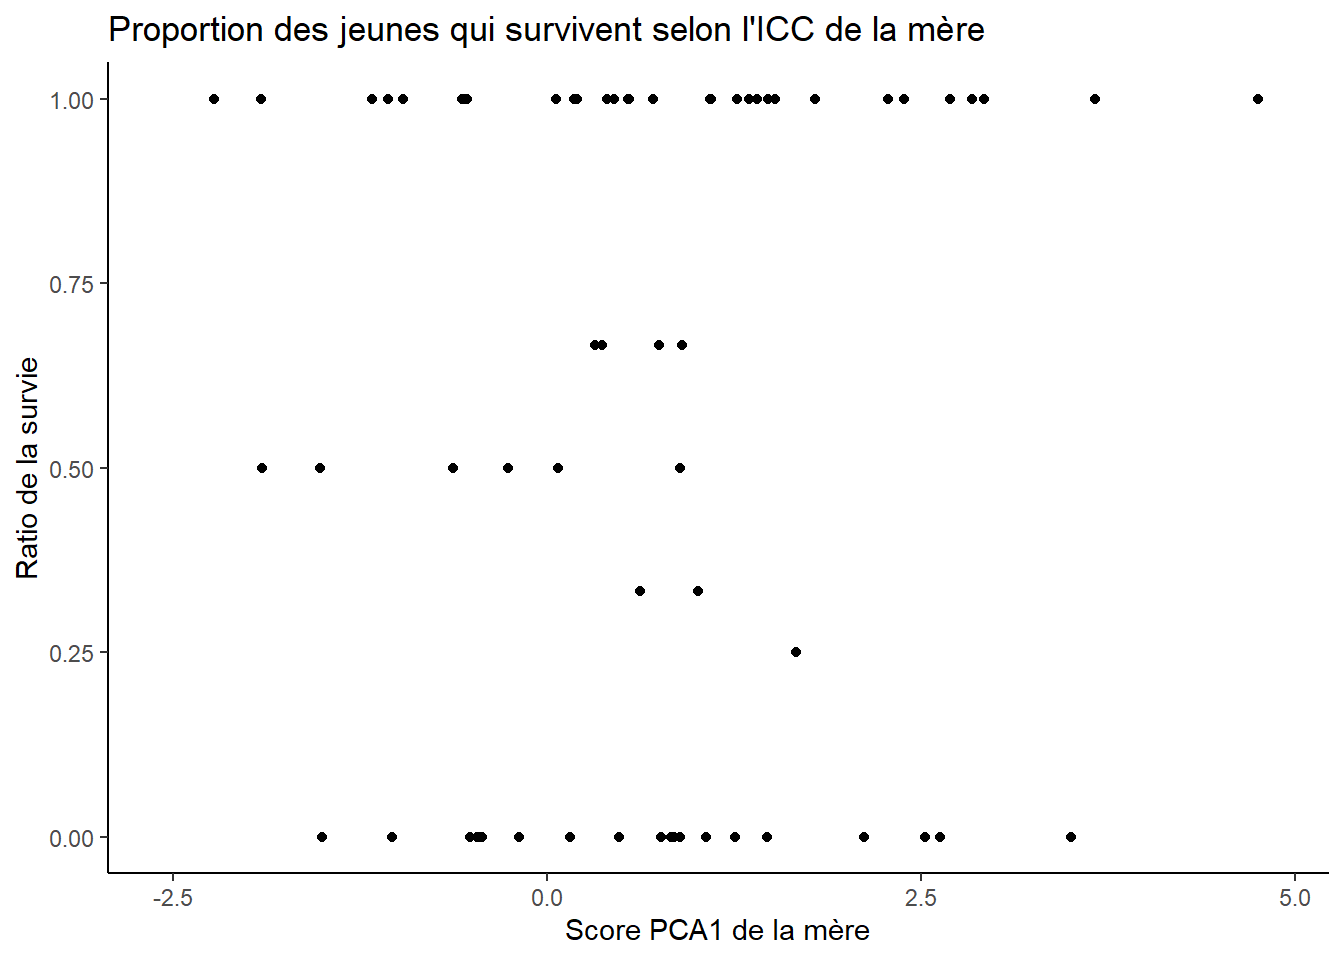
  # Nombre d'oursons qui survivent vers yearlings
  data %>%
    filter(Age_of_Youngs=="CUB") %>%
    ggplot(aes(x=PCA1_Score, y=Ratio_Survie*Number_of_Youngs)) + geom_point() +
    labs(y="Nombre d'oursons qui survivent",
         x="Score PCA1 de la mère",
         title="Nombre de jeunes qui survivent selon l'ICC de la mère") +
    theme_classic()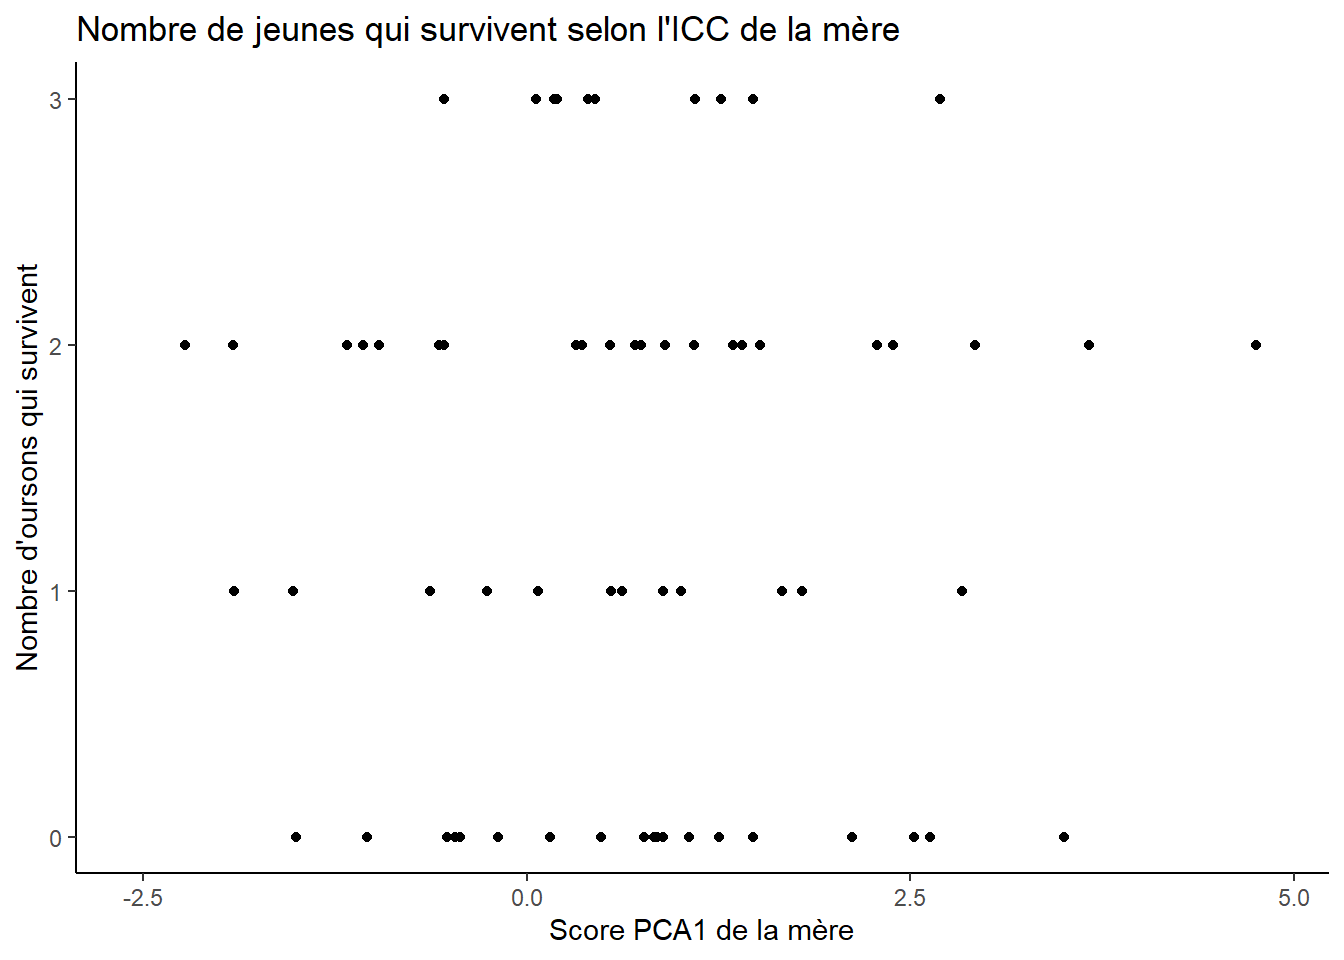
6.7 - Interactions
6.8 - Indépendance des Y
#### 6.8 - Indépendance des Y ####

# Dans cette hypothèse on ne considère que la condition physique et non le secteur/année/etc., donc les Y seraient considérés indépendants.
6.9 - Colinéarité des Y
#### 6.9 - Colinéarité des Y (si plusieurs Y) ####

# une relation entre les Y est attendue.

  data %>%
    ggplot(aes(x=Number_of_Youngs, y=Weightx_Young_Corr_KG)) +
    geom_bar(stat = "summary", position = "dodge", fun = "mean", fill = "steelblue3") +
labs(title="Masse moyenne de la portée selon le nombre de jeunes") 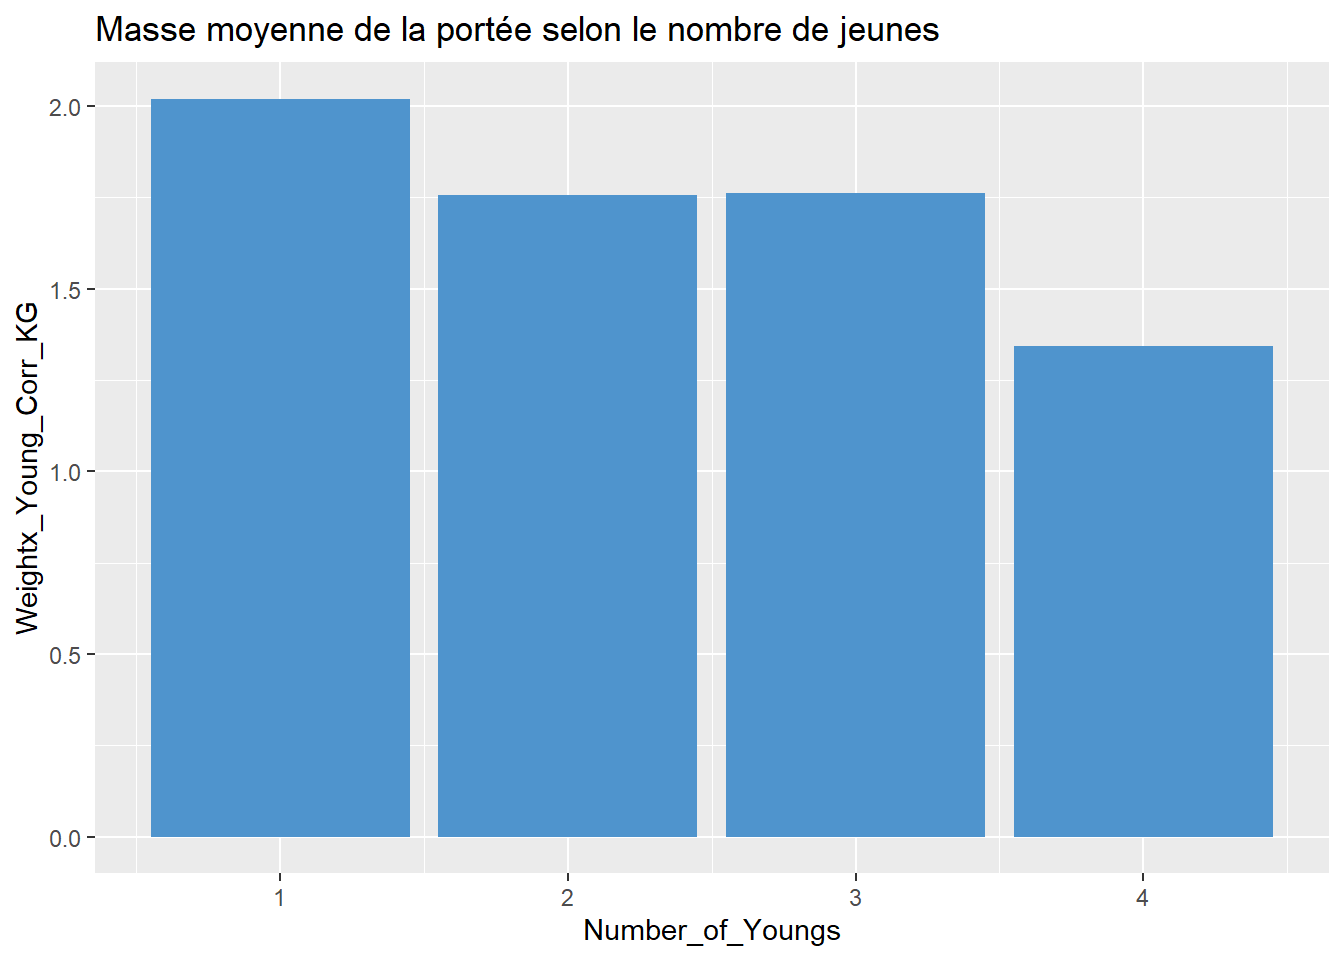
  data %>%
    ggplot(aes(x=Number_of_Youngs, y=Ratio_Survie)) +
    geom_bar(stat = "summary", position = "dodge", fun = "mean", fill = "steelblue3") +
labs(title="Ratio de survie de la portée selon le nombre de jeunes") 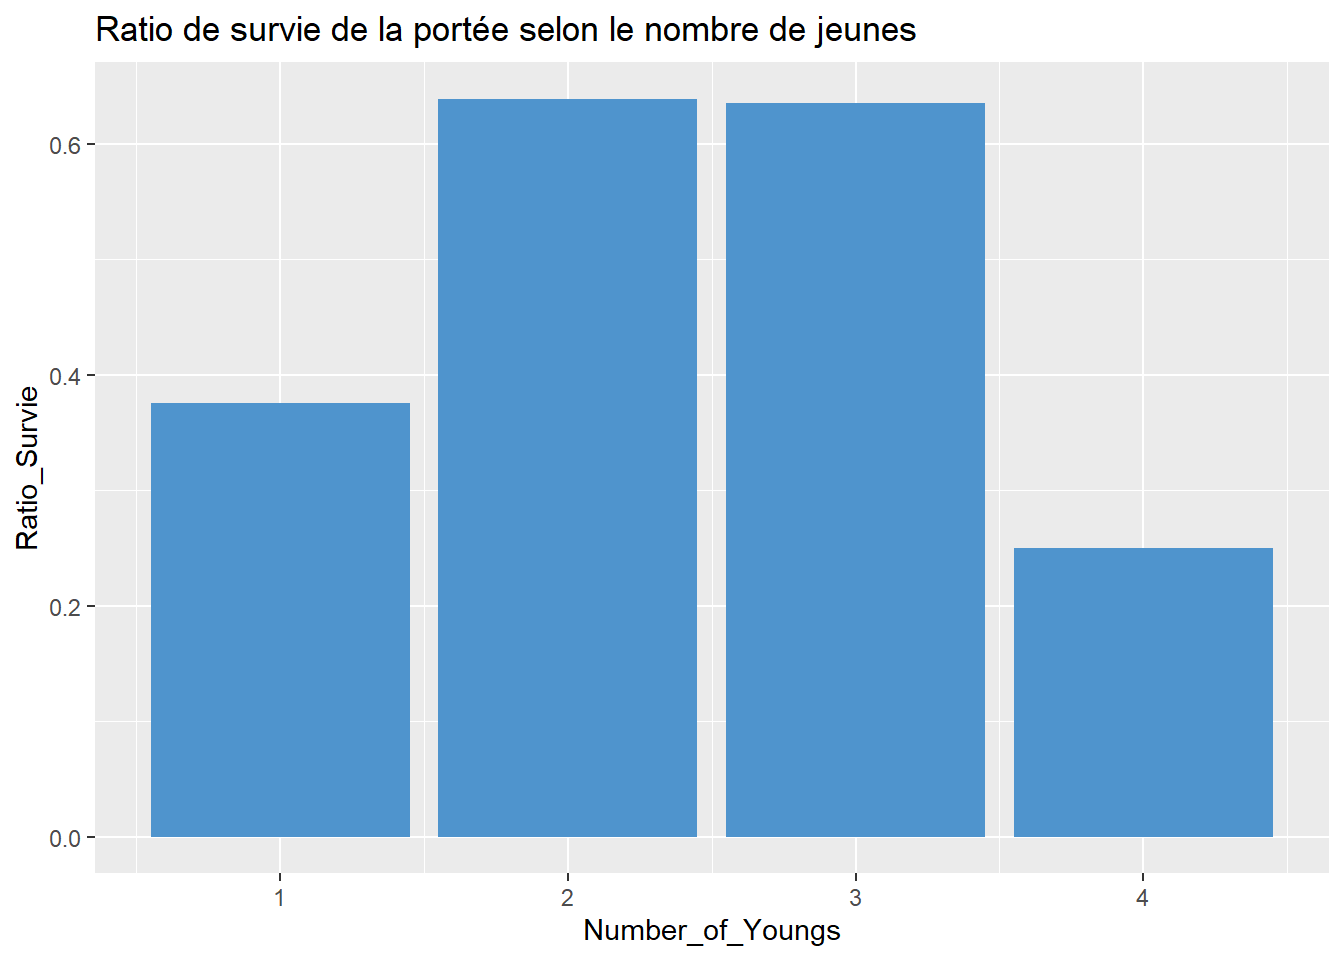
  data %>%
    ggplot(aes(x=Weightx_Young_Corr_KG, y=Ratio_Survie)) + geom_point() +
    geom_smooth(method="lm", se=T) +
    labs(title="Ratio de survie de la portée selon la masse moyenne") +
    stat_poly_eq()
## `geom_smooth()` using formula = 'y ~ x'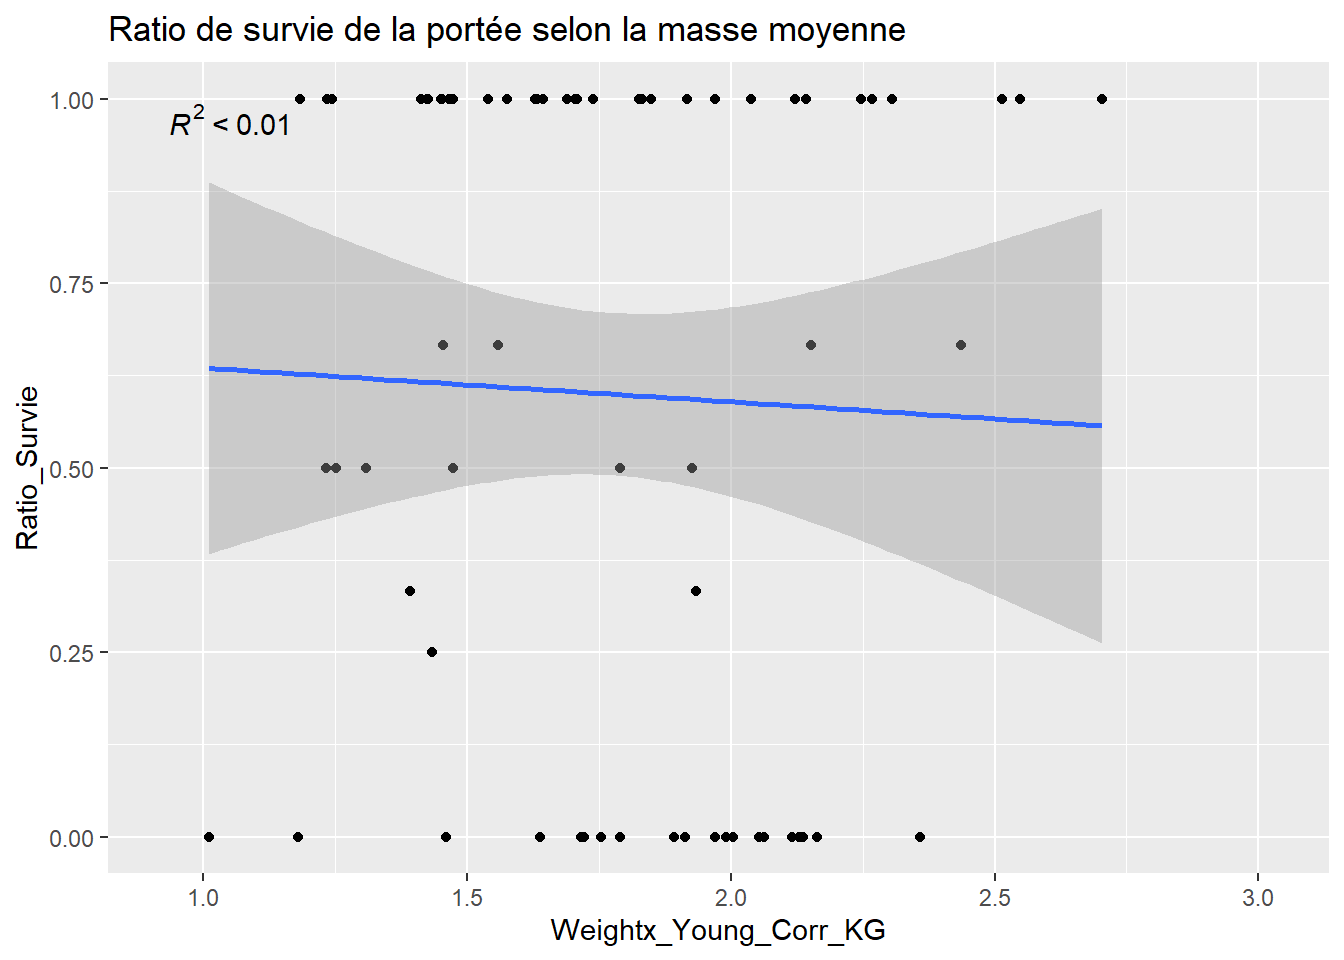
  data %>%
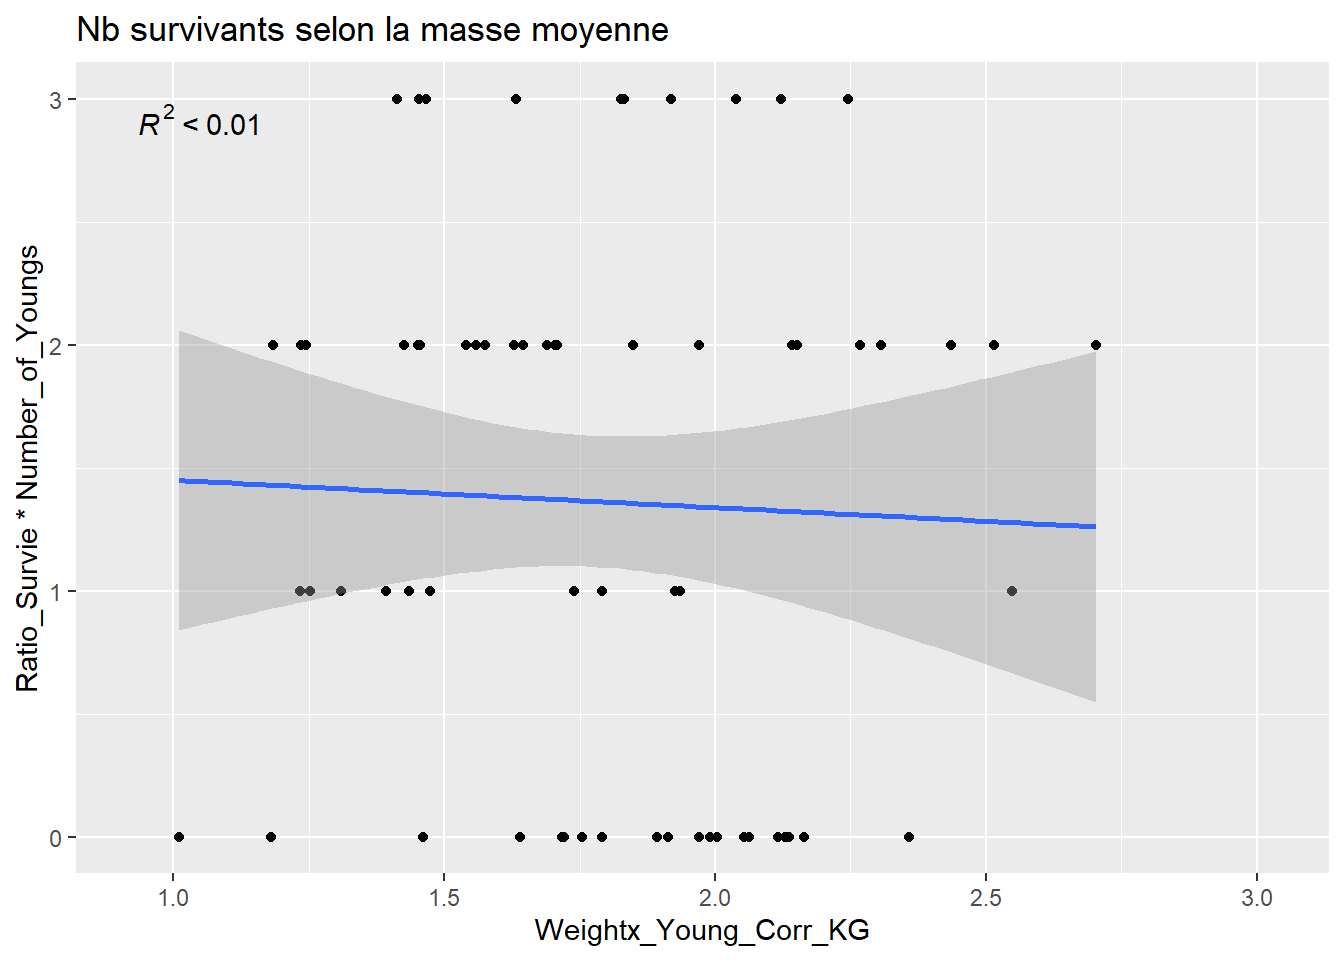
    ggplot(aes(x=Weightx_Young_Corr_KG, y=Ratio_Survie*Number_of_Youngs)) + geom_point() +
    geom_smooth(method="lm", se=T) +
    labs(title="Nb survivants selon la masse moyenne") +
    stat_poly_eq()
## `geom_smooth()` using formula = 'y ~ x'