5.2 Data quality
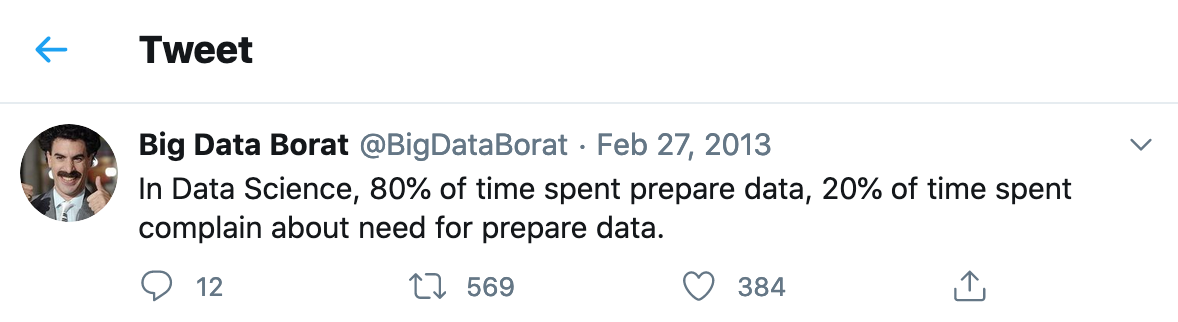
There is a longstanding saying amongst data scientists that we spend 80% of the time cleaning the data and only 20% of the time doing the analysis. Data Borat30 (see below) has an amusing take on this observation. Perhaps data scientists overclaim, nevertheless, data quality checking and cleaning is an extremely important, time-consuming and on occasions a frustrating activity.
Particularly given the title and theme of this book is Modern Data, let’s quickly see whether any actual data are available as opposed to supposition and opinion. An organsation named CrowdFlower conduct annual surveys and the 2016 report can be found here
The chart below (and taken from the CrowdFlower Report) shows that 79% (19% + 60%) of effort on average is expended on data collection and cleaning/organising. On the face of it, this indicates Data Borat may not be wide of the mark!
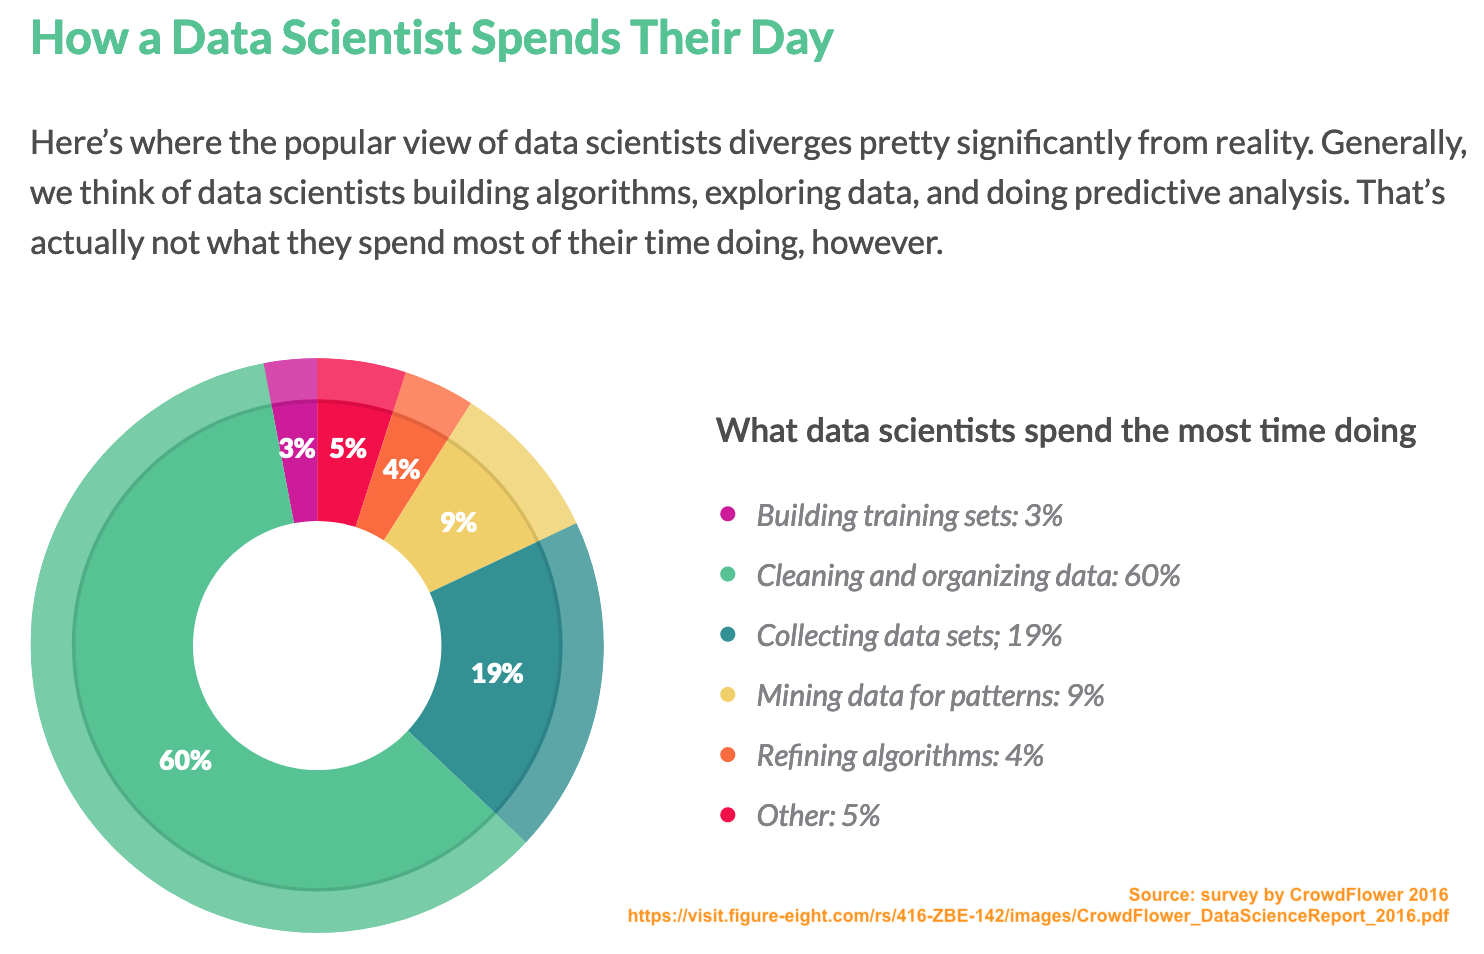
Infographic on how data scientists spend their time
However, let’s dig more deeply. Obvious questions are (1) who has been surveyed, (2) how representative is this sample of the profession as whole and (3) have there been changes since 2016? Unfortunately, the report provides no direct answers. Furthermore, there is some ambiguity as to the question being asked. Do the percentages refer to the proportion of respondents who state the activity is the most time consuming or to the (estimated) proprtion of time devoted to that activity?
As data analysts we need to be alert to these issues.
Irrespective of the validity of the data in the CrowdFlower Report, what do you think of the choice of graphics for the CrowdFlower infographic? What is your view of the use of a donut chart (i.e., a pie chart with the centre missing)?
5.2.1 Missingness
One of the more common data quality problems is missingness.
For a good overview and description of the different missingness mechanisms see (Scheffer 2002), from a pioneer of the field (Rubin 1976) and the definitive book (Little and Rubin 2002).
5.2.1.1 Dealing with missingness in R
Diff between NA, NaN etc here
A short book by (De Jonge and Van Der Loo 2013) based on R.
NB Missing values cannot be compared, even to themselves, so you can’t use comparison operators to test for the presence of missing values, e.g., numVector[4] == NA is never TRUE. You must use missing values functions such as is.na().
5.2.2 Integrity checking
5.2.3 Outlier analysis
5.2.4 Data cleaning and imputation.
For a more technical overview of imputation methods including ??? see (Pigott 2001).
References
De Jonge, Edwin, and Mark Van Der Loo. 2013. An Introduction to Data Cleaning with R. https://cran.r-project.org/doc/contrib/de_Jonge+van_der_Loo-Introduction_to_data_cleaning_with_R.pdf; Statistics Netherlands Heerlen.
Little, R. J. A., and D. B. Rubin. 2002. Statistical Analysis with Missing Data. Book. 2nd ed. New York: John Wiley & Sons.
Pigott, T. 2001. “A Review of Methods for Missing Data.” Journal Article. Educational Research and Evaluation 7 (4): 353–83.
Rubin, Donald B. 1976. “Inference and Missing Data.” Biometrika 63 (3): 581–92.
Scheffer, Judi. 2002. “Dealing with Missing Data.” In Research Letters in the Information and Mathematical Sciences, 153–60.
Borat was the eponymous (anti-)hero of the satirical comedy film of the same title. His utterances are characterised by naivety, crassness, vulgarity and sometimes unintended insight.↩︎