5.2 The central role of data quality
Most statistical theory focuses on data model[l]ing, prediction and statistical inference while it is usually assumed that data are in the correct state for data analysis.
– (De Jonge and Van Der Loo 2013)
A major theme of this book and associated course is that data quality matters, and matters a great deal. Ultimately, ingenious analysis of corrupt, biased or wrong data will not protect the data scientist from a misleading analysis and subsequent recommendations.
In contrast, data cleaning may profoundly influence a statistical analysis.
- It leads to (much) better and more trustworthy decisions.
- There are ethical, legal and corporate governance ramifications.
So we ignore data quality at our peril.
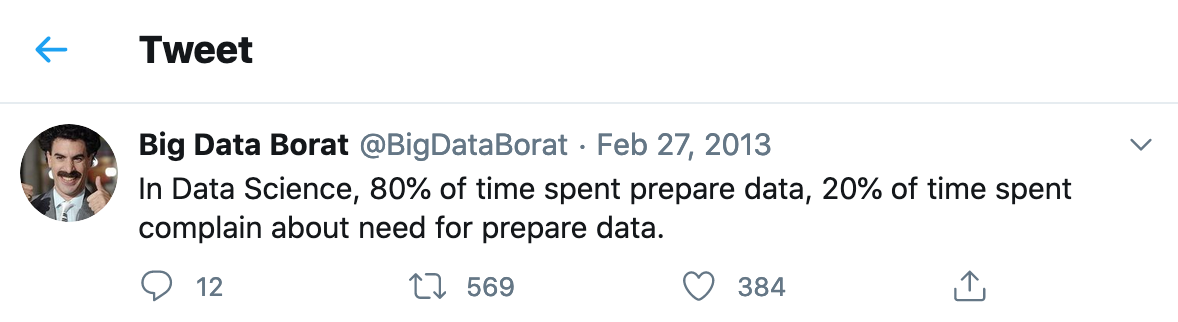
There is a longstanding saying amongst data scientists that we spend 80% of the time cleaning the data and only 20% of the time doing the analysis. Data Borat30 (see below) has an amusing take on this observation. Perhaps data scientists overclaim, nevertheless, data quality checking and cleaning is an extremely important, time-consuming and on occasions a frustrating activity.
Particularly given the title and theme of this book is Modern Data, let’s quickly see whether any actual data are available as opposed to supposition and opinion. An organsation named CrowdFlower conduct annual surveys and the 2016 report can be found here
The chart below (and taken from the CrowdFlower Report) shows that 79% (19% + 60%) of effort on average is expended on data collection and cleaning/organising. On the face of it, this indicates Data Borat may not be wide of the mark!
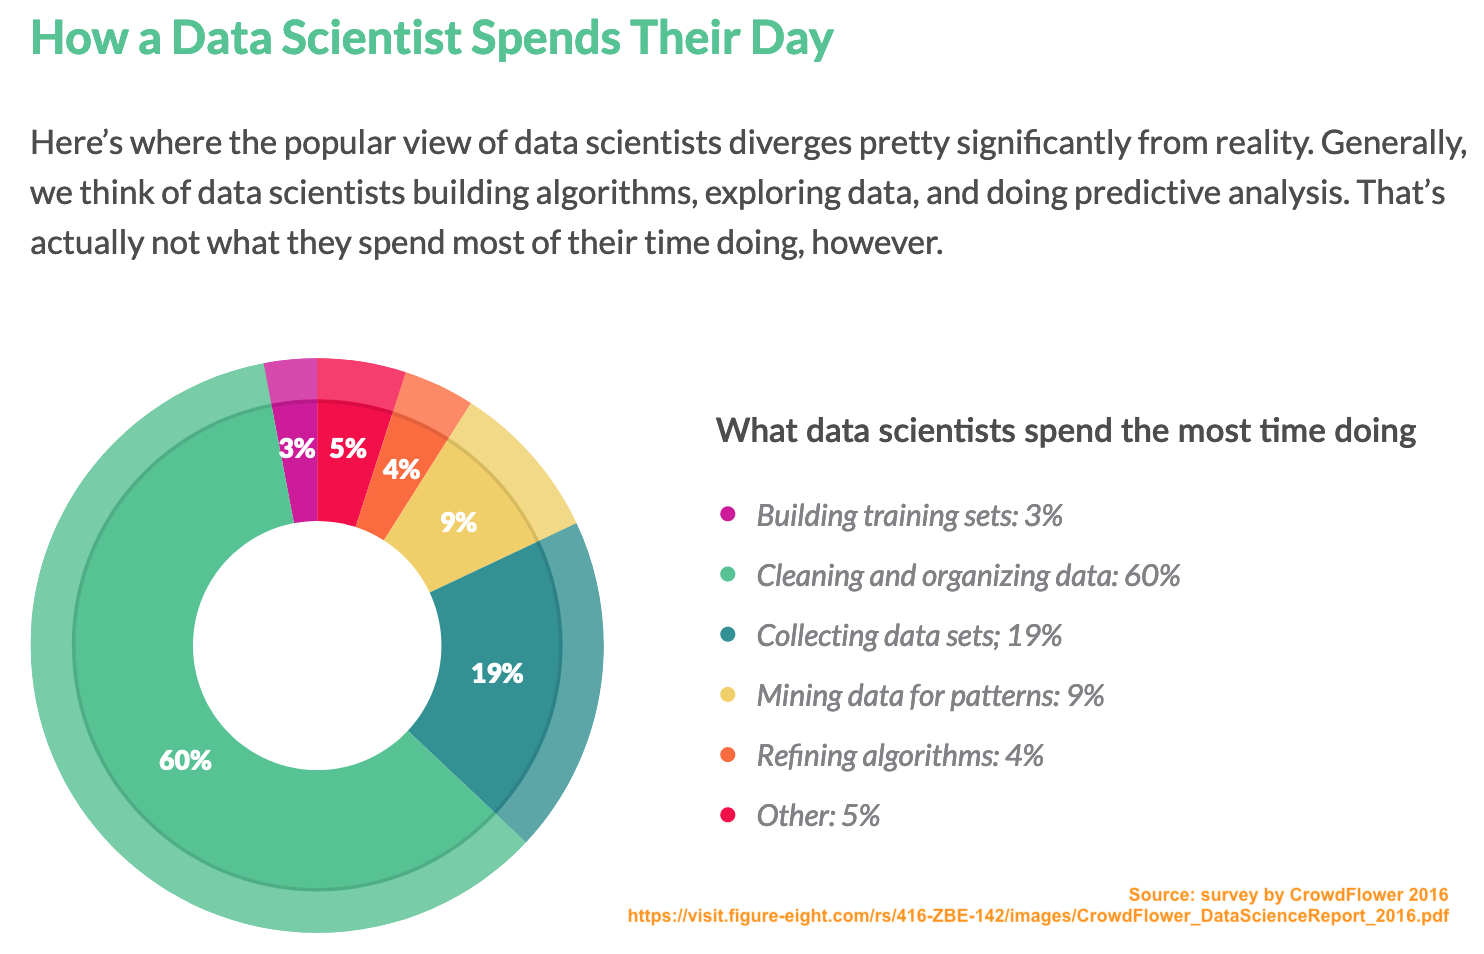
Infographic on how data scientists spend their time
However, let’s dig more deeply. Obvious questions are: (1) who has been surveyed, (2) how representative is this sample of the profession as whole and (3) have there been changes since 2016? Unfortunately, the report provides no direct answers. Furthermore, there is some ambiguity as to the question being asked. Do the percentages refer to the proportion of respondents who state the activity is the most time consuming or to the (estimated) proportion of time devoted to that activity?
As data analysts we need to be alert to these issues.
What follow up questions would you ask, to better understand the data contained in the CrowdFlower 2016 Report? How would you design a survey to answer the question “How much time do data analysts and scientists spend on quality checking and data cleaning?”.
Irrespective of the validity of the data in the CrowdFlower Report, what do you think of the choice of graphics for the CrowdFlower infographic? What is your view of the use of a donut chart (i.e., a pie chart with the centre missing)?
5.2.1 A business perspective on data quality
As an indication, KPMG surveyed 2,190 global senior executives in a “KPMG’s Guardians of Trust Report” (2018)
- “just” 35% report that they “have a high level of trust in their own organization’s analytics”
- two-thirds have “some reservations or active mistrust in their data and analytics”
Clearly there are non-trivial challenges in this area. Focusing on data quality can only be a positive contributor. For a recent review based on a systematic literature review and interviews with more than 200 practitioners see (De Medeiros, Hoppen, and Maçada 2020).
References
De Jonge, Edwin, and Mark Van Der Loo. 2013. An Introduction to Data Cleaning with R. https://cran.r-project.org/doc/contrib/de_Jonge+van_der_Loo-Introduction_to_data_cleaning_with_R.pdf; Statistics Netherlands Heerlen.
De Medeiros, Mauricius Munhoz, Norberto Hoppen, and Antonio Carlos Gastaud Maçada. 2020. “Data Science for Business: Benefits, Challenges and Opportunities.” The Bottom Line 33 (2).
Borat was the eponymous (anti-)hero of the satirical comedy film of the same title. His utterances are characterised by naivety, crassness, vulgarity and sometimes unintended insight.↩︎