Practice 15 How to Conduct Linear Regression in R
15.1 Directions
In this practice exercise, you will estimate a linear regression in R.
15.2 A closer look at the code
A random sample of 11 statistics students produced the following data, where x is the third exam score out of 80, and y is the final exam score out of 200. Can you predict the final exam score of a random student if you know the third exam score?
| x (third exam score) | y (final exam score) |
|---|---|
| 65 | 175 |
| 67 | 133 |
| 71 | 185 |
| 71 | 163 |
| 66 | 126 |
| 75 | 198 |
| 67 | 153 |
| 70 | 163 |
| 71 | 159 |
| 69 | 151 |
| 69 | 159 |
15.2.1 Scatterplot
exam.third <- c(65, 67, 71, 71, 66, 75, 67, 70, 71, 69, 69)
exam.final <- c(175, 133, 185, 163, 126, 198, 153, 163, 159, 151, 159)

plot(y=exam.final,x=exam.third)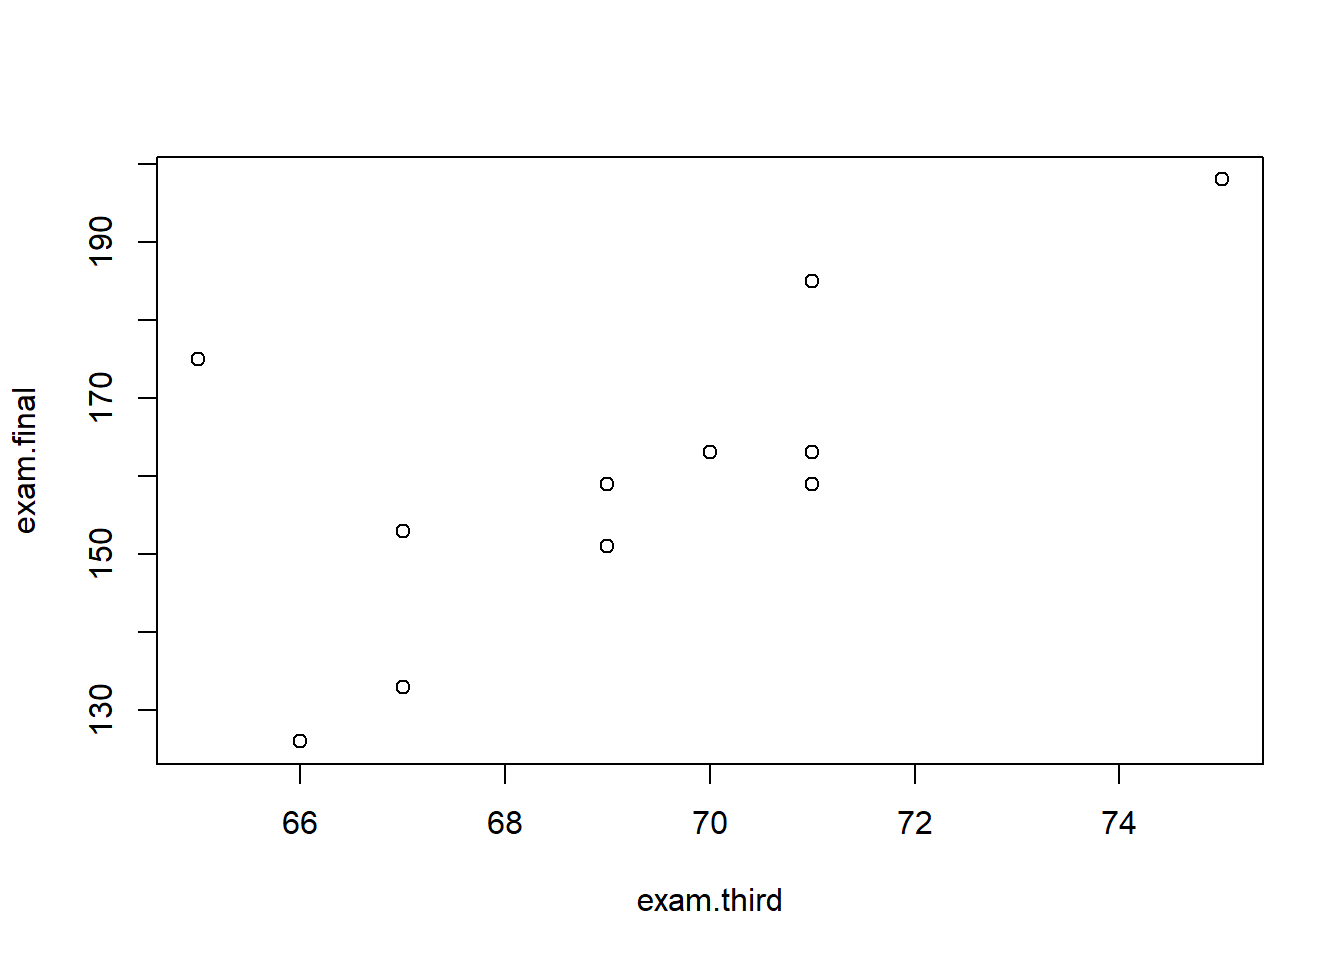
15.2.2 Summary statistics
There appears to be a linear relationship between the two variables: price and income. But we also want to consider the summary statistics.
quantile(exam.final)## 0% 25% 50% 75% 100%
## 126 152 159 169 198quantile(exam.third)## 0% 25% 50% 75% 100%
## 65 67 69 71 7515.2.3 Estimate linear regression
In r, the lm() command is used to estimate linear regression models. The “lm” stands for linear model.
exam.lm <- lm(exam.final ~ exam.third)
summary(exam.lm)
##
## Call:
## lm(formula = exam.final ~ exam.third)
##
## Residuals:
## Min 1Q Median 3Q Max
## -19.095 -9.404 -1.404 6.268 34.733
##
## Coefficients:
## Estimate Std. Error t value Pr(>|t|)
## (Intercept) -173.513 125.765 -1.380 0.2010
## exam.third 4.827 1.816 2.658 0.0262 *
## ---
## Signif. codes: 0 '***' 0.001 '**' 0.01 '*' 0.05 '.' 0.1 ' ' 1
##
## Residual standard error: 16.41 on 9 degrees of freedom
## Multiple R-squared: 0.4397, Adjusted R-squared: 0.3774
## F-statistic: 7.063 on 1 and 9 DF, p-value: 0.0261515.2.4 Scatterplot With Regression Line
plot(y=exam.final,x=exam.third)
abline(exam.lm)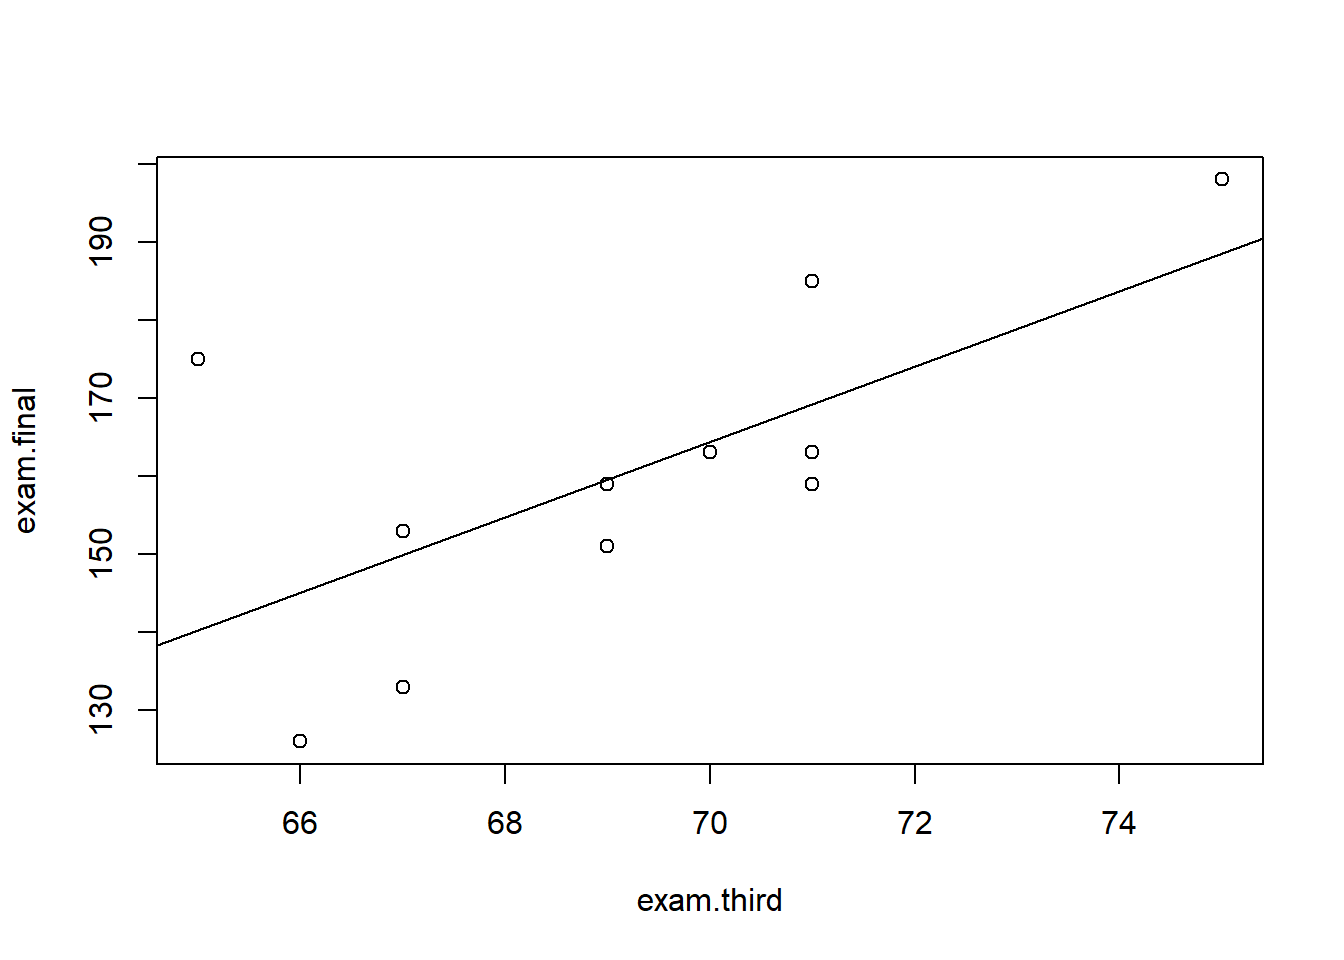
15.2.5 Residual Diagnostics
exam.lm.res = resid(exam.lm)

plot(x=exam.third,y=exam.lm.res)
abline(h=0)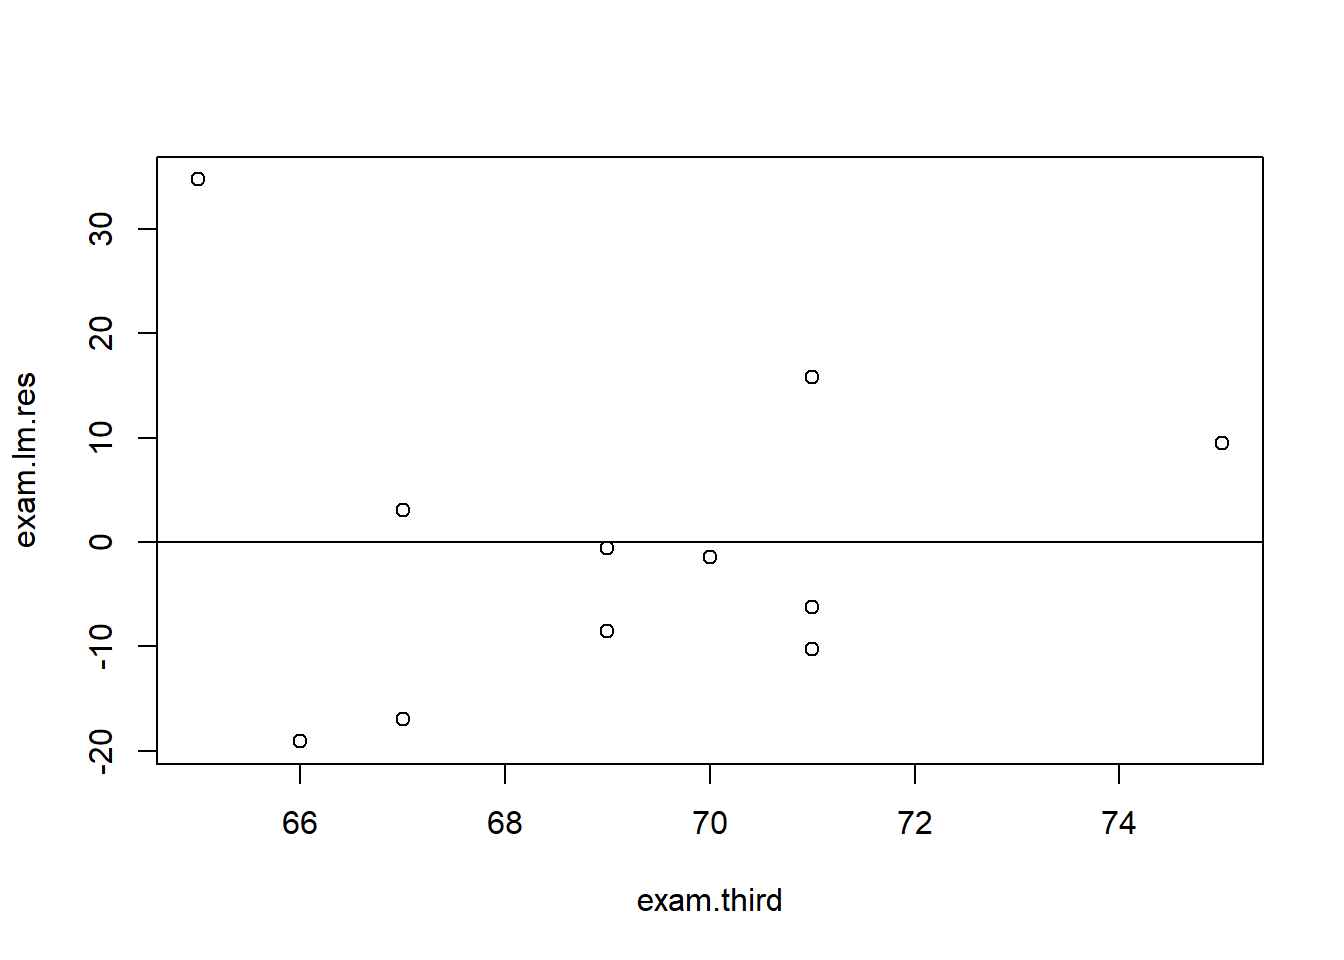
15.3 Now you try
Use R to complete the following activities (this is just for practice you do not need to turn anything in).
Use the mtcars data set to plot mpg vs hp.