第16章 ggplot2示例
16.1 柱状图示例
我们以R自带的mpg数据库为例进行作图演示。mpg数据库包含了美国环境保护署对38种汽车的观察数据,包括11个变量和234条记录。变量说明如下:
| 变量名称 | 变量说明 | 变量名称 | 变量说明 | 变量名称 | 变量说明 | ||
|---|---|---|---|---|---|---|---|
| manufacturer | 制造商 | | | model | 汽车型号 | | | displ | 发动机排量 |
| year | 生产日期 | | | cyl | 气缸数量 | | | trans | 变速器类型 |
| drv | 驱动类型 | | | cty | 每加仑城市道路英里数 | | | hwy | 每加仑高速公路英里数 |
| fl | 汽油类型 | | | class | 汽车类型 | | |
# 加载包
library(tidyverse) # 作图包
library(cowplot) # 排版包

# 加载数据
data(mpg)

# 变量转换,在调整柱状图cyl顺序时需要将x轴的变量类型转为分类变量
mpg <- mpg %>% mutate(across(c(cyl,drv,fl), as_factor))

# 关于cyl的单一柱状图
p1 <- ggplot(data = mpg, aes(x = cyl)) +
  geom_bar() +
  labs(
    title = "气缸数量柱状图",
    x = "气缸数量",
    y = "计数"
  )

# 区分drv水平的cyl柱状图
p2 <- ggplot(data = mpg, aes(x = cyl, fill = drv)) +
  geom_bar(position = position_dodge2()) +
  labs(
    title = "不同驱动水平的柱状图",
    x = "气缸数量",
    y = "计数"
  )

# 调整cyl顺序
p3 <- ggplot(data = mpg, aes(x = cyl, fill = drv)) +
  geom_bar(position = position_dodge2()) +
  scale_x_discrete(limits = c("5","4","6","8")) +
  labs(
    title = "气缸数量顺序调整的柱状图",
    x = "气缸数量",
    y = "计数"
  )

# 插入文本
p4 <- mpg %>%
  group_by(cyl,drv) %>%
  summarise(count = n(), .groups = "drop") %>%
  ggplot(aes(cyl, count)) +
  geom_col( # geom_bar多用于单变量的柱状图计数,geom_col多用于两个变量的柱状图
    aes(fill = drv),
    position = position_dodge2(preserve = "single") # 柱子宽度默认为 0.9,如果不设置 preserve = 'single',则宽度为整个分组的宽度
  ) +
  geom_text(
    aes(label = count), # 映射对象,即文本内容
    position = position_dodge2(width = 0.9, preserve = "single"), # 文本宽度和位置需要与geom_col中的设定一致
    vjust = -0.2, # 垂直上调
    hjust = 0.5 # 水平调整
  ) +
  labs(
    title="插入计数文本",
    x = "气缸数量",
    y = "计数"
  )

plot_grid(p1, p2, p3, p4, nrow = 2)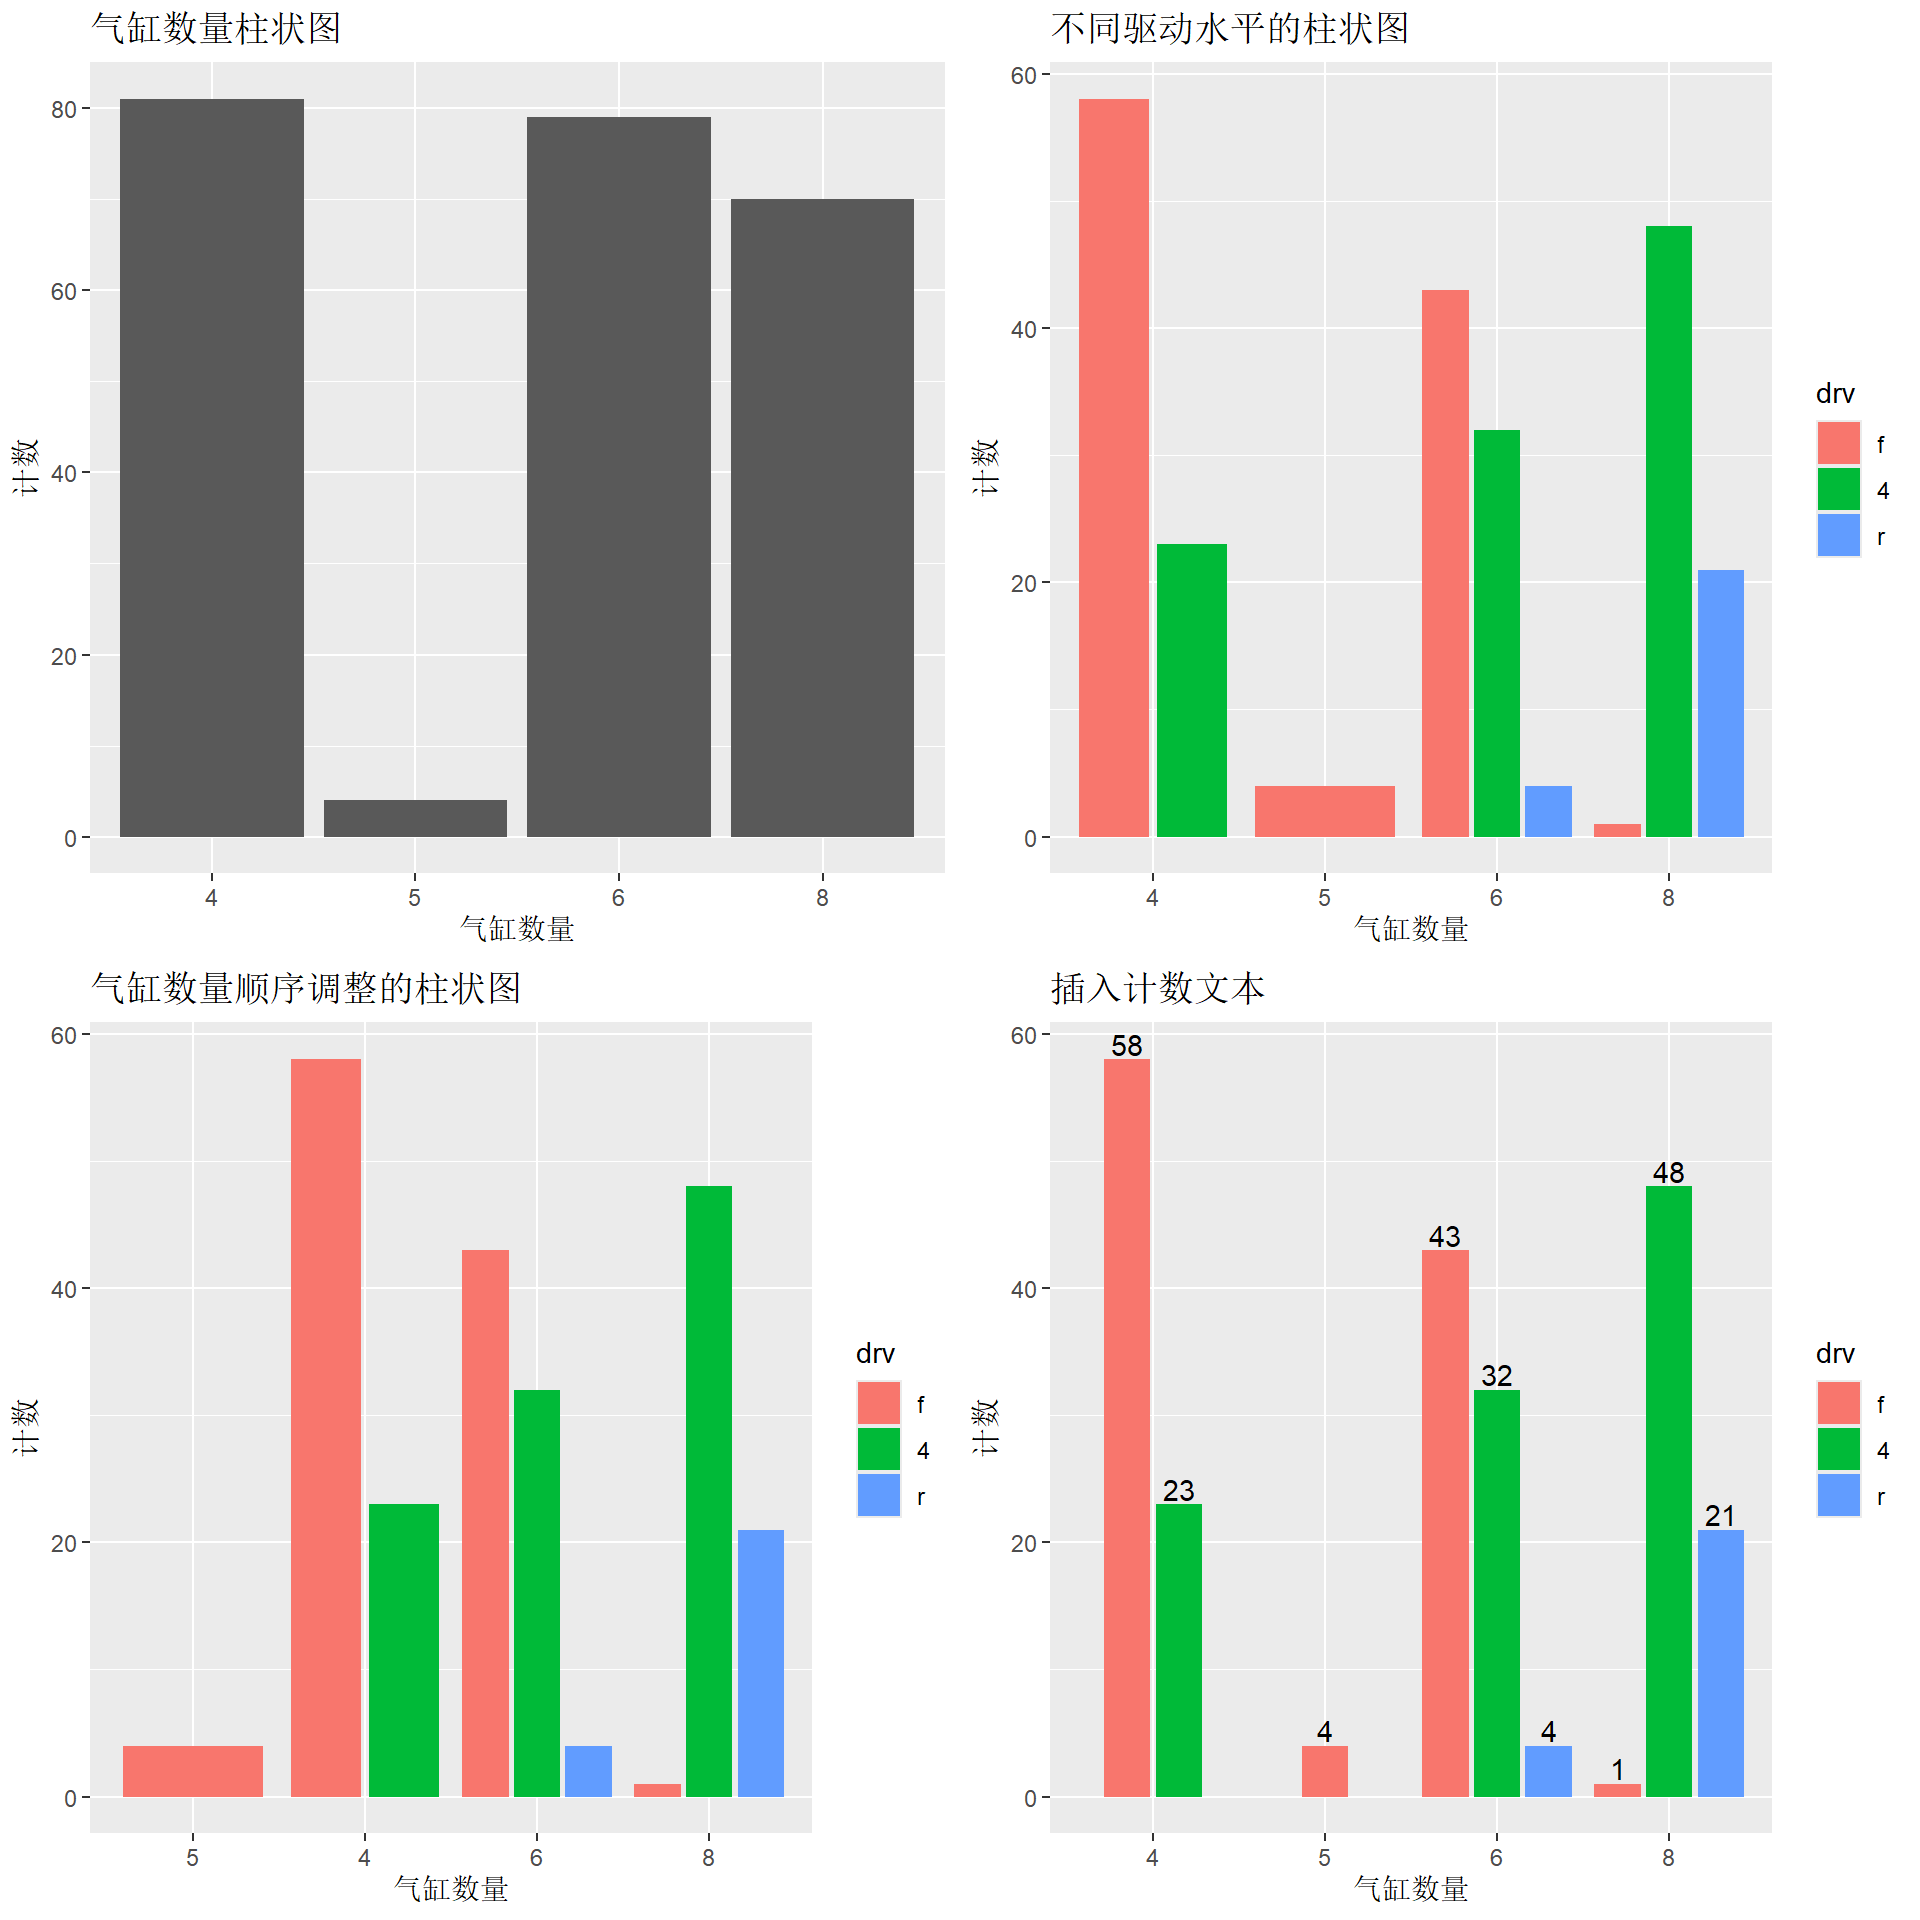
16.2 散点图示例
我们继续以R自带的mpg数据库为例进行作图演示。
# cty-hwy的单一散点图
p1 <- ggplot(data = mpg, aes(x = cty, y = hwy)) +
  geom_point() +
  labs(title = "单一散点图")

# 区分drv水平的cty-hwy散点图
p2 <- ggplot(data = mpg, aes(x = cty, y = hwy, color = drv)) +
  geom_point() +
  labs(title = "不同drv水平的散点图")

# 图例调整
p3 <- ggplot(data = mpg, aes(x = cty, y = hwy, color = drv)) +
  geom_point() +
  scale_color_discrete( # 调整图例
    name = "drive", # 声明图例标题
    breaks = c("f", "r", "4"), # 声明图例元素
    labels = c("front wheel drive", "rear wheel drive", "4 wheel drive") #声明图例元素标签
  ) +
  theme(
    legend.position = c(0.1,0.95), # 设置图例位置 设为"top""bottom"等字符时位于图外,设为两个数字的向量时位于图内
    legend.justification = c(0,1) # 设置图例锚点
  ) +
  labs(title = "图例调整的散点图")

# 增加趋势线
p4 <- ggplot(data = mpg, aes(x = cty, y = hwy, color = factor(drv))) +
  geom_point() +
  geom_smooth(method = "lm", formula = "y~x") +
  scale_color_discrete(
    name = "drive",
    breaks = c("f", "r", "4"),
    labels = c("front wheel drive", "rear wheel drive", "4 wheel drive")
  ) +
  theme(
    legend.position = c(0.1,0.95)
  ) +
  labs(title = "增加趋势线的散点图")

plot_grid(p1, p2, p3, p4, nrow = 2)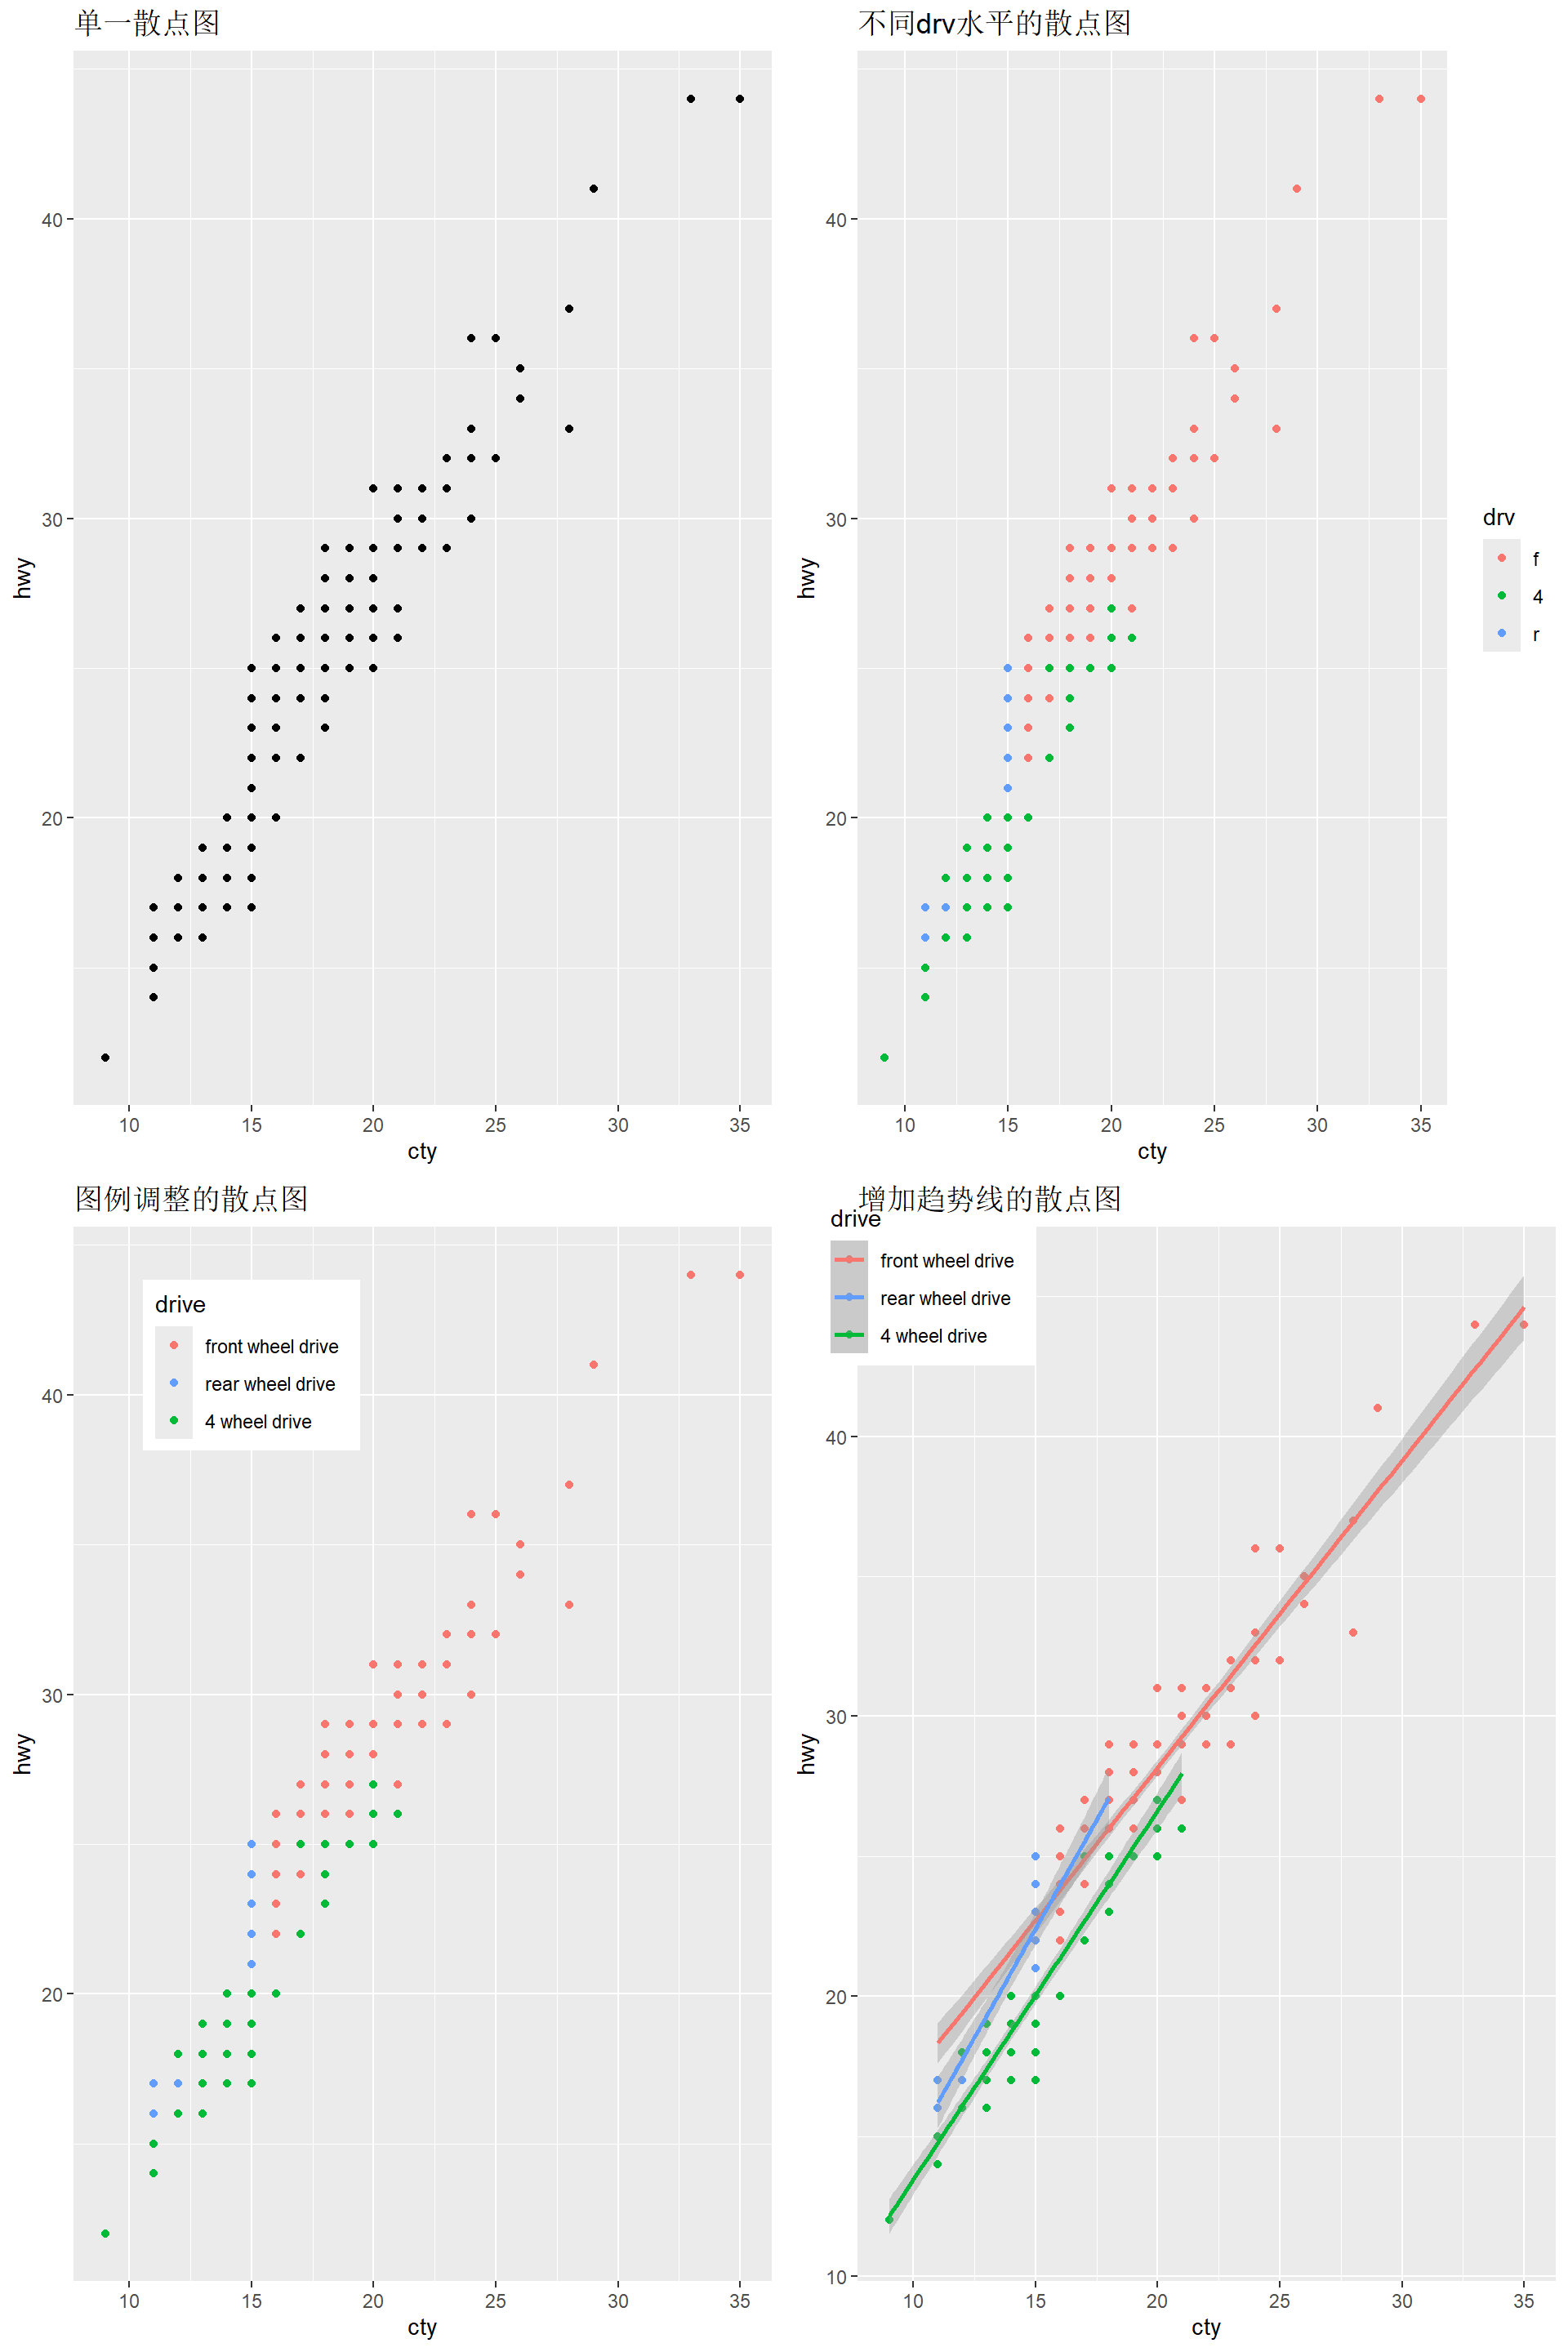
16.3 多个数据框作图
当我们需要将多个数据框做成一张图时,可以在geom_*()函数中分别使用data=<DATA>声明需要作图的数据框。
# 创建两个数据框
bmi_df1 <- data.frame(
  day = 1:6,
  bmi = c(23, 24, 25, 24.5, 25, 25.5)
)

bmi_df2 <- data.frame(
  day = 1:6,
  bmi = c(24, 24, 23, 23.5, 22, 23.5)
)

ggplot() + # 声明作图
  geom_line(
    data = bmi_df1, # 设置数据框
    mapping = aes(x=day, y=bmi, color="数据框1"), # 设置映射元素
    size = 1.5 # 设置线条粗细
  ) +
  geom_line(
    data = bmi_df2, # 设置数据框
    mapping = aes(x=day, y=bmi, color="数据框2"), # 设置映射元素
    size = 1.5 # 设置线条粗细
  ) +
  scale_color_manual(
    name = "数据框", #声明图例标题
    breaks = c("数据框1", "数据框2"), # 声明图例元素
    values = c("#80c97f","#a68dc8") # 声明图例元素对应颜色
  ) +
  scale_x_continuous(breaks=1:6) + # 设置x轴刻度
  scale_y_continuous(breaks=seq(21.5, 26, 0.5)) + # 设置y轴刻度
  theme_classic() + # 选择theme_classic主题
  theme(
    legend.position = c(0.1, 0.95),
    legend.title = element_blank(),
    legend.background = element_rect(color = "black") # 给图例添加黑边框
  )
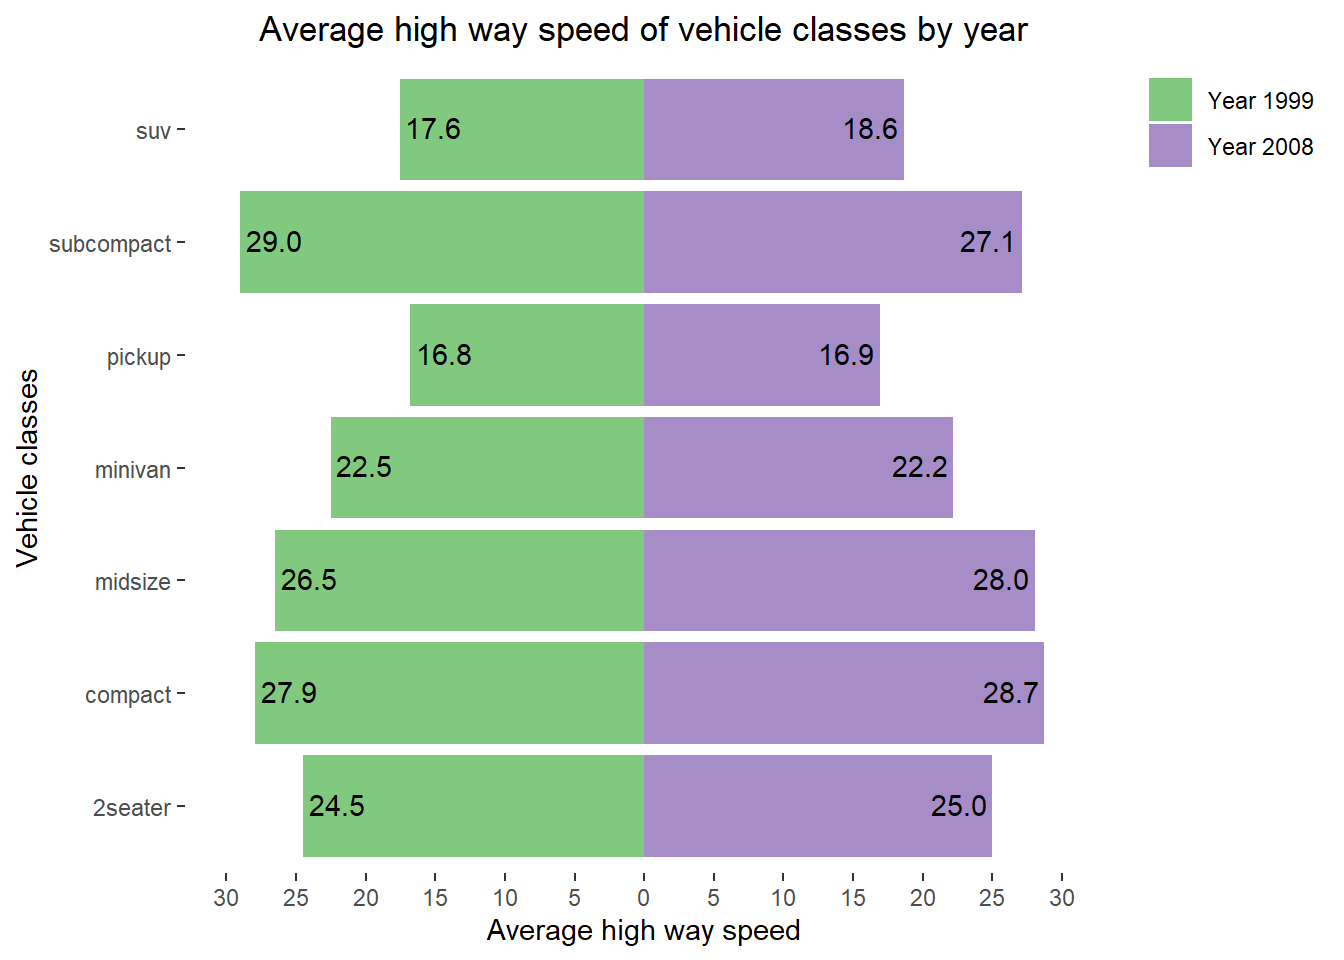
16.4 双向柱状图
# 加载数据框
data(mpg)

# 创建仅包含1999年hwy均值数据的数据框
hwy_df1 <- mpg %>%
  filter(year==1999) %>%
  group_by(class) %>%
  summarise(mean_hwy = -mean(hwy)) %>% # 将hwy均值取负数,以便反向做柱状图
  select(class, mean_hwy)

# 创建仅包含2008年hwy均值数据的数据框
hwy_df2 <- mpg %>%
  filter(year==2008) %>%
  group_by(class) %>%
  summarise(mean_hwy = mean(hwy)) %>%
  select(class, mean_hwy)

ggplot() +
  geom_col(
    data = hwy_df1, # 设置数据框
    mapping = aes(x = class, y = mean_hwy, fill = "Year 1999") # 设置映射元素
  ) +
  geom_text(
    data = hwy_df1,
    mapping = aes(
      x = class,
      y = mean_hwy,
      label = sprintf("%0.1f", round(abs(mean_hwy), digits = 1)) # 设置文本内容为精确到小数点后一位
    ),
    position = position_dodge2(width = 0.9, preserve = "single"), # 文本宽度和位置需要与geom_col中的设定一致
    vjust = 0.4, # 垂直下调
    hjust = -0.1 # 水平调整
  ) +
  geom_col(
    data = hwy_df2, # 设置数据框
    mapping = aes(class, mean_hwy, fill = "Year 2008") # 设置映射元素
  ) +
  geom_text(
    data = hwy_df2,
    mapping = aes(
      x = class,
      y = mean_hwy,
      label = sprintf("%0.1f", round(mean_hwy, digits = 1)) # 设置文本内容为精确到小数点后一位
    ),
    position = position_dodge2(width = 0.9, preserve = "single"), # 文本宽度和位置需要与geom_col中的设定一致
    vjust = 0.4, # 垂直下调
    hjust = 1.1 # 水平调整
  ) +
  scale_fill_manual(
    name = "Year", #声明图例标题
    breaks = c("Year 1999", "Year 2008"), # 声明图例元素
    values = c("#80c97f","#a68dc8") # 声明图例元素对应颜色
  ) +
  scale_y_continuous(
    breaks = seq(-30,30,5), # 设置y轴刻度分隔
    limits = c(-30, 30), # 设置y轴最大、最小值
    labels = abs(seq(-30,30,5)) # 设置y轴刻度
  ) +
  labs(
    title = "Average high way speed of vehicle classes by year",
    x = "Vehicle classes",
    y = "Average high way speed"
  ) +
  coord_flip() + # 坐标轴翻转
  theme(
    legend.position = "right", # 设置图例位置为"right"
    legend.justification = "top", # 设置图例锚点为"top"
    legend.title = element_blank(), # 移除图例标题
    panel.grid = element_blank(), # 移除网格
    panel.background = element_blank(), # 移除背景
    plot.title = element_text(hjust = 0.5) # 标题居中
  )
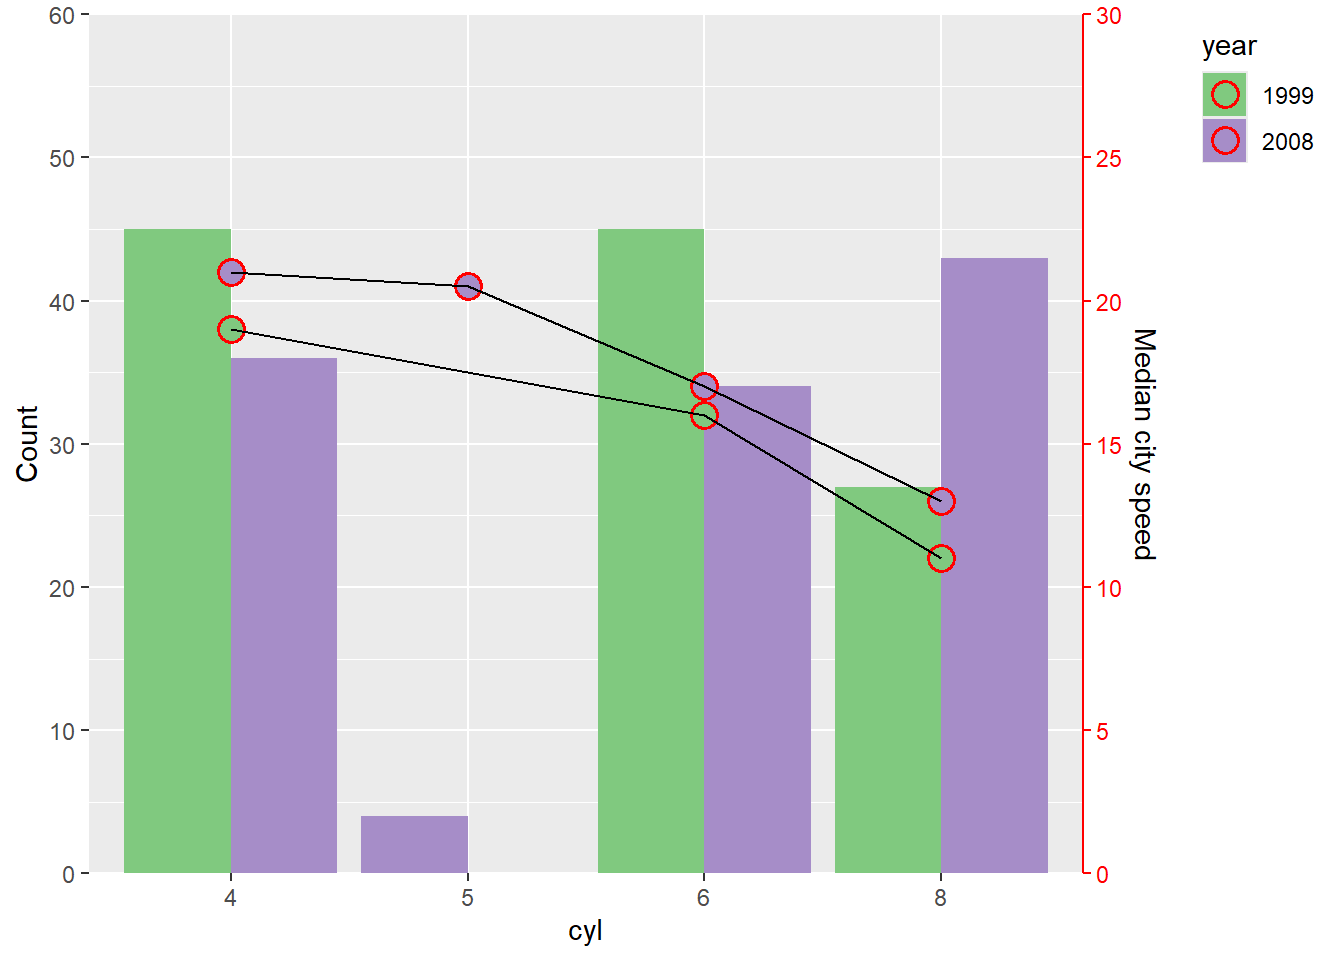
16.5 双y轴图
# 加载数据框
data(mpg)

# 以cyl和year分组,分别计算不同cyl的计数以及cty的中位数
mpg %>%
  mutate(year = as.factor(year)) %>%
  group_by(cyl, year) %>%
  summarise(
    count = n(),
    median_cty = median(cty)
  ) %>%
  ggplot() + # 开始绘图
  geom_col( #绘制柱状图
    aes(x = cyl, y = count, fill = year),
    position = position_dodge(preserve = "single") # 将柱子设为紧凑型
  ) +
  scale_fill_manual(
    values = c("#80c97f","#a68dc8") # 设置第一批数据year的颜色
  ) +
  geom_point(
    aes(
      x = cyl,
      y = median_cty*2, # 由于要把两批数据放在同一个图中,所以需要按照比例缩放数据
      fill = year
    ),
    shape = 21, # 选择第21种散点类型,即有边框的点
    size = 4, # 设置散点大小
    color = "red", # 设置散点边框颜色
    stroke = 1 # 设置散点边框大小
  ) +
  geom_line(
    aes(
      x = cyl,
      y = median_cty*2, # 由于要把两批数据放在同一个图中,所以需要按照比例缩放数据
      group = year # 以year分组,分别画线
    ),
    color = "black" # 将点以黑线连接
  ) +
  scale_color_manual(
    values = c("#80c97f","#a68dc8") # 设置第二批数据year的颜色
  ) +
  scale_y_continuous(
    name = "Count", # 设置左侧y轴标题
    expand = c(0,0), # 不进行y轴拓展
    limits = c(0,60), # 设置左侧y轴范围
    breaks = seq(0,60,10), # 设置左侧y轴截断点
    sec.axis = sec_axis( # 设置右侧y轴
      transform = ~./2, # 由于作图时数据都扩大了2倍,y轴刻度呈现时需要缩小对应的倍数
      name = "Median city speed", # 设置右侧y轴标题
      breaks = seq(0,30,5) # 设置右侧y轴截断点
    )
  ) +
  theme(
    axis.line.y.right = element_line(color = "red"), # 设置右侧y轴颜色
    axis.text.y.right = element_text(color = "red"),  # 设置右侧y轴标尺值颜色
    axis.ticks.y.right = element_line(color = "red"),  # 设置右侧y轴标尺颜色
    legend.position = "right", # 设置图例位置为"right"
    legend.justification = "top", # 设置图例锚点为"top"
  )
16.6 棒棒糖图与哑铃图
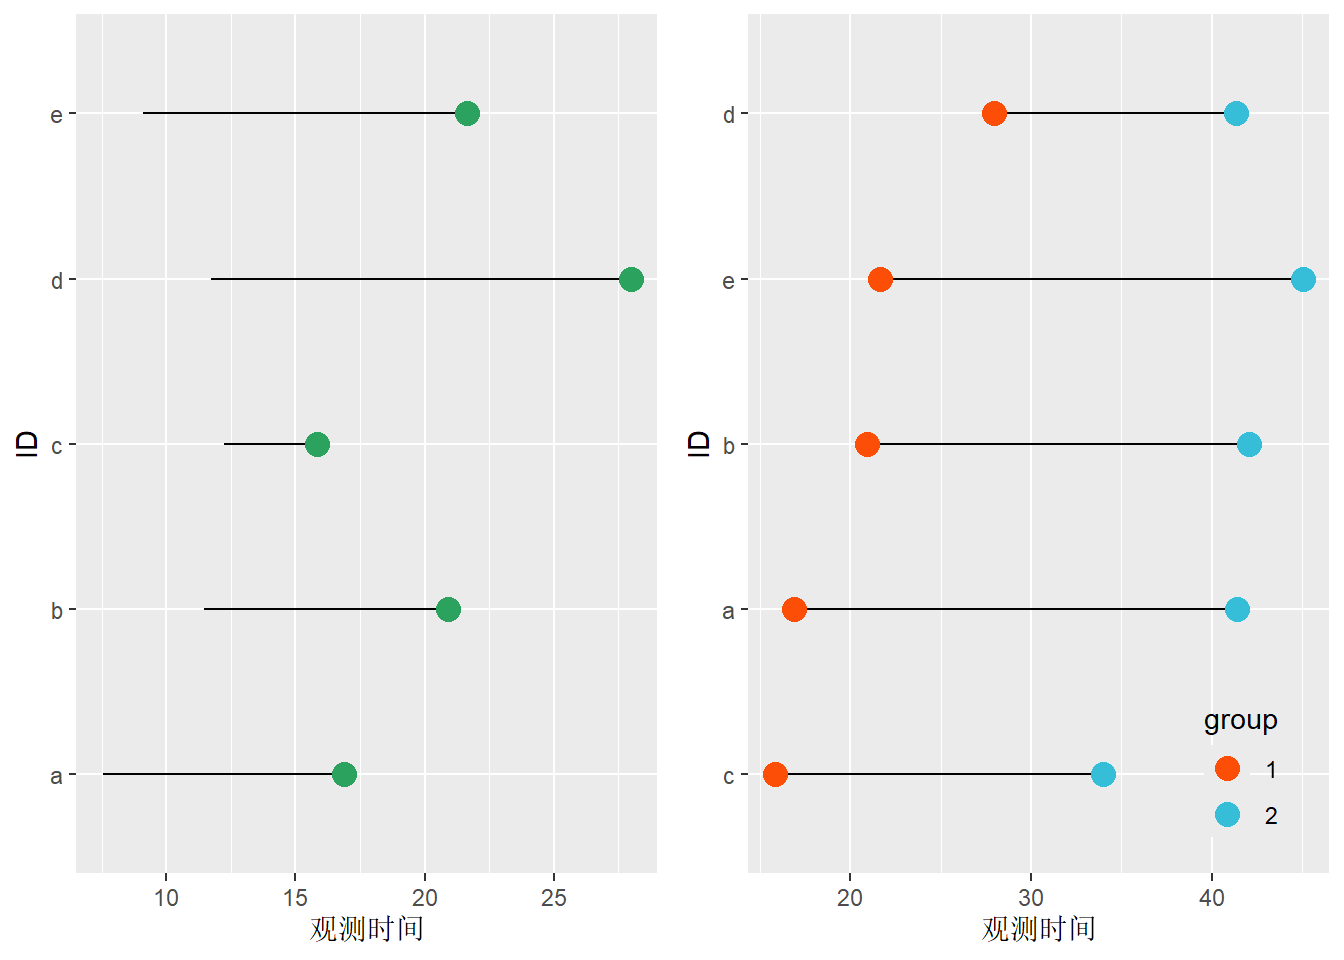
在展示生存分析数据时,我们有时会用到由一根细线和一个点组成的棒棒糖图。如果将线的两端用点标记出来,则能组成哑铃图。
set.seed(1)
# 生成棒棒糖图数据框
df_1 <- data.frame(
  ID = letters[1:5],
  time_start = rnorm(n=5, mean=20, sd=5), # 设置起始观测时间
  time_obs = rnorm(n=5, mean=10, sd=3), # 设置观测窗口期
  group = 1
)

df_2 <- df_1 %>%
  mutate(
    time_start = time_start + rnorm(n=5, mean=20, sd=3),
    time_obs = time_obs + rnorm(n=5, mean=10, sd=2),
    group = 2
  )

df <- rbind(df_1, df_2)
df$group <- as.factor(df$group)

p1 <- ggplot(
    data = df_1,
    aes(x=time_start, y=ID)
  ) +
  geom_segment(
    aes(x=time_start, xend=time_obs, y=ID, yend=ID) # 作出起止线段
  ) +
  geom_point(
    shape=16, size=4, color="#2ca25f" # 设置散点类型
  ) +
  labs(x = "观测时间")

p2 <- ggplot(
  data = df,
  aes(
    x = time_start,
    y = reorder(ID, time_start), # 将y轴标尺(ID)依照time_start进行排列
    color = group) # 设置散点以group的形式标注颜色
  ) +
  geom_line(aes(group = reorder(ID, time_start)), color="black") + # 将散点以个ID组的形式连接
  geom_point(shape=16, size=4) + # 设置散点类型
  labs(y="ID", x="观测时间") +
  scale_color_manual(values=c("#FC4E07","#36BED9"))+ # 设置散点颜色
  theme(
    legend.background = element_blank(), # 清除图例背景色
    legend.position = c(0.85,0.12) # 设置图例位置
  )

plot_grid(p1, p2)