Chapter 3 高阶验证性因素分析
对于测量模型,如果研究者认为潜在因素之上还有更高阶的潜在因素,那么此测量模型就被称为阶层测量模型(hierarchical measurement model, HCFA)。
决定使用阶层测量模型的原因可以有两种。一是理论导向,即从理论层面认为可能存在这样一些更高阶的因子;二是经验导向,即在CFA中发现某些因子具有高度相关性。
注意,基于模型识别的原则,形成高阶因素的初阶因素的数目不能低于\(3\)。
library(tidyverse)
library(lavaan)
library(modelsummary)
library(semPlot)
3.1 模型界定
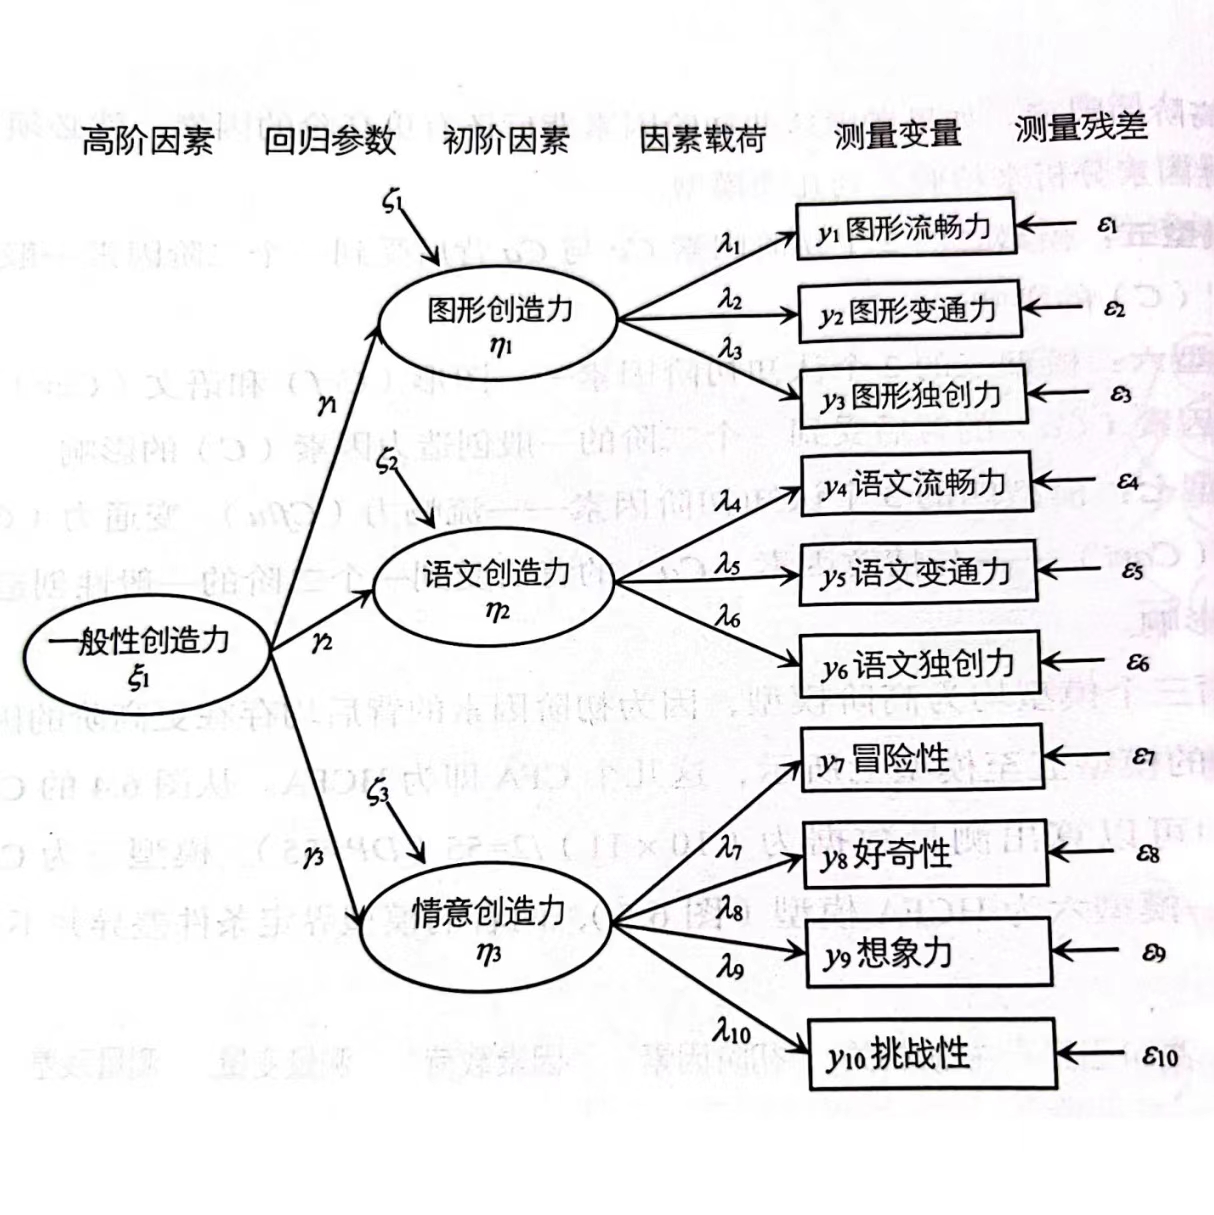
该HCFA的基本结构如图3.1所示

Figure 3.1: HCFA模型的假设模型路径
由于有\(10\)个外生变量,该模型的测量数据数为\(10 \times11 / 2 = 55\)。
该模型有\(23\)个参数需要估计,分别为:
- 观测变量的测量误差方差\(10\)个。
- 初阶因素的载荷\(10 - 3 = 7\)个,其中三个被约束用来确定因子量纲。
- 初阶因素未被高阶因素解释的部分的方差\(3\)个。
- 高阶因素对于初阶因素的回归系数\(3\)个。
- 高阶因素的方差\(1-1=0\)个,因为被设定为1。
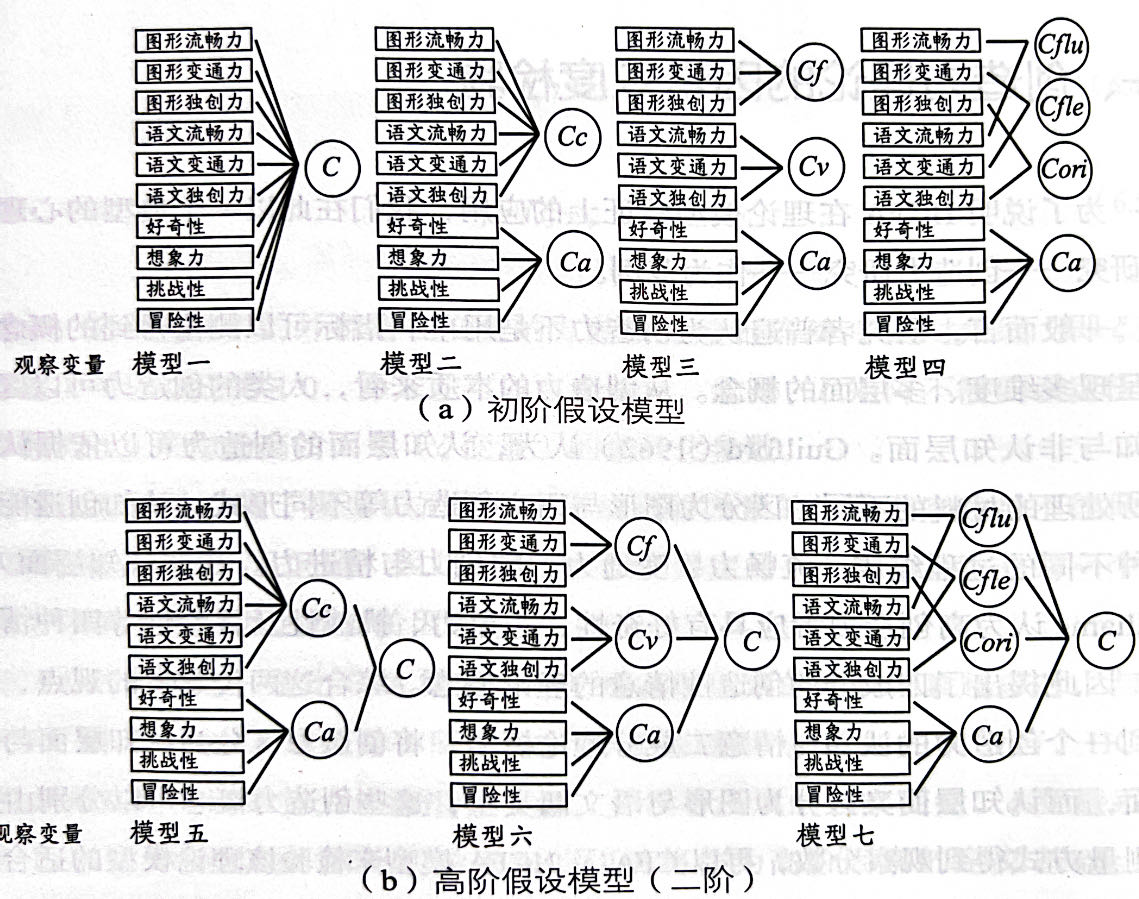
此外,作者还设定了很多其他模型,见图3.2。

Figure 3.2: 各种创造力测量分数的假设模型
3.2 参数估计
3.2.1 变量描述
我们首先看一下变量的分布情况,见表3.1
# 读取数据
dat <- read_csv("data/ch06.csv")

datasummary_skim(dat,
                 title = "创造力测量分数的描述统计量",
fmt = fmt_sprintf("%.2f"))| Unique (#) | Missing (%) | Mean | SD | Min | Median | Max | ||
|---|---|---|---|---|---|---|---|---|
| tf1 | 30 | 0 | 11.76 | 5.62 | 1.00 | 11.00 | 30.00 | |
| tf2 | 23 | 0 | 8.75 | 3.85 | 1.00 | 8.00 | 24.00 | |
| tf3 | 51 | 0 | 16.67 | 9.91 | 0.00 | 15.00 | 56.00 | |
| tl1 | 42 | 0 | 14.16 | 7.79 | 1.00 | 13.00 | 50.00 | |
| tl2 | 22 | 0 | 8.94 | 3.77 | 1.00 | 9.00 | 22.00 | |
| tl3 | 43 | 0 | 8.86 | 8.42 | 0.00 | 7.00 | 66.00 | |
| w1 | 27 | 0 | 31.07 | 4.10 | 17.00 | 31.00 | 44.00 | |
| w2 | 38 | 0 | 43.00 | 6.15 | 19.00 | 43.00 | 65.00 | |
| w3 | 37 | 0 | 34.36 | 6.26 | 16.00 | 34.00 | 62.00 | |
| w4 | 29 | 0 | 36.54 | 4.53 | 19.00 | 37.00 | 50.00 |
3.2.2 参数估计设定
对于图3.1中的模型,原书169页展示的识别策略是:
- 高阶因子的方差被固定为1,载荷自由估计(由于\(R\)默认会自由估计方差,而固定第一个载荷,所以我们必须使用
Crea ~~1*Crea来强制高阶因子的方差为1,用Crea =~ NA*FA+FB+FC中的NA来告诉计算机,该参数必须被估计而不是被固定)。
mod6 <-'
#set the first order factor structure
  FA  =~ tf1+tf2+tf3
  FB  =~ tl1+tl2+tl3
  FC  =~ w1+w2+w3+w4
#set the higher order factor structure
  Crea =~ NA*FA+FB+FC
  Crea ~~1*Crea'
mod6_fit <- cfa(mod6, data = dat)然后我们可以通过inspect命令看一下,设定完成后有哪些参数需要估计。结果与原书169页一致:
inspect(mod6_fit)## $lambda
## FA FB FC Crea
## tf1 0 0 0 0
## tf2 1 0 0 0
## tf3 2 0 0 0
## tl1 0 0 0 0
## tl2 0 3 0 0
## tl3 0 4 0 0
## w1 0 0 0 0
## w2 0 0 5 0
## w3 0 0 6 0
## w4 0 0 7 0
##
## $theta
## tf1 tf2 tf3 tl1 tl2 tl3 w1 w2 w3 w4
## tf1 11
## tf2 0 12
## tf3 0 0 13
## tl1 0 0 0 14
## tl2 0 0 0 0 15
## tl3 0 0 0 0 0 16
## w1 0 0 0 0 0 0 17
## w2 0 0 0 0 0 0 0 18
## w3 0 0 0 0 0 0 0 0 19
## w4 0 0 0 0 0 0 0 0 0 20
##
## $psi
## FA FB FC Crea
## FA 21
## FB 0 22
## FC 0 0 23
## Crea 0 0 0 0
##
## $beta
## FA FB FC Crea
## FA 0 0 0 8
## FB 0 0 0 9
## FC 0 0 0 10
## Crea 0 0 0 03.2.3 结果展示
mod6_res <- summary(mod6_fit, standard = T)
print(mod6_res)
## lavaan 0.6.15 ended normally after 84 iterations
##
## Estimator ML
## Optimization method NLMINB
## Number of model parameters 23
##
## Number of observations 804
##
## Model Test User Model:
##
## Test statistic 87.388
## Degrees of freedom 32
## P-value (Chi-square) 0.000
##
## Parameter Estimates:
##
## Standard errors Standard
## Information Expected
## Information saturated (h1) model Structured
##
## Latent Variables:
## Estimate Std.Err z-value P(>|z|) Std.lv Std.all
## FA =~
## tf1 1.000 5.521 0.983
## tf2 0.628 0.013 50.032 0.000 3.469 0.902
## tf3 1.611 0.033 49.184 0.000 8.892 0.898
## FB =~
## tl1 1.000 7.756 0.996
## tl2 0.419 0.010 42.383 0.000 3.253 0.862
## tl3 0.945 0.022 43.631 0.000 7.328 0.871
## FC =~
## w1 1.000 2.629 0.641
## w2 1.790 0.112 15.940 0.000 4.706 0.766
## w3 1.496 0.106 14.117 0.000 3.933 0.629
## w4 1.285 0.081 15.778 0.000 3.378 0.747
## Crea =~
## FA 3.057 0.349 8.751 0.000 0.554 0.554
## FB 6.248 0.650 9.618 0.000 0.806 0.806
## FC 0.882 0.139 6.360 0.000 0.336 0.336
##
## Variances:
## Estimate Std.Err z-value P(>|z|) Std.lv Std.all
## Crea 1.000 1.000 1.000
## .tf1 1.074 0.280 3.840 0.000 1.074 0.034
## .tf2 2.746 0.175 15.665 0.000 2.746 0.186
## .tf3 18.948 1.188 15.953 0.000 18.948 0.193
## .tl1 0.483 0.663 0.728 0.466 0.483 0.008
## .tl2 3.643 0.216 16.857 0.000 3.643 0.256
## .tl3 17.132 1.040 16.466 0.000 17.132 0.242
## .w1 9.906 0.600 16.515 0.000 9.906 0.589
## .w2 15.586 1.229 12.680 0.000 15.586 0.413
## .w3 23.664 1.413 16.747 0.000 23.664 0.605
## .w4 9.042 0.671 13.469 0.000 9.042 0.442
## .FA 21.136 2.143 9.862 0.000 0.693 0.693
## .FB 21.117 7.711 2.738 0.006 0.351 0.351
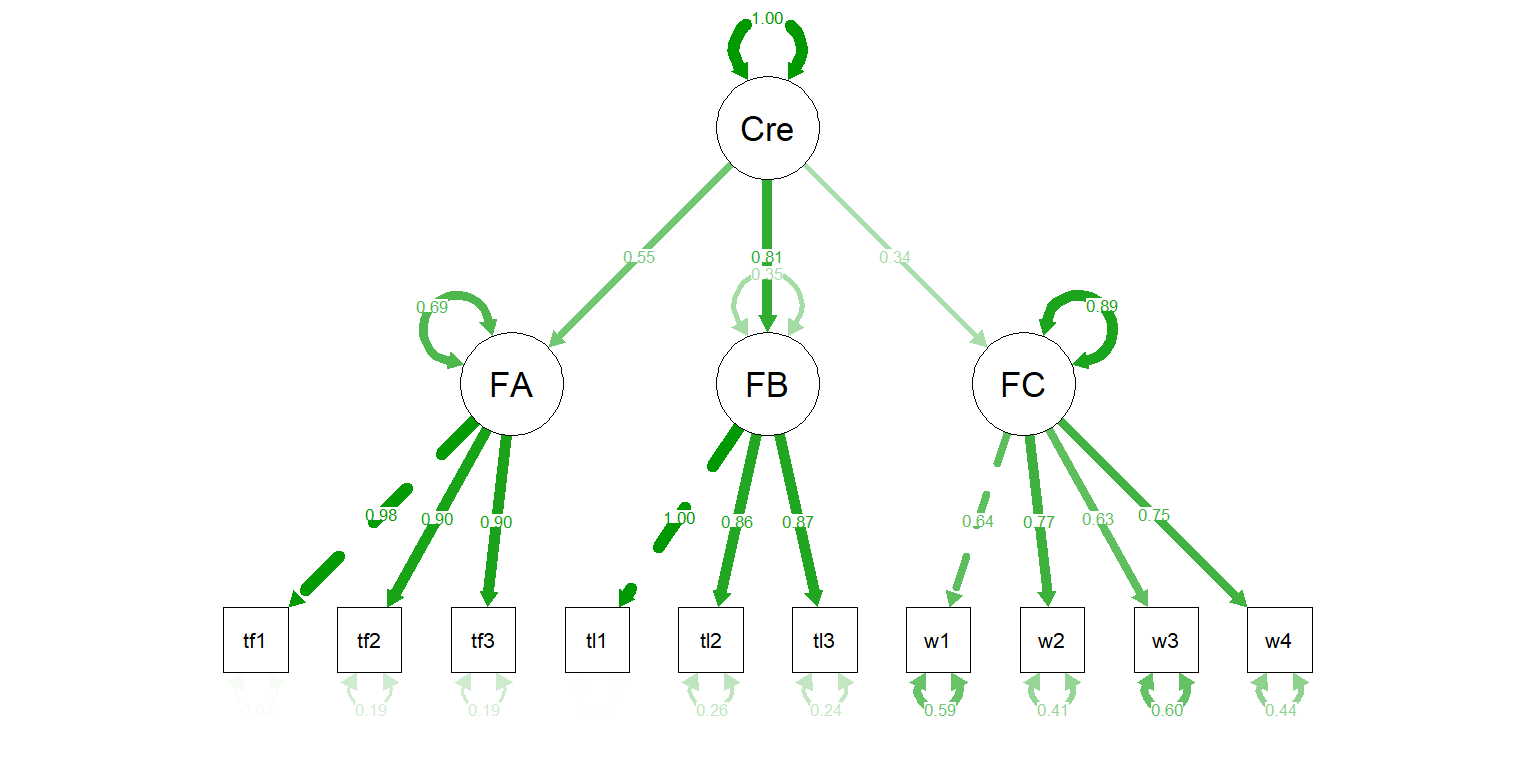
## .FC 6.132 0.695 8.822 0.000 0.887 0.887图3.3是基于完全标准化解Std.all的路径图:
semPaths(mod6_fit,
what = "std") 
Figure 3.3: 模型6的拟合结果
原书171页输出了高阶因素对于初阶因素的解释力,类似于回归分析的\(R^2\)。在该模型中,我们只需要用\(1\)减去FA、FB、FC三者在被标准化的情况下未被解释的方差就可以了得到该结果:
r2 <- mod6_res$pe |>
  filter(lhs == rhs) |>
  filter(!str_detect(lhs, "\\d")) |>
  slice(2:4) |>
  pull(std.all)

str_c(round((1-r2) * 100, 1), '%')
## [1] "30.7%" "64.9%" "11.3%"3.3 模型拟合度分析
原书171页表6.3给出了各个模型的拟合情况比较,我们在表3.2重现了结果。
不知道为什么,这里模型7和书中的差别很大。
# 初阶假设模型
# mod1
mod1 <-'
  C1 =~ tf1 + tf2 + tf3 + NA*tl1 + tl2 + tl3 + w1 + w2 + w3 + w4'
# mod2
mod2 <- '
  C1 =~ tf1 + tf2 + tf3 + tl1 + tl2 + tl3
  C2 =~ w1 + w2 + w3 + w4
'
# mod3
mod3 <- '
  C1 =~ tf1 + tf2 + tf3
  C2 =~ tl1 + tl2 + tl3
  C3 =~ w1 + w2 + w3 + w4
'
# mod4
mod4 <- '
  C1 =~ tf1 + tl1
  C2 =~ tf2 + tl2
  C3 =~ tf3 + tl3
  C4 =~ w1 + w2 + w3 + w4
'
# 高阶假设模型
# mod5
mod5 <-'
#set the first order factor structure
  C1  =~ tf1+tf2+tf3 + tl1+tl2+tl3
  C2  =~ w1+w2+w3+w4
#set the higher order factor structure
  H1 =~ C1 + C2'
# mod6
mod6 <-'
  FA  =~ tf1+tf2+tf3
  FB  =~ tl1+tl2+tl3
  FC  =~ w1+w2+w3+w4
  Crea =~ FA+FB+FC'
#mod5
mod7 <-'
  C1 =~ tf1 + tl1
  C2 =~ tf2 + tl2
  C3 =~ tf3 + tl3
  C4 =~ w1 + w2 + w3 + w4
  H1 =~ C1 + C2 + C3 + C4 '

# 拟合模型
all_mod <- list(mod1 = mod1,
                mod2 = mod2,
                mod3 = mod3,
                mod4 = mod4,
                mod5 = mod5,
                mod6 = mod6,
                mod7 = mod7)

# 基于模型返回fit.measures
get_measures <- function(mymod){
  res <- cfa(mymod, data = dat) |>
    fitMeasures() |>
    as.list()
}

all_res <- map_dfr(all_mod,
               .f = ~get_measures(.))

all_res |>
  mutate(model = c("模型一", "模型二", "模型三", "模型四","模型五", "模型六", "模型七")) |>
  select(model, chisq, df, rmsea, nnfi, cfi, srmr) |>
  mutate(across(is.numeric, ~round(., 3))) |>
knitr::kable(caption = "各模型拟合度比较表")| model | chisq | df | rmsea | nnfi | cfi | srmr |
|---|---|---|---|---|---|---|
| 模型一 | 2913.864 | 35 | 0.320 | 0.365 | 0.506 | 0.223 |
| 模型二 | 2057.215 | 34 | 0.272 | 0.541 | 0.653 | 0.164 |
| 模型三 | 87.388 | 32 | 0.046 | 0.987 | 0.991 | 0.020 |
| 模型四 | 1891.180 | 29 | 0.283 | 0.504 | 0.681 | 0.120 |
| 模型五 | 2057.215 | 33 | 0.276 | 0.527 | 0.653 | 0.164 |
| 模型六 | 87.388 | 32 | 0.046 | 0.987 | 0.991 | 0.020 |
| 模型七 | 1899.432 | 31 | 0.274 | 0.535 | 0.680 | 0.120 |