Business Analytics with R - DRAFT
Jeff Monroe
2018-08-05
Chapter 1 Introduction
1.1 Overview
Between 2010 and 2020 it is estimated that data will grow 50-fold with enterprises responsible for the bulk of the growth. Add to this that only 0.5% of the world’s data is being analyzed, underscoring the importance of technology and talent to extract the hidden value from all this data 1. As a Business Manager, it is your responsibility to make use of data and analytics to increase value for the organization. Even if you will not be directly involved in gathering data, writing reports and developing statistical models, you should understand the processes and methods involved to intelligently guide others. Business Analytics encompasses the skills, practices, and technologies required for exploration of past business performance to gain insight and serve as the foundation for business planning. Business analytics allows you to develop new insights and understanding of business performance applying statistical methods. This is in contrast to business intelligence which typically focuses on using a consistent set of metrics to both measure past performance and guide business planning, but is also based on data and statistical methods 2.
The notes for this course were compiled from years of work in industry using R. These notes are intended to provide the non-programmer and programmer alike a hands-on approach to learning R for use in Business Analysis. The notes are ideal for the Accounting, Business, and Data Science majors desiring a better understanding of how the programming language R may be used to retrieve and organize data, perform analysis, create visualizations and automate business processes to reduce error and improve efficiency in the workplace.
This text is divided into five sections, aligning with the Data Science approach, beginning with an Introduction. The Introduction provides a history of R, a comparison to other languages such as Python, and also provides a step-by-step walk-through for installing R, R Studio, and packages used throughout the course. If you are familiar with R, this section may be skipped.
The next section, R Basics, gets the reader up and running in R quickly, by covering Operators, Functions and Data Types. This section is critical to a general understanding of R and should be reviewed if you are relatively new to te programming language. If you have more than a basic knowledge of R, feel free to move to the next section, Data Acquisition.
Data Acquisition is where the rubber meets the road with R, and where, at least initially, you will spend most of your time in R, not just in this course, but in the ‘real world’. The Data Acquisition section covers retrieving data from a variety of sources, including: Excel, .csv, SQL Server and the web. We then move to cleaning the retrieved data, identifying and dealing with outliers, handling missing data and data manipulation. Several approaches are provided for each area you will be working with, along with an overview of the benefits and risks associated with each.
With our data now organized, we will move to analysis, though I argue that the most important analysis was actually conducted during the Data Acquisition phase, in that selecting and cleaning the data can not be done without some analytical thought. Analysis will cover Looping and Debugging our scripts, Visualizations, Classification, Clustering and Forecasting. It is in this section, the Business Analyst really begins to see the power of R in identifying and communicating opportunities for Business. Which brings us to our final section in the course.
Deployment or Communicating the results, provides the business with actionable insights that drive results. A critical component of communicating the insights you discovered is understanding the audience. Presenting to a Senior Vice President is different than presenting to a working team, and it is during this section of the course you will better understand the difference. We will then move on to the various methods for communication, including web portals, such as RShiny and Dashboard development. Many companies are using off-the-shelf applications such as PowerBI, Tableau and DOMO, so we will also provide a walk-through on integrating R with those tools. Finally, not application is used for presentations in business more than PowerPoint, so we will also show how to output your results seamlessly to PowerPoint and deploy using Outlook.
Throughout the text, we’ll use generic examples and those from a fictional company Acme Corporation, a conglomerate based on Fairfield, New Jersey which produces every product type imaginable, no matter how elaborate or extravagant. Most of the products however, never work as desired or expected (some products do work very well, but backfire against the user, often a coyote).
While Acme’s products leave much to be desired, Acme delivery service is second to none; a customer can merely drop an order into a mailbox, or enter an order on a website, and have the product in his hands within seconds.
Examples are taken from Finance, Operations, Marketing and Planning. Finance examples will demonstrate extracting company financial statements (income statement, balance sheet, etc.) from internet sources and comparing companies with each other and a single company over time. Operations examples will demonstrate inventory and transportation optimization, using data sets provided. Marketing examples will focus on Market Mix Optimization and will support the Operations models. Planning will extract a variety of economic and trade data. In the Deployment portion of the book, a discussion and demonstration will provide a dashboard tying all the aforementioned analysis together. We will also provide an example of outputing to PowerPoint and distributing via Outlook.
1.2 Preliminaries
History of R
- R is an implementation of the S programming language combined with lexical scoping semantics inspired by Scheme.
- S was created by John Chambers while at Bell Labs.
- There are some important differences, but much of the code written for S runs unaltered.
- R was created by Ross Ihaka and Robert Gentleman at the University of Auckland, New Zealand, and is currently developed by the R Development Core Team, of which Chambers is a member.
- R is named partly after the first names of the first two R authors and partly as a play on the name of S.
- The project was conceived in 1992, with an initial version released in 1995 and a stable beta version in 2000.
Meet R
The Facts
- R is a language and environment for statistical computing and graphics
- Freely available and maintained by volunteers
- R is extensible; can be expanded by installing packages
How to get it
- http://www.r-project.org/
- Available for Windows, Mac, Linux
- Free to install, no catches
Also highly recommended
- R Studio: a free IDE for R
- http://www.rstudio.com/
- If you install R and R Studio, then you only need to run R Studio
Use R
- R is command-line driven (very little point-and-click)
- You use functions to work with data
- Most analyses require writing a script, which is sourced into the R console
- R Studio makes this process easier
What is so special about R?
- Free
- Over 12000 packages that add functionality (about 25 come with R)
- Produces nice print-ready graphics
- Open-source (you can see how it does what it does)
- Easy to install and non-invasive
Text Assumptions, Goals and Expectations
- No experience with R is necessary
- Familiarity with basic statistical concepts
- Get you comfortable enough to start using R
- Give you with example code you can use and resources to learn more
- You will not be an expert after a single course
- You must use R to learn R
1.3 Software Requirements
To install R on a Mac or PC, you first need to go to: http://www.r.project.org
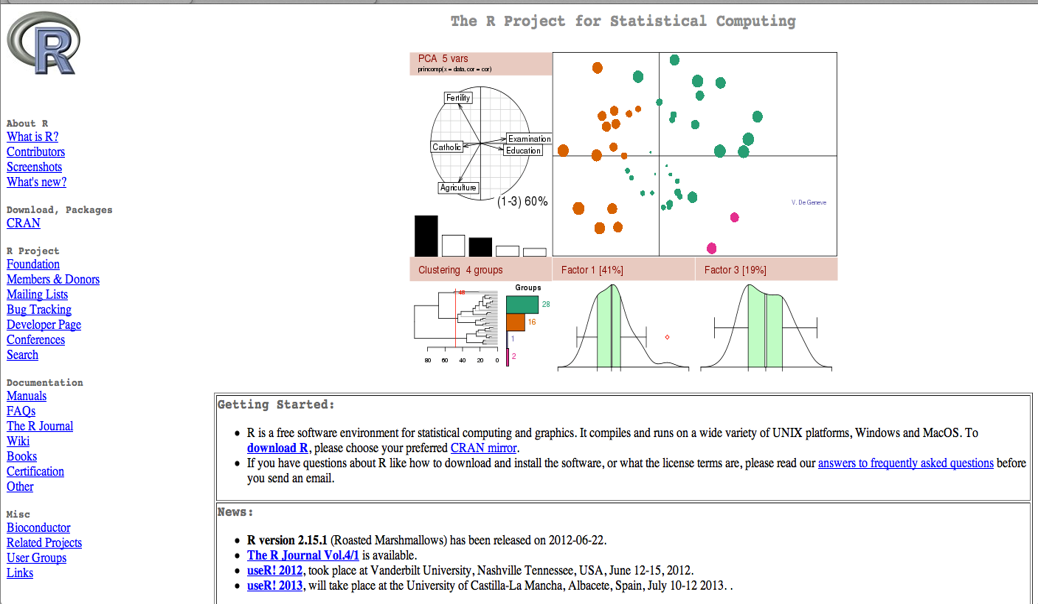
Source: The R project for Statistical Computing.
Select the appropriate Download for your system.
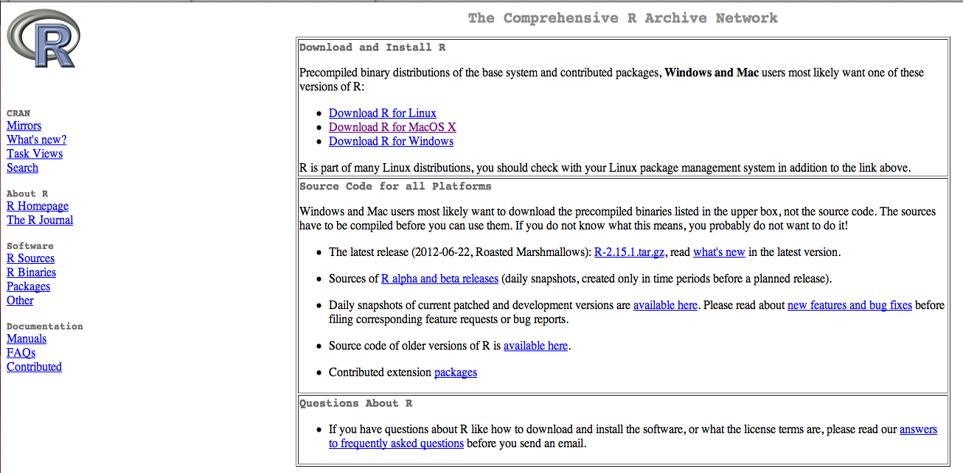
Source: The R project for Statistical Computing.
Select the most recent version of R, not 2.15.1, as shown here.
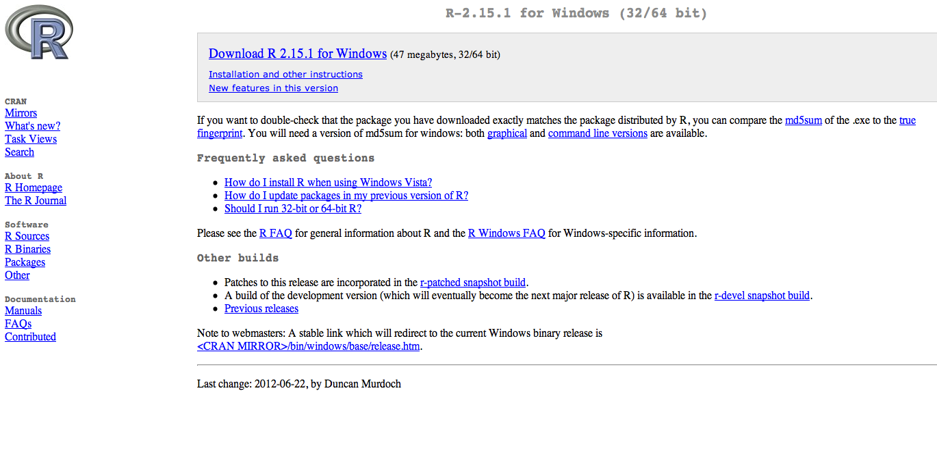
Source: The R project for Statistical Computing.
Follow the prompts to install R.
With R succesfully installed, let’s now install R Studio, an R IDE (Integrated Development Environment).
First, go to: https://www.rstudio.com/products/rstudio/download/
Download the Desktop - Free version. 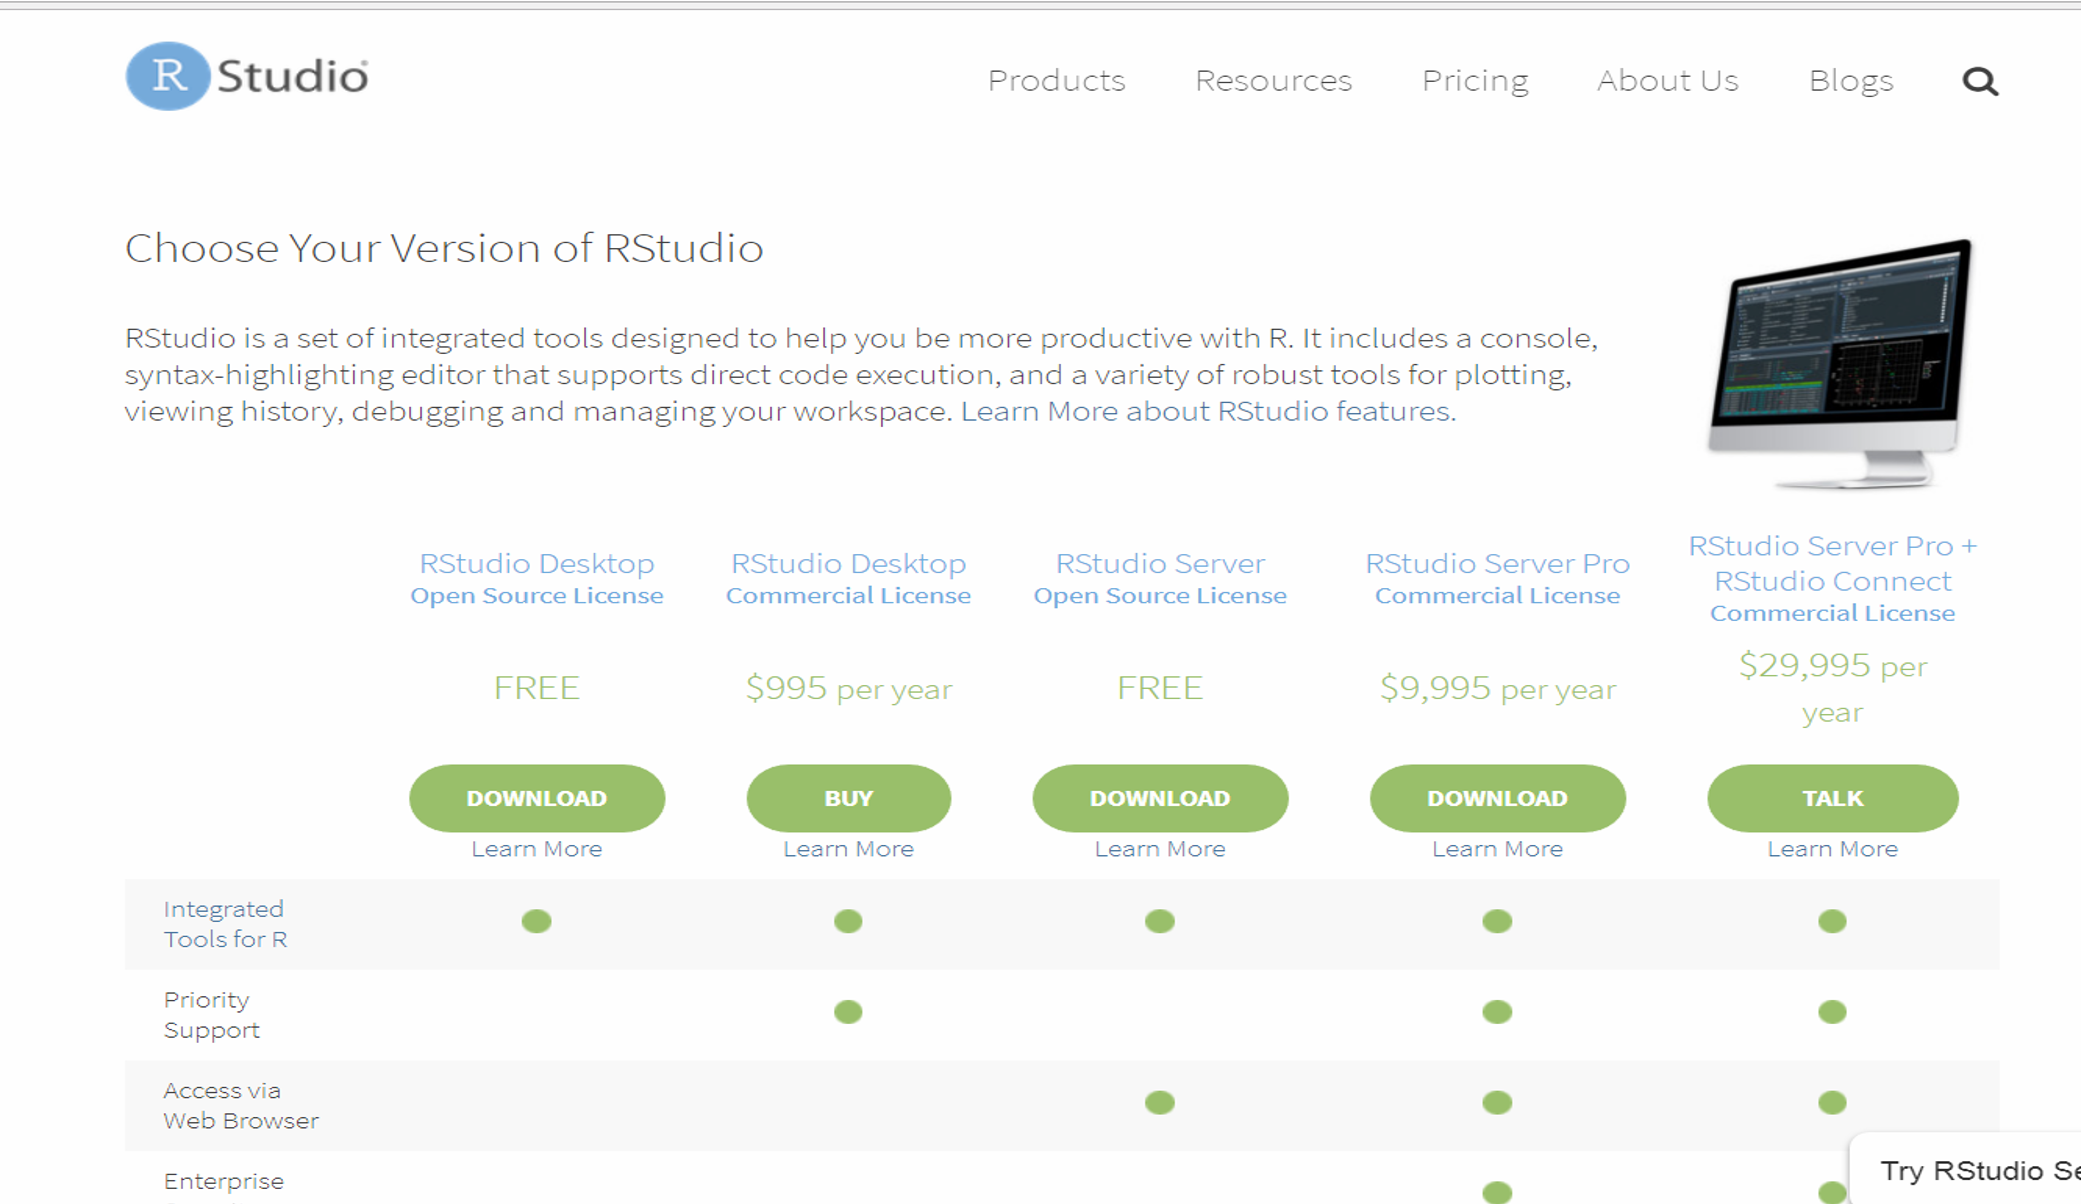
Selecting the Installer appropriatte for your system. 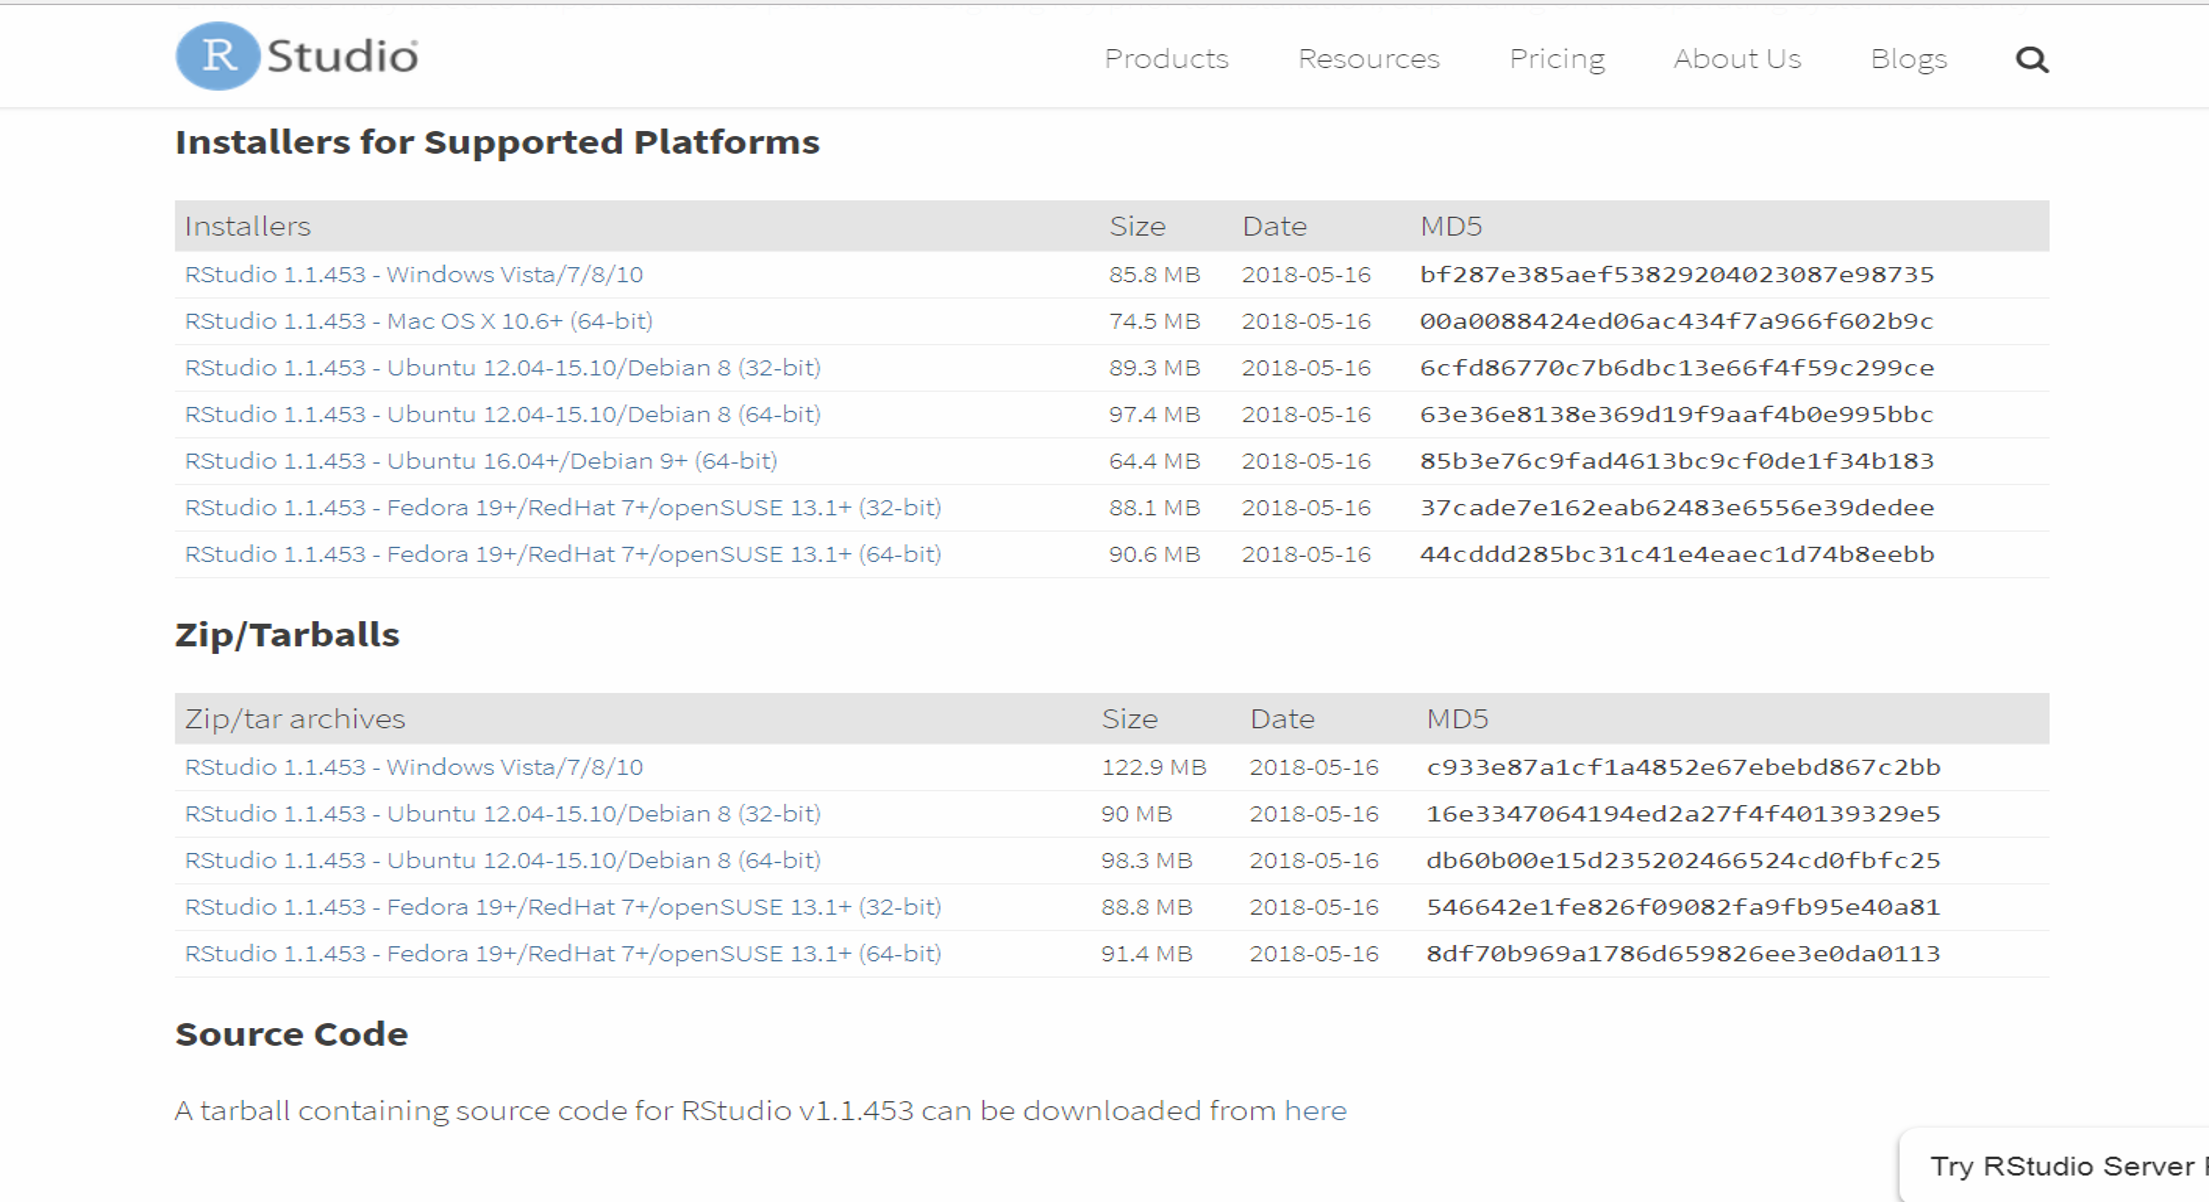
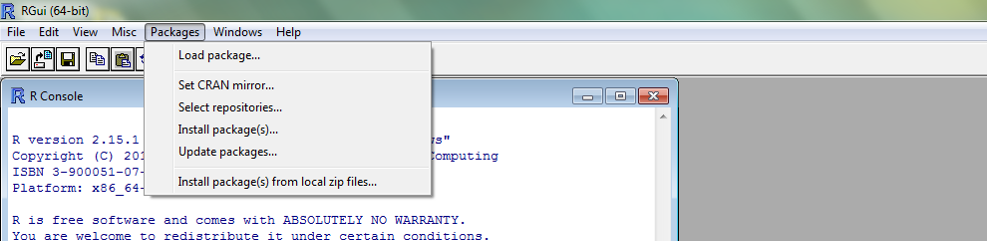
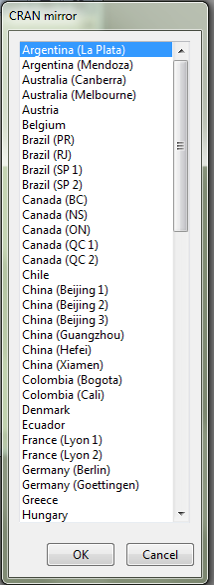
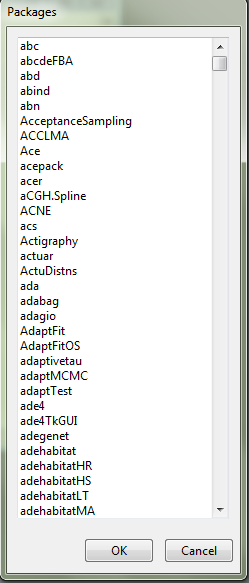
Installing Packages.