Chapter 8 Confounding
8.0.1 R packages required for this chapter
library(knitr)
library(tidyverse)
library(dagitty)
library(ggdag)
library(patchwork)
library(broom)
library(data.table)
library(simstudy)
library(gridExtra)
library(epiR)
library(tableone)
library(ipw)
library(sandwich) #for robust variance estimation
library(survey)
library(haven)
library(EValue)
8.1 Introduction
Confounding is a causal concept defined in terms of the data generating model (see Figure 7.1a) as a variable that causally influences the dependent variable and is associated with the independent variable, thereby causing a spurious association.
While older definitions of confounding considered it a bias described as a mixing of effects of extraneous factors (called confounders) with the effect of interest, more recent definitions place confounding in the paradigm of potential outcomes or counterfactuals. It should be acknowledged that not all accept this approach and a tongue in cheek extrapolation of the paradigm may be found here.
There are a multitude of methods to control for confounding and these will be discussed in this and later chapters. Confounding control can occur at the design stage through randomization, restriction or matching. At the analysis stage, confounding control can be managed by standardization, stratification or standard multivariable regression. Limitations in these methods have lead to the advancement of newer approaches including structural causal models or directed acyclic graphs (DAGs), propensity scores, marginal structural models with inverse probability weighting, and quasi experimental methods such as instrumental variables.
8.2 Understanding confounding with simulation and visualization
In keeping with the spirit of this book, we will explore confounding through data the use of R, data simulation, and data visualizations. The following discussion and code is heavily borrowed from this blog. As discussed in Chapter 7, the following DAG represents a confounding situation where an exposure (treatment) X causes an outcome Y, in the presence of a confounder C, represented as the common cause of both exposure and outcome and e a random error term.
# example 1
dag <- dagitty("dag {
  X -> Y
  C -> X
  C ->  Y
  e -> Y
               }")

coordinates( dag ) <-  list(
  x=c(X=1, C=3, Y=5, e=5),
  y=c(X=1, C=3, Y=1, e=3))

dag <- tidy_dagitty(dag)
ex1 <- ggdag(dag, layout = "circle") + theme_dag_blank(plot.caption = element_text(hjust = 1)) + geom_dag_node(color="pink") + geom_dag_text(color="white") +
  ggtitle("a) DAG with a confounder (C)") +
  labs(caption = "X = drug exposure\nY = outcome\nC = confounder\n e = random error")
ex1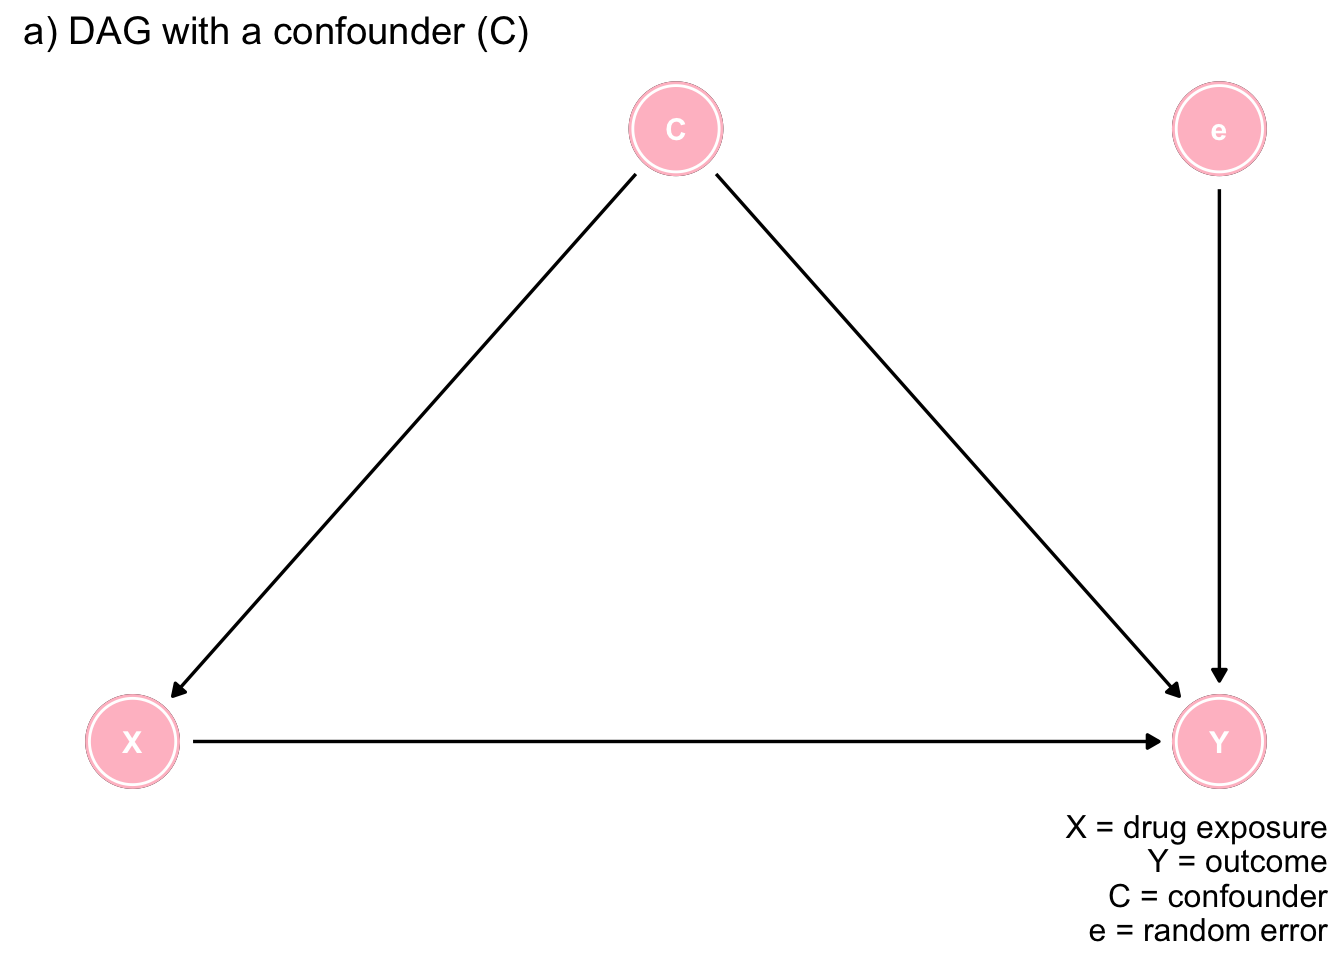
Figure 7.1: The importance of DAGs
In terms of potential outcomes, the causal effect is defined as \(CE_i = Y_{1i} - Y_{0i}\), where \(Y_{1i}\) and \(Y_{0i}\) represent the potential outcomes for each individual i being both exposed and not exposed respectively. If \(Y_{1i} = Y_{0i}\), we would conclude in the absence of a causal effect. In the real world we only observe one of these 2 exposures but in the world of simulation we can generate both potential and observed outcomes.
Let’s create a data frame of 1,000 individuals where the causal effect, \(CE_i = Y_{1i} - Y_{0i} = 1.0\) points, a confounder C is present in approximately 40% of the population, and it increases the outcome by 2 points.
def <- defData(varname = "C", formula = 0.4, dist = "binary")
def <- defData(def, "X", formula = "0.3 + 0.4 * C", dist = "binary")
def <- defData(def, "e", formula = 0, variance = 2, dist = "normal")
def <- defData(def, "Y0", formula = "2 * C + e", dist="nonrandom")
def <- defData(def, "Y1", formula = "1 + 2 * C + e", dist="nonrandom")
def <- defData(def, "Y_obs", formula = "Y0 + (Y1 - Y0) * X", dist = "nonrandom") #  = Y1*X + (1-X)*Y0

set.seed(2017)
dt <- genData(10000, def)
We can check that the simulated data represents the desired conditions by calculating the true causal effect, verify the percentage with the confounder and calculate the observed outcome for those with and without exposure. The observed outcomes equal Y1 when X=1 and Y0 when X=0.
paste0("Calculated mean causal effect = ", mean(dt[, Y1] - dt[, Y0])) #mean difference of counterfactual outcomes## [1] "Calculated mean causal effect = 1"paste0("The percentage of the population with confounder C = ", sum(dt[,C])/ nrow(dt))## [1] "The percentage of the population with confounder C = 0.4006"paste0("Calculated observed difference = ", round(dt[X == 1, mean(Y_obs)] - dt[X == 0, mean(Y_obs)],2))## [1] "Calculated observed difference = 1.71"This confirms the validity of the simulated dataset as it faithfully represents the stipulated conditions. The observed difference is not equal to the causal difference of the potential outcomes due to the presence of the confounder C. The observed difference = the casual difference (1.0) + bias (40% * 2 = .8) which is approximated the calculated observed difference.
The same biased answer could be obtained using unadjusted linear regression.
lm1 <- lm(Y_obs ~ X, data = dt)
tidy(lm1)
## # A tibble: 2 x 5
## term estimate std.error statistic p.value
## <chr> <dbl> <dbl> <dbl> <dbl>
## 1 (Intercept) 0.481 0.0225 21.3 8.84e-99
## 2 X 1.71 0.0335 51.1 0.Multivariable linear regression allows for confounder adjustment and gives the constructed causal effect for this simple case without interactions or time dependent exposures.
lm1 <- lm(Y_obs ~ X + C, data = dt)
tidy(lm1)
## # A tibble: 3 x 5
## term estimate std.error statistic p.value
## <chr> <dbl> <dbl> <dbl> <dbl>
## 1 (Intercept) 0.0283 0.0204 1.39 1.65e- 1
## 2 X 0.973 0.0306 31.7 7.88e-211
## 3 C 1.96 0.0311 63.0 0.However, it is worth repeating as discussed in the previous chapter, that even in an apparently simple model one should be careful not to blindly add variables to an automated regression algorithm as this many create bias if the variable is a collider.
Let’s examine this dataset via graphical means and the following 2 functions will be helpful for the plotting. (Understanding this code is not required to understand the graphical approach.)
getDensity <- function(vector, weights = NULL) {

  if (!is.vector(vector)) stop("Not a vector!")

  if (is.null(weights)) {
    avg <- mean(vector)
  } else {
    avg <- weighted.mean(vector, weights)
  }

  close <- min(which(avg < density(vector)$x))
  x <- density(vector)$x[close]
  if (is.null(weights)) {
    y = density(vector)$y[close]
  } else {
    y = density(vector, weights = weights)$y[close]
  }
  return(data.table(x = x, y = y))

}

plotDens <- function(dtx, var, xPrefix, title, textL = NULL, weighted = FALSE) {

  dt <- copy(dtx)

  if (weighted) {
    dt[, nIPW := IPW/sum(IPW)]
    dMarginal <- getDensity(dt[, get(var)], weights = dt$nIPW)
  } else {
    dMarginal <- getDensity(dt[, get(var)])
  }

  d0 <- getDensity(dt[C==0, get(var)])
  d1 <- getDensity(dt[C==1, get(var)])

  dline <- rbind(d0, dMarginal, d1)

  brk <- round(dline$x, 1)

  p <- ggplot(aes(x=get(var)), data=dt) +
    geom_density(data=dt[C==0], fill = "#ce682f", alpha = .4) +
    geom_density(data=dt[C==1], fill = "#96ce2f", alpha = .4)

  if (weighted) {
    p <- p + geom_density(aes(weight = nIPW),
                              fill = "#2f46ce", alpha = .8)
  } else p <- p + geom_density(fill = "#2f46ce", alpha = .8)

  p <- p +  geom_segment(data = dline, aes(x = x, xend = x,
                                   y = 0, yend = y),
                 size = .7, color =  "white", lty=3) +
            annotate(geom="text", x = 12.5, y = .24,
             label = title, size = 5, fontface = 2) +
            scale_x_continuous(limits = c(-5, 8),
                       breaks = brk,
                       name = paste(xPrefix, var)) +
            theme(panel.grid = element_blank(),
                  axis.text.x = element_text(size = 12),
                  axis.title.x = element_text(size = 13)
    )

    if (!is.null(textL))  {
      p <- p +
        annotate(geom = "text", x = textL[1], y = textL[2],
                 label = "C=0", size = 4, fontface = 2) +
        annotate(geom = "text", x = textL[3], y = textL[4],
                 label="C=1", size = 4, fontface = 2) +
        annotate(geom = "text", x = textL[5], y = textL[6],
                 label="Population distribution", size = 4, fontface = 2) +
        theme(axis.text.x = element_text(angle = 60, hjust = 1))
    }

    return(p)
}
First we will consider the whole population (blue curve) which is seen to be a weighted average of the 2 subgroups defined by the covariate C. Among the unexposed, left sided graph, the potential outcome, Y0, equals 0.8. For the exposed, right sided graph, the potential outcome, Y1, equals 1.8.The graph confirms the correct construction of the simulated dataset as the population expected potential value of Y1 (1.8) is 1.0 greater than Y0 (0.8), representing the causal effect of X.
grid.arrange(plotDens(dt, "Y0", "Potential outcome", "Full\npopulation",
                         c(0, .24, 2, .21, 2.6, .06)),
             plotDens(dt, "Y1", "Potential outcome", "Full\npopulation",
                         c(0, .24, 2, .21, 2.6, .06)),
             nrow = 1
)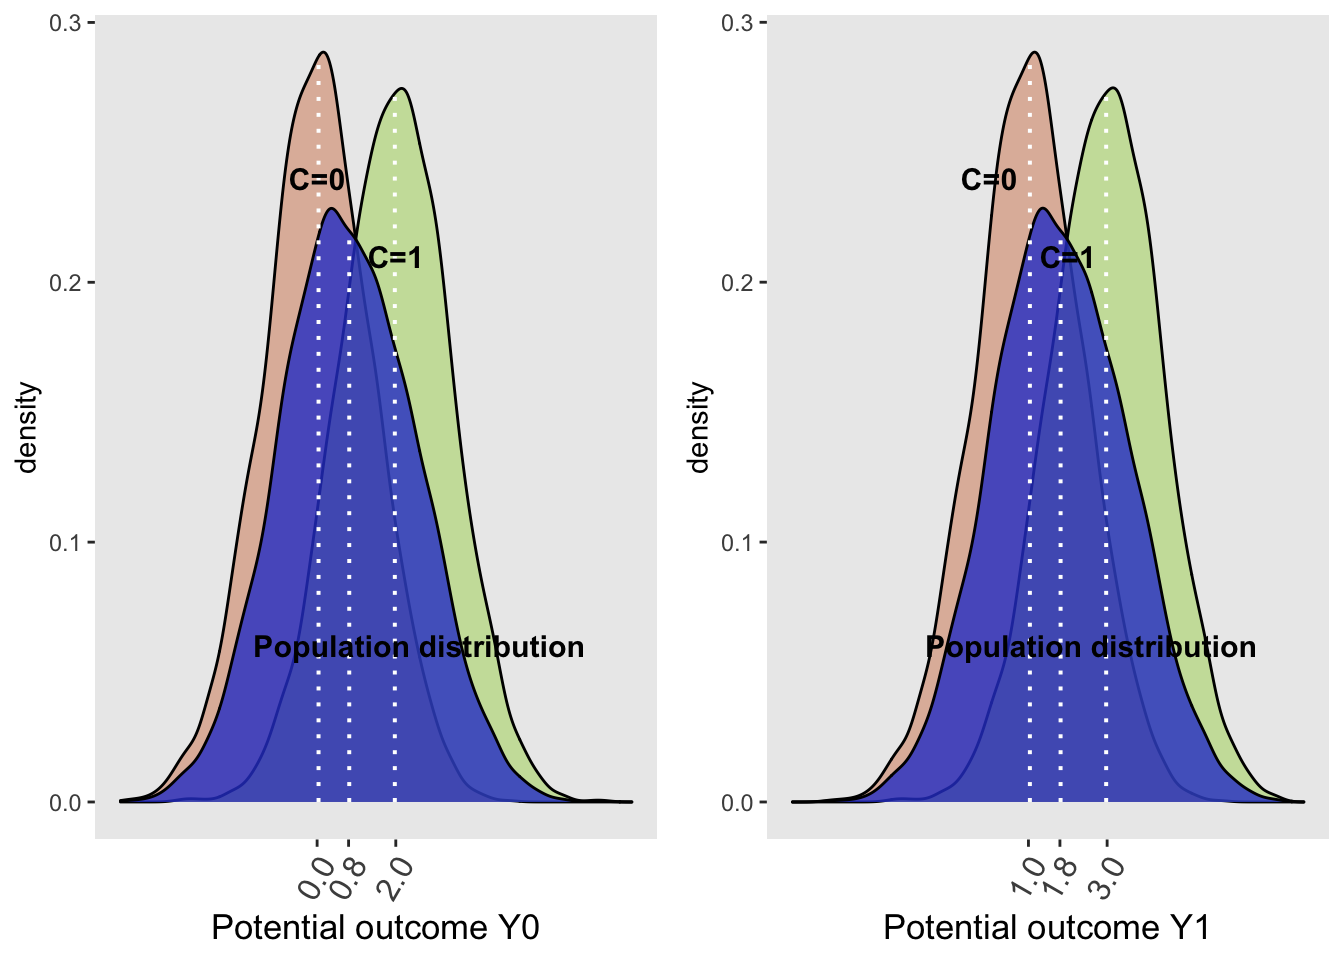
It may be appreciated that the population distribution depends on the confounder C and the exposure with the causal effect, 1.0, being applied equally to each of the covariate subgroups (0.0 -> 1.0 and 2.0 -> 3.0). In other words, the conditional effect sizes are equal to the population or marginal effect size. The population distribution are non-symmetrically shaped, because they are a mixture of the conditional normal distributions, weighted by the proportion of each level of the confounder with more weight given to C=0 since that represents 60% of the population. Since the proportions for the two plots are the same with each using the whole counterfactual populations, the population-level density curves for Y0 and Y1 are similarly shaped.
Now let’s examine the same two plots but now for the observed data.
g1 <- plotDens(dt[X==0], "Y_obs", "Observed", "Unexposed\nonly", c(0, .24, 2, .21))
g2 <- plotDens(dt[X==1], "Y_obs", "Observed", "Unexposed\nonly", c(0, .24, 2, .21))
g1 + g2 +
  plot_annotation(title = 'Plots of unexposed (left) and exposed (right) observations')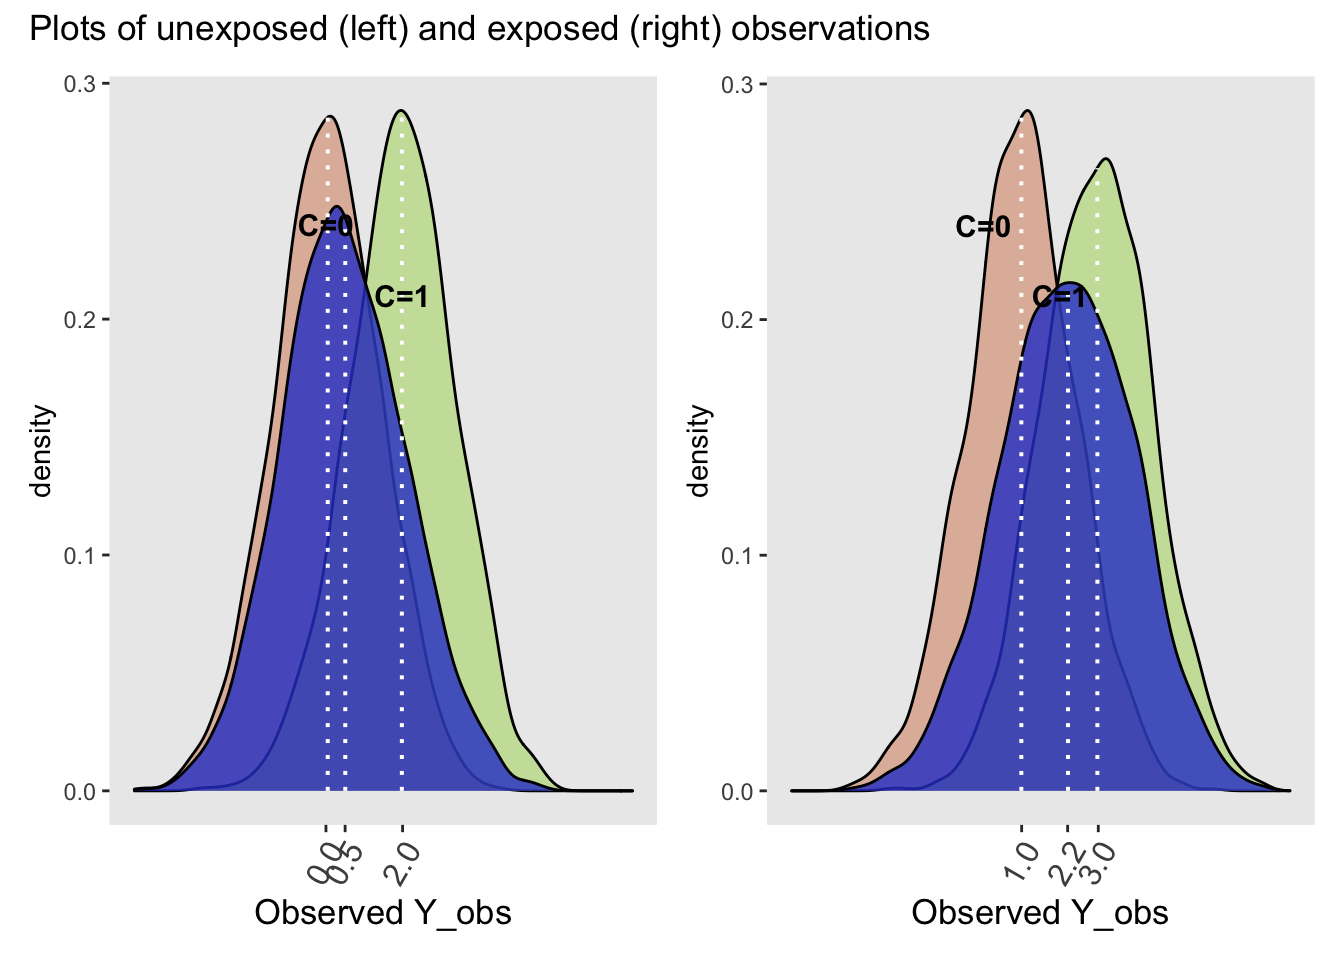
While the distributions of the observed Y (Y_obs) conditional on C are identical to their conditional potential outcome counterparts in the whole population, the marginal distributions (blue curves) are quite different for the unexposed and exposed. The observed difference between the exposed and unexposed = E(Y_obs | X = 1) - E(Y_obs | X = 0) = 2.2 - 0.5 = 1.7 \(\neq\) 1.0 (the causal effect). This difference indicates the presence of confounding. Notice that the observed difference of the stratified differences do equal the causal effect,
E(Y_obs | C = 1, X = 1) - E(Y_obs | C = 1, X = 0) = 3.0 - 2.0 = 1.0 (causal effect) and
E(Y_obs | C = 0, X = 1) - E(Y_obs | C = 0, X = 0) = 1.0 - 0.0 = 1.0 (causal effect)
Can you explain why the observed marginals are different between the exposed and unexposed? Hint: remember the structure of a confounder and calculate the the percentage of those with confounder C in the unexposed and exposed groups.
paste0("In the unexposed group, the percentage with confounder C = 1 is ", round(dt[, .(propLis1 = mean(C)), keyby = X][1,2]*100,2), "%")## [1] "In the unexposed group, the percentage with confounder C = 1 is 23.06%"paste0("In the exposed group, the percentage with confounder C = 1 is ", round(dt[, .(propLis1 = mean(C)), keyby = X][2,2]*100,2), "%")## [1] "In the exposed group, the percentage with confounder C = 1 is 60.61%"Thus the observed exposure marginals are different as they have different weights for the confounders. The observed difference is a mixture of the true causal effect and the confounding bias.
8.3 Understanding confounding with inverse probability weighting
Weighting each individual observation by its inverse probability of exposure creates a pseudo-population whereby the effect of confounding has been removed and the marginal effect of exposure on the outcome can be estimated. While you may readily accept this as being true, I prefer confirming such statements via a quick simulation example. I find this approach more convincing than simply being told.
First, let’s perform the unadjusted regression as done previously,
lm1 <- lm(Y_obs ~ X, data = dt)
tidy(lm1)
## # A tibble: 2 x 5
## term estimate std.error statistic p.value
## <chr> <dbl> <dbl> <dbl> <dbl>
## 1 (Intercept) 0.481 0.0225 21.3 8.84e-99
## 2 X 1.71 0.0335 51.1 0.Here we observe the biased causal estimate of 1.7 (true value = 1.0). Now we will create an exposure model, where we are assuming this to be a function of C alone. Having the correct model is obviously a key assumption to the success of inverse probability weighting. From this model we can predict the probability, pX, of being exposed for each individual. Inverse probability weighting can then be calculated from these probabilities
\(IPW = \frac{1}{Px}\) for the exposed group and
\(IPW = \frac{1}{1 - Px}\) for the unexposed group
exposureModel <- glm(X ~ C, data = dt, family = "binomial")
tidy(exposureModel)
## # A tibble: 2 x 5
## term estimate std.error statistic p.value
## <chr> <dbl> <dbl> <dbl> <dbl>
## 1 (Intercept) -0.859 0.0283 -30.4 3.34e-203
## 2 C 1.64 0.0442 37.0 1.06e-299dt[, pX := predict(exposureModel, type = "response")] # := creates and assigns a variable
# Define two new columns
defC2 <- defDataAdd(varname = "pX_actual",
formula = "X * pX + (1-X) * (1-pX)",
dist = "nonrandom")
defC2 <- defDataAdd(defC2, varname = "IPW",
formula = "1/pX_actual",
dist = "nonrandom")
# Add weights
dt <- addColumns(defC2, dt)
round(dt[1:5], 2)## id C X e Y0 Y1 Y_obs pX pX_actual IPW
## 1: 1 1 1 1.19 3.19 4.19 4.19 0.68 0.68 1.46
## 2: 2 0 0 1.50 1.50 2.50 1.50 0.30 0.70 1.42
## 3: 3 0 0 -0.06 -0.06 0.94 -0.06 0.30 0.70 1.42
## 4: 4 0 0 -0.24 -0.24 0.76 -0.24 0.30 0.70 1.42
## 5: 5 1 1 1.88 3.88 4.88 4.88 0.68 0.68 1.46Using these weights, we create a pseudo population which can now be analyzed using a simple, unadjusted regression model.
tidy(lm(Y_obs ~ X , data = dt, weights = IPW)) ## # A tibble: 2 x 5
## term estimate std.error statistic p.value
## <chr> <dbl> <dbl> <dbl> <dbl>
## 1 (Intercept) 0.809 0.0241 33.6 3.90e-234
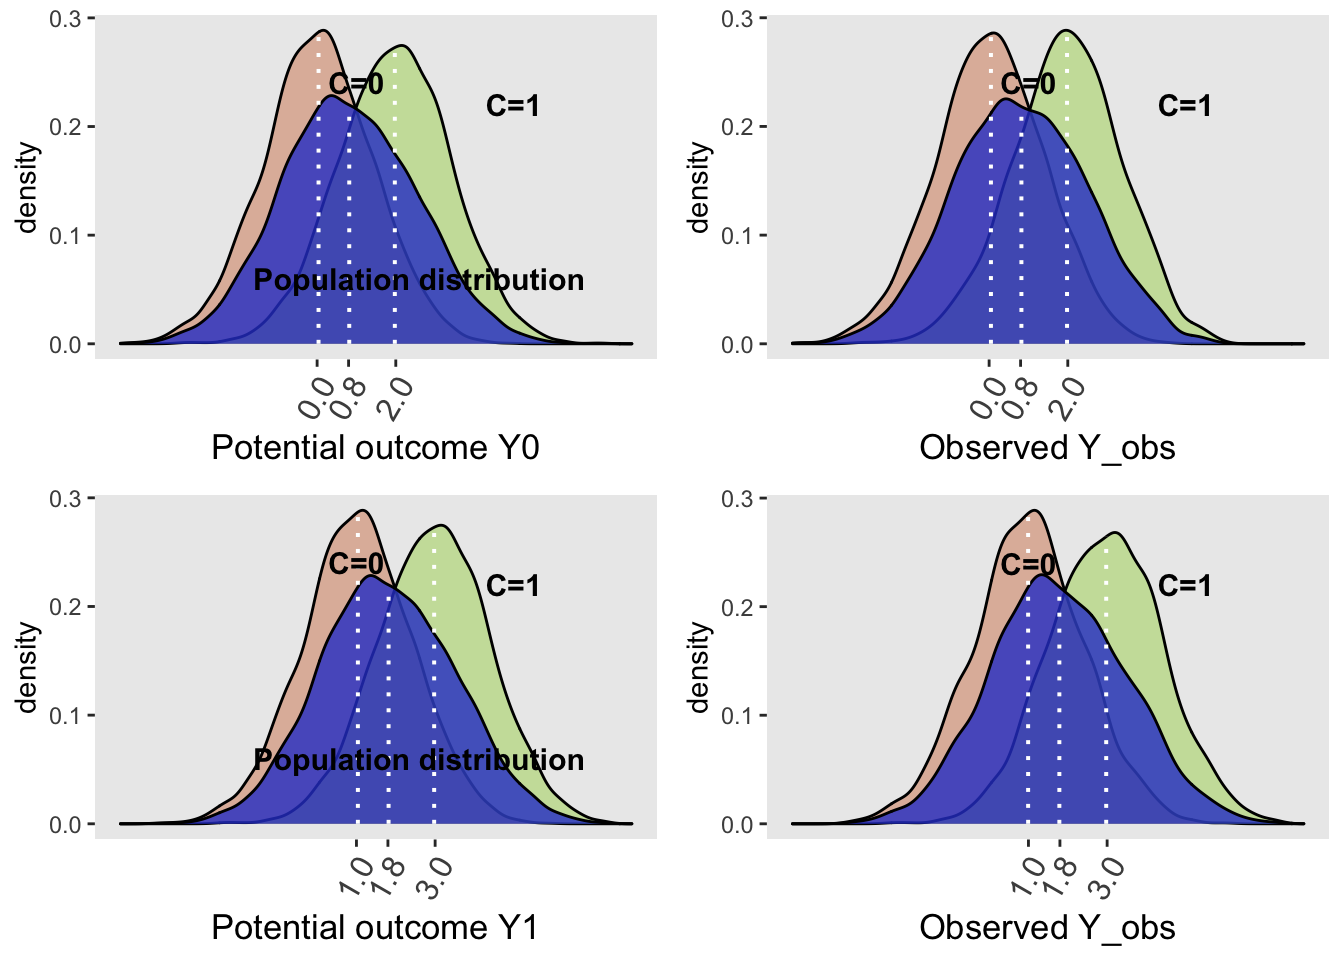
## 2 X 0.972 0.0341 28.5 3.30e-172The estimated effect size definitely approached the simulated causal effect.
Moreover in this simple example,the marginal effect provides the same information as the conditional effect estimate but we will see that with more complex models this is not always the case.
grid.arrange(plotDens(dt, "Y0", "Potential outcome", "Population",
                         c(1, .24, 5, .22, 2.6, .06)),
             plotDens(dt[X==0], "Y_obs", "Observed", "Unexposed",
                      c(1, .24, 5, .22), weighted = TRUE),
             plotDens(dt, "Y1", "Potential outcome", "Population",
                      c(1, .24, 5, .22, 2.6, .06)),
             plotDens(dt[X==1], "Y_obs", "Observed", "Exposed",
                      c(1, .24, 5, .22), weighted = TRUE),
             nrow = 2
)
8.4 Example - Confounding adjustment using IPW
As an example, consider this dataset of 5735 observations and 62 variables that examines the impact of placing a right heart catheter (RHC or Swan Ganz catheter) on the survival of critically ill patients.
As the groups have not been randomized, it is essential to try and balance the groups for other important prognostic factors in order to get a true estimate of any benefit or harm associated with RHC.
The data is available by following these instructions.
# read in data only once from the web - info on variables found at same url
# rhc <-  load(url("https://biostat.app.vumc.org/wiki/pub/Main/DataSets/rhc.csv"))
# save the data and then load it
# rhc <- read.csv("~/Downloads/rhc.csv", row.names = 1)
# write.csv(rhc,"data/rhc.csv", row.names = FALSE)

rhc <- read_csv("data/rhc.csv")
The website gives formal definitions for each variable but for our purposes it is sufficient to know that the exposure variable is swang1,the outcome is death and the other retained variables are potential confounders. We will work with a reduced set of covariates as shown here.
# create a simpler data set with these limited variables,
ARF<-as.numeric(rhc$cat1=='ARF')
CHF<-as.numeric(rhc$cat1=='CHF')
Cirr<-as.numeric(rhc$cat1=='Cirrhosis')
colcan<-as.numeric(rhc$cat1=='Colon Cancer')
Coma<-as.numeric(rhc$cat1=='Coma')
COPD<-as.numeric(rhc$cat1=='COPD')
lungcan<-as.numeric(rhc$cat1=='Lung Cancer')
MOSF<-as.numeric(rhc$cat1=='MOSF w/Malignancy')
sepsis<-as.numeric(rhc$cat1=='MOSF w/Sepsis')
female<-as.numeric(rhc$sex=='Female')
died<-as.integer(rhc$death=='Yes')
age<-rhc$age
treatment<-as.numeric(rhc$swang1=='RHC')
meanbp1<-rhc$meanbp1

# new dataset
mydata<-cbind(ARF,CHF,Cirr,colcan,Coma,lungcan,MOSF,sepsis,
              age,female,meanbp1,treatment,died)
mydata<-data.frame(mydata)

#covariates we will use (shorter list than you would likley use in practice)
xvars<-c("age","female","meanbp1","ARF","CHF","Cirr","colcan",
         "Coma","lungcan","MOSF","sepsis")
The data may be summarized in the following table along with the standardized mean differences (SMD) between the 2 exposure groups.
#look at a table 1
table1<- CreateTableOne(vars=xvars,strata="treatment", data=mydata, test=FALSE)
## include standardized mean difference (SMD)
print(table1,smd=TRUE)
## Stratified by treatment
## 0 1 SMD
## n 3551 2184
## age (mean (SD)) 61.76 (17.29) 60.75 (15.63) 0.061
## female (mean (SD)) 0.46 (0.50) 0.41 (0.49) 0.093
## meanbp1 (mean (SD)) 84.87 (38.87) 68.20 (34.24) 0.455
## ARF (mean (SD)) 0.45 (0.50) 0.42 (0.49) 0.059
## CHF (mean (SD)) 0.07 (0.25) 0.10 (0.29) 0.095
## Cirr (mean (SD)) 0.05 (0.22) 0.02 (0.15) 0.145
## colcan (mean (SD)) 0.00 (0.04) 0.00 (0.02) 0.038
## Coma (mean (SD)) 0.10 (0.29) 0.04 (0.20) 0.207
## lungcan (mean (SD)) 0.01 (0.10) 0.00 (0.05) 0.095
## MOSF (mean (SD)) 0.07 (0.25) 0.07 (0.26) 0.018
## sepsis (mean (SD)) 0.15 (0.36) 0.32 (0.47) 0.415This shows there is considerable unbalancing between these baseline variables among those who received and didn’t receive the RHC.
The crude data also shows an increased risk of death with RHC.
Epi::stat.table(list(treatment, died), contents=list(count(), "(%)" = percent(died)),
           margin=T, data=mydata)
## ------------------------------------
## ----------died-----------
## treatment 0 1 Total
## ------------------------------------
## 0 1315 2236 3551
## 37.0 63.0 100.0
##
## 1 698 1486 2184
## 32.0 68.0 100.0
##
##
## Total 2013 3722 5735
## 35.1 64.9 100.0
## ------------------------------------The crude odds ratio can be calculated from 1) 2X2 table using epi.2by2 from the epiR library or 2) from standard logistic regression glm(formula, data, femily="binomial").
dd <- matrix(c(1486,698,2236,1315), nrow = 2, byrow = FALSE)
epiR::epi.2by2(dd)
## Outcome + Outcome - Total Inc risk * Odds
## Exposed + 1486 2236 3722 39.9 0.665
## Exposed - 698 1315 2013 34.7 0.531
## Total 2184 3551 5735 38.1 0.615
##
## Point estimates and 95% CIs:
## -------------------------------------------------------------------
## Inc risk ratio 1.15 (1.07, 1.24)
## Odds ratio 1.25 (1.12, 1.40)
## Attrib risk * 5.25 (2.64, 7.86)
## Attrib risk in population * 3.41 (0.98, 5.84)
## Attrib fraction in exposed (%) 13.15 (6.69, 19.16)
## Attrib fraction in population (%) 8.95 (4.39, 13.29)
## -------------------------------------------------------------------
## Test that OR = 1: chi2(1) = 15.272 Pr>chi2 = <0.001
## Wald confidence limits
## CI: confidence interval
## * Outcomes per 100 population unitsglm.obj<-glm(died~treatment, data= mydata, family="binomial")
summary(glm.obj)##
## Call:
## glm(formula = died ~ treatment, family = "binomial", data = mydata)
##
## Deviance Residuals:
## Min 1Q Median 3Q Max
## -1.510 -1.409 0.878 0.962 0.962
##
## Coefficients:
## Estimate Std. Error z value Pr(>|z|)
## (Intercept) 0.5309 0.0348 15.3 < 2e-16
## treatment 0.2248 0.0576 3.9 9.4e-05
##
## (Dispersion parameter for binomial family taken to be 1)
##
## Null deviance: 7433.3 on 5734 degrees of freedom
## Residual deviance: 7417.9 on 5733 degrees of freedom
## AIC: 7422
##
## Number of Fisher Scoring iterations: 4Both approached provide an increased odds ratio of 1.25 (exp(treatment coeficient) = exp(.2248) = 1.25).
Of more interest is the adjusted odds ratio, calculated after balancing the measured covariates of the 2 groups, by following these steps;
- Build a logistic model of for the probability of being exposed (propensity score)
- Use the 1/PS for the exposed and 1/(1-PS) for the unexposed to create a pseudo-population
- Examine the standardized mean differences (SMD) between the 2 groups to assess the success of balancing
# step 1 - build PS model using all available variables (could be expanded to include interaction terms)
psmodel <- glm(treatment ~ age + female + meanbp1+ARF+CHF+Cirr+colcan+
                   Coma+lungcan+MOSF+sepsis,family  = binomial(link ="logit"))

## step 2 - calculate propensity score for each subject and then use it to calculate weights
ps <-predict(psmodel, type = "response")
weight<-ifelse(treatment==1,1/(ps),1/(1-ps))
#apply weights to data
weighteddata<-svydesign(ids = ~ 1, data =mydata, weights = ~ weight)

# step 3 - display the weighted table (pseudo-population) with SMD
weightedtable <-svyCreateTableOne(vars = xvars, strata = "treatment",
                                  data = weighteddata, test = FALSE)
print(weightedtable, smd = TRUE)
## Stratified by treatment
## 0 1 SMD
## n 5732.49 5744.88
## age (mean (SD)) 61.36 (17.56) 61.43 (15.33) 0.004
## female (mean (SD)) 0.45 (0.50) 0.45 (0.50) 0.001
## meanbp1 (mean (SD)) 78.60 (37.58) 79.26 (40.31) 0.017
## ARF (mean (SD)) 0.44 (0.50) 0.44 (0.50) 0.010
## CHF (mean (SD)) 0.08 (0.27) 0.08 (0.27) 0.005
## Cirr (mean (SD)) 0.04 (0.19) 0.04 (0.19) 0.001
## colcan (mean (SD)) 0.00 (0.04) 0.00 (0.06) 0.042
## Coma (mean (SD)) 0.08 (0.26) 0.07 (0.25) 0.023
## lungcan (mean (SD)) 0.01 (0.08) 0.01 (0.09) 0.014
## MOSF (mean (SD)) 0.07 (0.26) 0.07 (0.26) 0.004
## sepsis (mean (SD)) 0.21 (0.41) 0.22 (0.41) 0.002The success of the creation of the pseudo-population in establishing balance between the measured covariates is well demonstrated in the above Table. Of course, our inability to make a comparable statement about differences in unmeasured covariates remains the main limitation of this approach.
We can now evaluate the association of the exposure and the outcome in this pseudo-population dataset.
#get causal relative risk. Weighted GLM
glm.obj<-glm(died~treatment,weights=weight,family=quasibinomial(link=log))
#summary(glm.obj)
betaiptw<-coef(glm.obj)
#to properly account for weighting, use asymptotic (sandwich) variance
SE<-sqrt(diag(vcovHC(glm.obj, type="HC0")))

#get point estimate and CI for relative risk (need to exponentiate)
causalrr<-exp(betaiptw[2])
lcl<-exp(betaiptw[2]-1.96*SE[2])
ucl<-exp(betaiptw[2]+1.96*SE[2])

paste0("The point estimate is ", round(causalrr,3), " and the 95%CI is ", round(lcl,3), " - ", round(ucl,3) )
## [1] "The point estimate is 1.082 and the 95%CI is 1.037 - 1.129"Accounting for the unbalance among the covariates, leads to a reduction in the magnitude of harm associated with RHC but the increased risk of mortality, 8.2%, remains statistically significant.
One of the limitations of the IPW approach is that extreme PS lead to very large weights which may bias the results. Often truncation of large weights, e.g. > 10, is suggested as a safeguard against this excessive weighting of any individual score.
#truncate weights at 10

truncweight<-replace(weight,weight>10,10)
#get causal risk ratio
glm.obj<-glm(died~treatment,weights=truncweight,family=quasibinomial(link="log"))
betaiptw<-coef(glm.obj)
#to properly account for weighting, use asymptotic (sandwich) variance
SE<-sqrt(diag(vcovHC(glm.obj, type="HC0")))

#get point estimate and CI for relative risk (need to exponentiate)
causalrr<-exp(betaiptw[2])
lcl<-exp(betaiptw[2]-1.96*SE[2])
ucl<-exp(betaiptw[2]+1.96*SE[2])
paste0("The point estimate is ", round(causalrr,3), " and the 95%CI is ", round(lcl,3), " - ", round(ucl,3) )
## [1] "The point estimate is 1.087 and the 95%CI is 1.043 - 1.133"In this case, the tuncation made no meaningful change in the result.
The same exercise can be repeated using the ipw package.
#first fit propensity score model to get weights
weightmodel<-ipwpoint(exposure= treatment, family = "binomial", link ="logit",
                      denominator= ~ age + female + meanbp1+ARF+CHF+Cirr+colcan+
                          Coma+lungcan+MOSF+sepsis, data=mydata)
#numeric summary and plot of weights
print("Summary and graph of calculated weights\n")
## [1] "Summary and graph of calculated weights\n"summary(weightmodel$ipw.weights)## Min. 1st Qu. Median Mean 3rd Qu. Max.
## 1.05 1.41 1.72 2.00 2.28 21.61ipwplot(weights = weightmodel$ipw.weights, logscale = FALSE,
main = "weights", xlim = c(0, 22))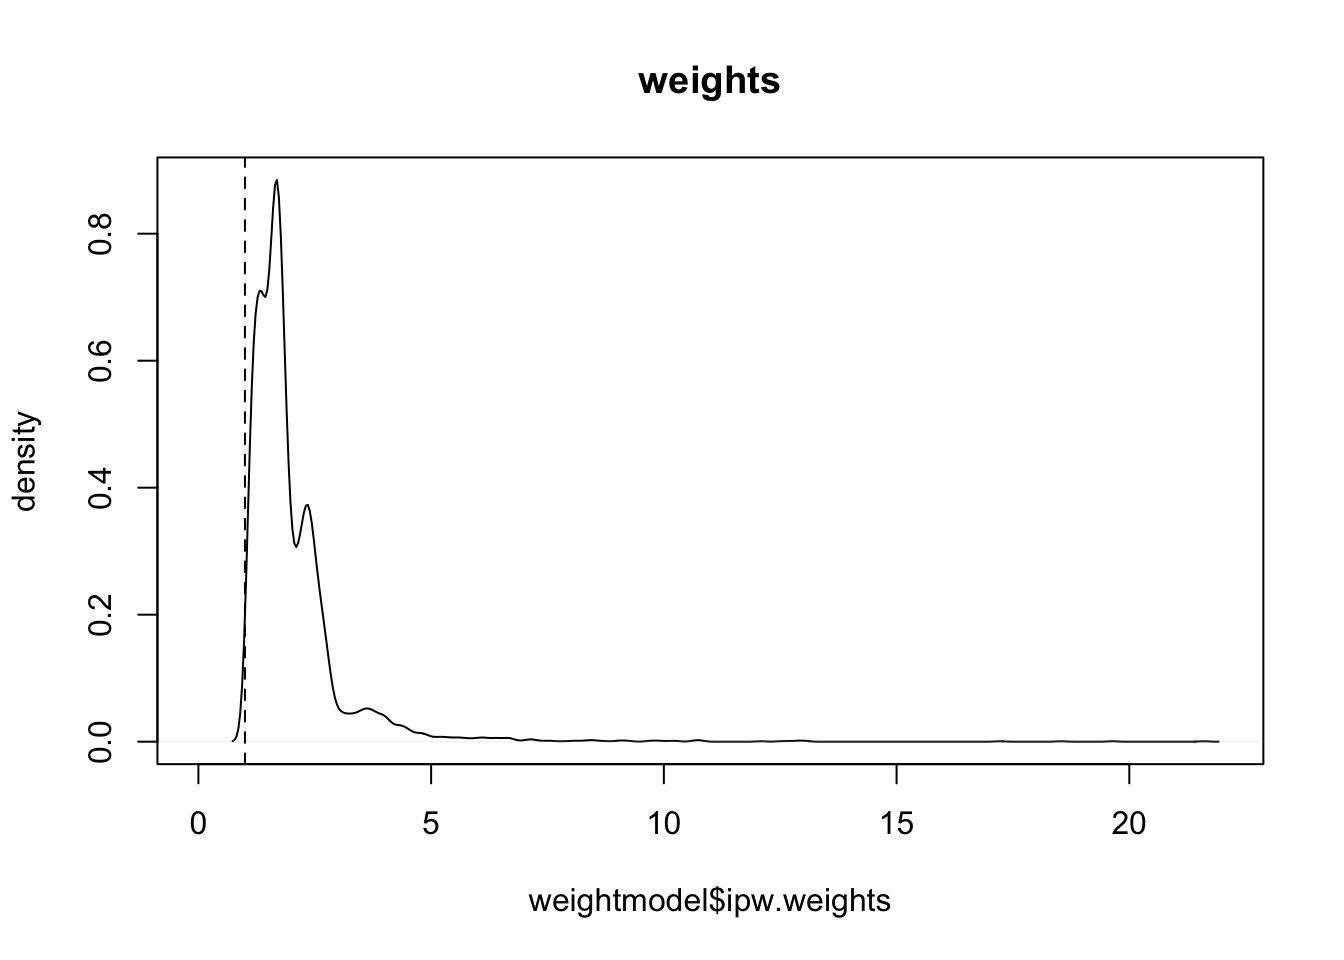
# update dataset with weights
mydata$wt<-weightmodel$ipw.weights

#fit the model
glm.obj<-glm(died~treatment,data=mydata, weights=mydata$wt,family=quasibinomial(link=log))

paste0("The point estimate is ", round(exp(coef(glm.obj)[2]),3), " and the 95%CI is ", round(exp(confint(glm.obj)[2]),3), " - ", round(exp(confint(glm.obj)[4]),3))
## [1] "The point estimate is 1.082 and the 95%CI is 1.042 - 1.123"This gives a consistent answer of increased risk with RHC in critically ill patients. However as mentioned previously, we may be concerned about possible unmeasured confounding. For example, we may wish to examine the robustness of the results by calculating the magnitude of an unmeasured confounder that would be required to negate the observed association.
This approach, known as e value, is well described and presented in this publication. Of course, there exists a R package, Evalue that automates the calculations.
evalues.RR(est = 1.087, lo = 1.043, hi = 1.133) ## point lower upper
## RR 1.087 1.043 1.133
## E-values 1.395 1.255 NAThus an unmeasured confounder that had a 39% increased risk of presence in the exposed group and had a 39% increased risk of death would be enough to cancel out the observed increased risk with RHC. If the strength of one of these relationships were weaker, the other would have to be stronger for the causal effect of RHC on mortality to be truly null.
To see how the magnitude of the exposure-confounder and the confounder-outcome relationships would have to vary to fully explain the observed association, we can use the bias_plot().
bias_plot(1.087, xmax = 5)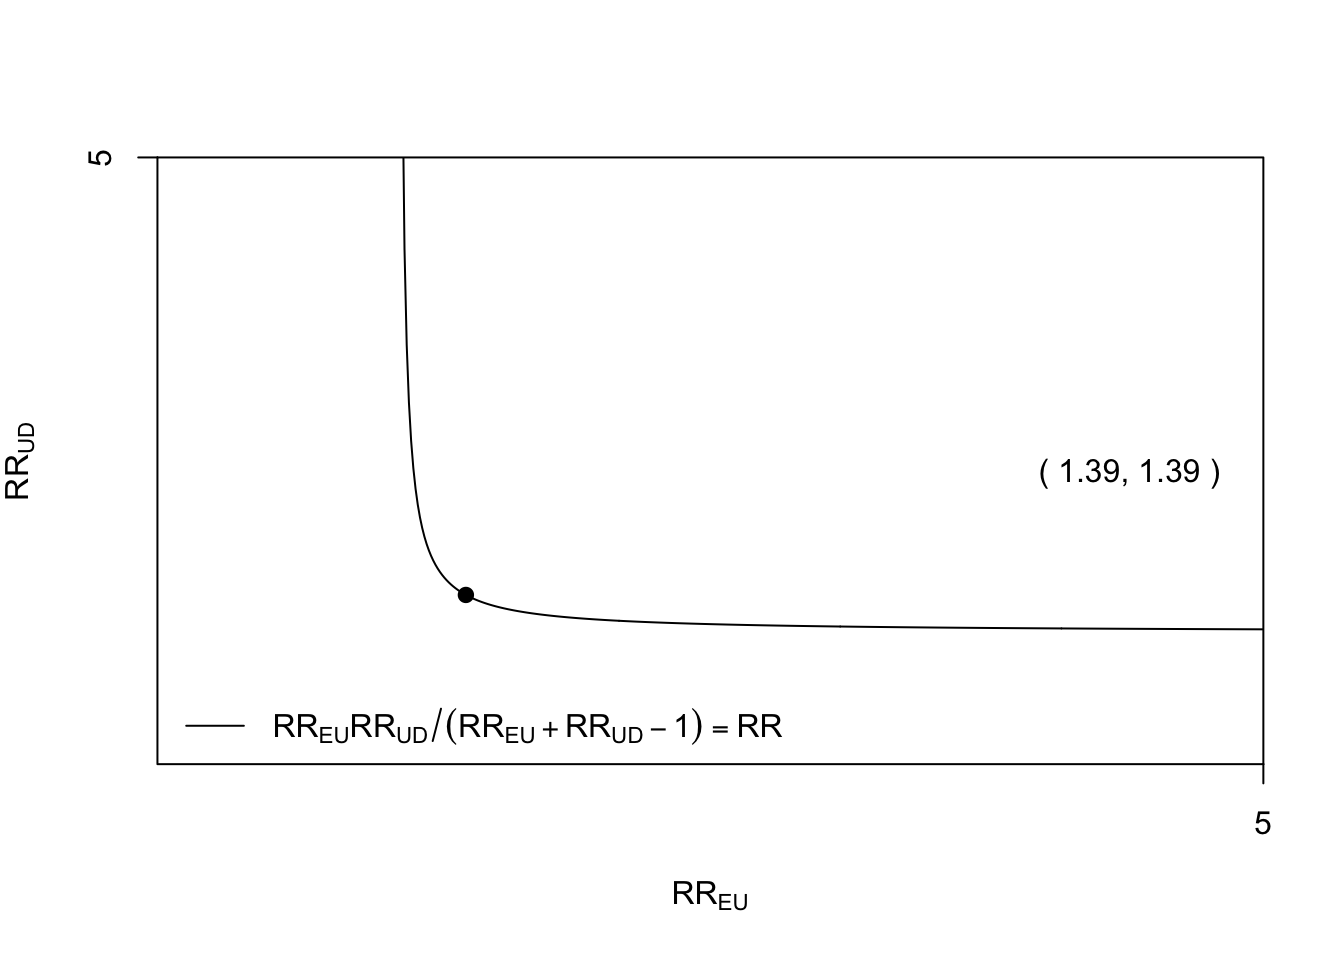
As these magnitudes of association for an unmeasured confounder are far from impossible, we should be cautious in our assessment of the robustness of the observed association between RHC and increased mortality.