5.3 Decomposition of a time-series
- A time-series typically has four components:
Trend (T) is the gradual upward or downward movement of the data over time
Seasonality (S) is a pattern of demand fluctuations above or below trend line that repeats at regular intervals
Cycles (C) are patterns in annual data that occur every several years
Random variations (R) are “blips” in the data caused by chance and unusual situations
Example 5.1 Three time-series of the same varaible are presented on the Figure 5.4. Answer the following questions:
Which time-series exhibit trend component only?
Which time-series exhibit trending behaviour along with seasonality?
Does trending behaviour indicate upward or downward tendency in the long-run?
Which time-series is the smoothest?
Which time-series exhibit random variations the most?
Which time-series exhibit cycles?
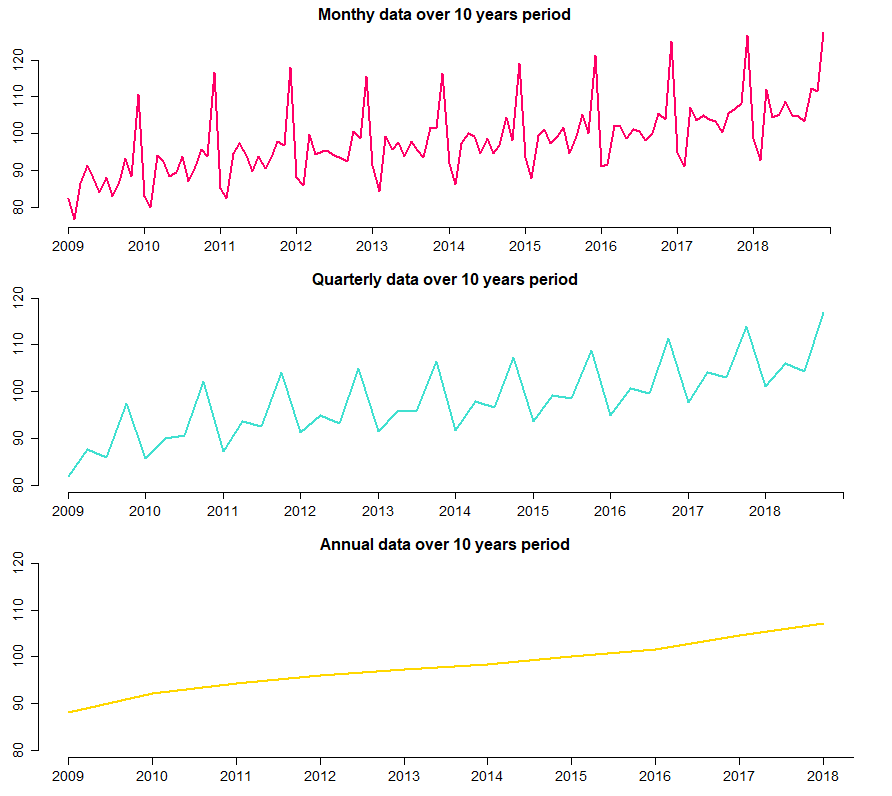
FIGURE 5.4: Monthly, quarterly and annual time-series of retail trade (except of motor vehicles and motorcycles)
- There are two general forms of time-series decomposition
- The multiplicative model:
\[\begin{equation} Y=T \cdot S \cdot C \cdot R \tag{5.1} \end{equation}\]
- The additive model:
\[\begin{equation} Y=T + S + C + R \tag{5.2} \end{equation}\]
Models may be combinations of these two forms
Forecasters often assume errors are normally distributed with a mean of zero